President Trump has promised to induce $1 trillion of new public and private investment in infrastructure over the next decade. He believes that strategy will be beneficial both for short-run, macroeconomic reasons (it will stimulate the economy) and for long-run, microeconomic reasons (it will improve productivity). This paper assesses both sets of reasoning, finding that the case for more government investment is significantly weaker than commonly asserted.
Because the United States is at or near full employment with interest rates rising, standard Keynesian arguments do not suggest infrastructure spending financed by borrowing would offer a macroeconomic stimulus. In practice, major projects take years of planning and cannot be used readily to manage the economy anyway.
Historical evidence showing significant positive effects of government infrastructure investments on productivity provides little guidance on the worthiness of new projects today. Congestion and changing demand patterns do necessitate new infrastructure investments, and government spending in certain areas can enhance growth. But U.S. infrastructure is not in the dire physical condition asserted by politicians, scope for more private funding is ample, and resources allocated through the political process are often badly managed and prioritize ambitions that undermine economic performance.
The focus on the supposed stimulus and productivity-enhancing effects of infrastructure spending means policy debates center heavily on government funding. Yet proposals for more federal spending, costly tax credits, or public-private partnerships ignore that the primary barriers to responsive infrastructure relate to structures and incentives. Rather than imposing further costs on taxpayers, the new administration should prioritize localizing decisionmaking, removing regulatory barriers to private investment, encouraging the use of user fees, and removing tax exemptions for public investment.
Introduction
President Trump has made infrastructure investment a key plank of his economic agenda. At his victory rally, he promised:
We are going to fix our inner cities and rebuild our highways, bridges, tunnels, airports, schools, hospitals. We’re going to rebuild our infrastructure, which will become, by the way, second to none. And we will put millions of our people to work as we rebuild it.1
His website pledged to “transform America’s crumbling infrastructure into a golden opportunity for accelerated economic growth and more rapid productivity gains.”2 Since the election, his team has reiterated its desire to induce $1 trillion of new infrastructure investment (through public and private funds) over a decade.3 The infrastructure initiative published alongside the 2018 budget, for example, pledged $200 billion of new federal funds, with the hope this would harness additional state and private funding up to the $1 trillion target.4
Such an agenda appears to have broad bipartisan support. Senate Democrats are pushing their own package of $1 trillion of investment projects, albeit with a preference for direct deficit financing by the federal government.5
Trump and Senate Democrats are the latest in a long line of politicians and economists to suggest that infrastructure investment could significantly improve economic fortunes in developed countries. Former treasury secretary Lawrence H. Summers summed up conventional wisdom last fall when he argued that infrastructure investment “can create quality jobs and provide economic stimulus” and “can expand the economy’s capacity in the medium term.”6
The economic need for more government spending on infrastructure is therefore presented as an open-and-shut case. It offers something to those concerned with both the macroeconomic health of the economy and its capacity for future productivity growth.
For those who believe the economy is operating below its macroeconomic potential, government borrowing to fund infrastructure spending is seen as a means to boost aggregate demand and put idle resources and unemployed people to work. Capital investment projects are believed to have larger economic multipliers than transfers or tax cuts, so investment spending on roads, highways, and bridges is believed to be a particularly effective tool for keeping the economy at its potential.
For those who believe that the microeconomic foundations of the economy are in a poor state, and that this condition is adversely affecting growth, infrastructure spending allegedly provides essential public goods or greases the wheels of economic activity through improving mobility, enhancing the economy’s capacity to grow.
President Trump’s team has at times used both explanations as justifications for government action. Many of his supporters—wary of Republican opposition to stimulus packages—claim his proposed infrastructure bill is about long-term growth rather than short-term stimulus. However, a leaked letter from the National Governors Association in December indicated that projects considered for federal funds should be “shovel-ready” and a “direct job creator.”7 That sounds suspiciously like the language of macroeconomic stimulus advocates.
This paper assesses whether the macroeconomic and productivity arguments for more government infrastructure spending are robust. Drawing on theory and evidence, it assesses both the general arguments for more infrastructure spending to boost the economy and whether conditions today are conducive to such an agenda. It concludes by examining the most common policy proposals and draws on economic reasoning to suggest alternative means of improving infrastructure development.
Infrastructure Spending for Macroeconomic Management
The early 2000s onward have brought on a revival in economists and politicians advocating discretionary fiscal policy as a means of macroeconomic management. They argue that when an economy is operating below its potential, government purchases, increased transfers, or tax cuts can be used to increase aggregate demand and help put resources back to work.
Infrastructure investment, supposedly, is particularly effective because it is believed to have a high spending multiplier. A dollar spent on government infrastructure investment is said to boost private-sector activity enough that measured gross domestic product (GDP) increases above and beyond the original government investment itself. President Barack Obama’s Council of Economic Advisers, for example, assumed that each $1 investment in infrastructure in the 2009 American Recovery and Reinvestment Plan would increase GDP by about $1.50 after one year, significantly higher than the multiplier implied by tax cuts (0.66).8
According to the logic of this macroeconomic case for infrastructure spending, government spending can be used seamlessly as a means of alleviating underutilization of resources as demand turns down. Some go further, suggesting that this short-term attempted stimulus will benefit the economy in the longer term too, by preventing labor and capital from suffering a degradation of skills or falling into disrepair.9
Does Fiscal Stimulus “Work”?
Whether fiscal policy works to boost short-run GDP has been hotly contested since John Maynard Keynes and F. A. Hayek debated it in the 1930s. Academic economists are divided on the true value of spending multipliers associated with fiscal policy changes, not least because they tend to be time- and project-specific, while being difficult to estimate because of limited agreement on the appropriate methodological approach.10
Depending on the models used, the circumstances of countries examined, and the type of government spending, empirical work has produced both short-term multiplier values between 0 and 1 (meaning government spending expands output but crowds out some private-sector activity),11 and multipliers above 1 (meaning government spending “crowds in” private-sector investment or consumption).12 Longer-term multipliers might even be negative, meaning deficit-financed spending actually reduces GDP in the longer term (for example, if a high degree of substitution between private and government consumption exists, and government consumption encourages leisure over work).13
Analysis of individual “stimulus” programs tends to be particularly controversial, because it is difficult to disentangle the effects of policy from other factors and to ascertain a clear metric for success. A plurality of studies examining President Obama’s stimulus package suggest that it caused a temporary boost to GDP, for example.14 But much analysis suggests that any uplift was much smaller than expected and came at a high cost, while different components of the package had vastly differing economic effects.15 Certainly, unemployment peaked at a higher level and fell much more slowly than the Obama administration envisaged.16 Advocates of the stimulus claim that was because the crisis was worse than they realized, whereas skeptics of the stimulus believe it was because the stimulus underdelivered.
The problem in ascertaining the effects of fiscal policy changes is they do not occur in a vacuum. Much ink has been spilled on the implicit assumptions underpinning the story told above, not least the potential interaction of any fiscal expansion with monetary policy in an inflation-targeting regime, and whether other policy changes might have actually exacerbated the downturn.17
Nevertheless, the academic literature enables us to draw some broad conclusions about how the structural conditions of economies affect attempted fiscal expansions.
Country characteristics. First, countries with certain characteristics—such as floating exchange rates and high levels of public debt—tend to have low fiscal multipliers in general.18 Government borrowing puts upward pressure on the exchange rate. London School of Economics lecturer Ethan Ilzetzki’s work shows that in a country targeting a fixed exchange rate, the central bank will try to restore the value of the exchange rate by lowering interest rates, accommodating the fiscal expansion with monetary expansion.19 Such action leads to high multipliers. Conversely, in countries with flexible exchange rates and an inflation-targeting regime, central banks will tend to raise interest rates and hence offset the fiscal expansion. Countries with flexible exchange rates therefore see multipliers around 0.
Similarly, he finds highly indebted countries have low government spending multipliers. That is consistent with the idea that highly indebted countries are more likely to experience what economists dub Ricardian equivalence (consumers rein in spending now if government spending increases, realizing taxes will likely rise in the future to finance the borrowing). That reaction offsets any positive effect of the government spending on GDP.
Empirical research and stylized facts about consumption behavior suggest that full Ricardian equivalence is highly unlikely. Although some consumers seem to be forward looking, many consumers behave according to a “rule of thumb,” adjusting their consumption to changes in incomes, even if temporary.20 That fact has been backed up by recent empirical work analyzing individuals on unemployment insurance.21 If correct, a fiscal expansion would lift GDP and would not be fully offset. That Ilzetzki’s results imply full offset in countries with high debts suggests that consumers are more likely to be aware of the government’s budget constraint when debt levels are high (and perhaps the need for near-term consolidation features in public discourse).
In other words, in countries with floating exchange rates and high public debts, higher public borrowing will at best crowd out significant amounts of private-sector activity, with government spending having a minimal effect on GDP.
State of the economy and monetary policy. The second broad conclusion shows that fiscal multipliers vary according to the state of the economy. In times when the economy is in a downturn or recession, multipliers tend to be higher than when the economy is growing quickly or at “full employment.” A typical result for the United States suggests that multipliers are 0 during an economic expansion but above 1 during a recession.22 This outcome is intuitive; without idle resources, government spending is more likely to crowd out private-sector activity.
The interaction between monetary and fiscal policy is even more important. The economic consensus of the past 40 years holds that, to the extent macroeconomic management in downturns is necessary and desirable, it is best carried out via monetary policy. Many economists believe this holds under all economic conditions, irrespective of the level of interest rates. Some economists believe, though, that the conditions following the financial crisis presented a unique period when fiscal policy could be effective.
The New Keynesian models they cite assume that recessions are caused by a sudden increase in the desire to save following shocks. The central bank can ordinarily correct for that by reducing interest rates. But when nominal rates are already zero, the central bank is unable to fulfill this role, and so government should spend more to put upward pressure on prices, in turn further reducing the real interest rate and so encouraging spending.23
The key point is that fiscal expansions only work effectively to stimulate the economy if the monetary authorities do not offset the effects of the fiscal expansion. Even in most New Keynesian models then, fiscal policy should be limited to use in the special case where nominal interest rates are zero and the monetary authority is below its target for inflation or nominal GDP. That conclusion implicitly assumes that other monetary policy tools, such as quantitative easing, are ineffective when interest rates are zero, which itself is a challengeable claim. The takeaway here, though, is that even according to their own models, New Keynesians should believe fiscal stimulus is effective only under very rare conditions.
Timing and dose. A third conclusion about the efficacy of fiscal stimulus is that it relies on having accurate information on the state of the economy. That factor is necessary to work out whether, when, and how much to spend or reduce taxes to attempt to remedy an economy below its potential.
The first seeds of the Great Recession, for example, occurred in December 2007, but the Obama fiscal stimulus package was not agreed on in the United States until 2009, with much of the spending occurring later in 2010. Far from keeping the economy on an even keel, fiscal policy applied at the wrong time has the potential to exacerbate the boom–bust cycle. This problem has been described as the “long and variable” lag argument, put forward by Milton Friedman. Policy tends to take time to operate, and governments often make faulty forecasts about the state of the economy. By the time spending actually comes on board, the health of the economy might be much improved.
Similar concerns about the inaccuracies of assessments of economic health affect the “dose.” Assessing an economy’s potential output to determine how much stimulus is necessary is particularly difficult. In the debate about closing deficits across the world after 2010, many governments revised down the sustainable growth rates of their economies, believing the financial crisis had adversely affected their capacity to grow. A larger proportion of the budget deficits was thus considered “structural,” necessitating further spending cuts to achieve fiscal objectives.24 But these judgments were highly uncertain. More recent research suggests that revisions to the productive potential of the economy can have self-fulfilling consequences if believed, as forward-looking consumers adjust their spending to changed outlooks for lifetime incomes.25
The interaction between federal and state governments adds further complexity in the United States. Even if the federal government could perfectly assess economic health and the stimulus required to reach economic potential, a spending program might “crowd out” state spending activity, thus having no net effect on government spending overall. A new report by economist William Dupor of the Federal Reserve Bank of St. Louis gives a specific example of this outcome in relation to highway funding under the 2009 American Recovery and Reinvestment Act. He finds that “as states spent Recovery Act highway grants, many simultaneously slashed their own contributions to highway infrastructure, freeing up state dollars for other uses,” and that receiving grants appeared to have no causal relationship on total state spending.26 His finding backs up other research suggesting that states used the increased federal spending as an opportunity to accumulate financial assets during the earliest phases of the Recovery Act,27a potential problem with stimulus schemes long noted by prominent economists.28 In a seminal paper as far back as 1956, economist E. Cary Brown outlined how the economic effects of federal expansions in the 1930s were undermined by the “contractive effects of state and local governments.”29 Indeed, the recent 2018 budget infrastructure initiative acknowledged that the “flexibility to use Federal dollars to pay for essentially local infrastructure projects has created an unhealthy dynamic in which State and local governments delay projects in the hope of receiving Federal funds.”30
The longer-term effects. Finally, given that the primary aim of fiscal expansions is to put resources to work for the short term, the stimulus theory says nothing about what the money should be spent on and how that might affect economic activity in the medium to long term. Temporary borrowing may actually worsen the long-term growth potential of the economy because of the costs associated with financing the spending and misallocating resources.
Let’s assume that Keynesian theories work in practice and the federal government increased investment spending for one year. Any temporary GDP boost associated with the increase in spending in Year 1 will be offset by cuts to that spending of an equivalent amount at some later date. Governments will also have to service the increase in the debt burden, with higher taxes paid to cover interest payments on the debt in the long term. If the deleterious effect of the long-run tax hikes on productivity growth exceeds any productivity benefit of the temporary spending, then the long-run effect of a fiscal expansion will be contractionary for the economy.
Stimulus measures also have the potential to undermine long-term growth potential by misallocating resources. Economist and political commentator Paul Krugman once articulated the logical conclusion of the case for government discretionary borrowing during recessions when he argued that a fake alien invasion could end the post-financial crisis slump if governments were to spend hugely on defense and military equipment. Yet such spending would have been economically useless in the longer term, retarding the growth potential of the economy by misallocating resources away from productive activity.31
In a real-life example, President Obama’s “Cash for Clunkers” program saw the federal government pay automobile dealers between $3,500 and $4,500 each time a customer traded in an older, less fuel-efficient vehicle and purchased a newer, more fuel-efficient vehicle. That program incentivized people to dispose of cars prematurely, with some cars ultimately destroyed, wasting resources. The result was at best a short-run boost to output that was later reversed,32 but it may have actually reduced overall spending, because many who traded in subsequently bought much cheaper fuel-efficient cars than they would have done otherwise.33
The mere act of engaging in stimulus spending can be a further drag on the economy by creating uncertainty about future policy or by providing incentives for companies and entrepreneurs to invest in unproductive rent-seeking activities.
Some economists, such as Larry Summers and Brad DeLong, counter that temporary government spending in downturns can in fact raise the long-term productive potential of the economy. In their view, if the economy operates below potential over long periods, workers’ skills waste away and a dearth of investment reduces the capital stock, generating a phenomenon known as “hysteresis.” Preventing this erosion of skills and underinvestment can therefore raise potential output if the temporary spending can prevent resources from falling idle.
For this analysis to hold, however, we have to presume that temporary spending by government will permanently maintain the skills of workers and that, absent the spending, workers would not have retrained. In essence, government must have the knowledge to bridge the gap in the short term and to generate the private-sector skills or investment to replace the subsequently withdrawn government spending. In her comment on the Summers-DeLong paper, economist Valerie Ramey showed that little evidence exists for the idea that temporary increases in government spending raise output in the long run.34
Is Government Infrastructure Investment the Best Tool for Fiscal Stimulus?
Even if we accept that fiscal policy works as expected, a key question is whether infrastructure investment is the best mechanism for delivering a stimulus.
Keynesian economists frequently cite multiplier estimates suggesting government investment spending has significantly bigger effects than either tax cuts or government consumption spending.35 Yet much counterevidence is available. International Monetary Fund (IMF) analysis, for example, has found that government investment has largely indistinguishable multipliers from government consumption spending for open, flexible exchange rate countries or for highly indebted governments. In fact, a growing literature (primarily based on so-called narrative studies) suggests that tax-based stimulus programs may be more effective for short-term growth.36 More recent analysis also suggests that tax rate increases have far worse effects on output than public spending cuts in fiscal consolidation programs.37
One reason government investment spending might be an ineffective form of fiscal stimulus is that infrastructure projects have long lead times. Even if we accurately assess the “demand deficiency” of the economy, undertaking investment to coincide with a recession or slowdown is difficult. In the words of the IMF, infrastructure investments “require coordination among federal, state, and local governments and have to go through a long process of planning, bidding, contracting, construction, and evaluation.”38
Government-imposed constraints, such as land-use planning laws and environmental audits, often delay projects. President Obama realized that fact in relation to his stimulus program, acknowledging as far back as 2010 that “there’s no such thing as shovel-ready projects.”39 By the end of 2009, actual infrastructure spending was just 10 percent of that authorized for the year.40
Such delays can severely limit any positive effect of the spending and may even exacerbate the downturn. The expectation of productive government spending and hence higher living standards reduces work effort today, but if the project is delayed then that outweighs any positive effect on labor and output from the actual spending. In fact, the IMF attributes delays as a potential explanation to why President Obama’s stimulus package made much less of a dent on unemployment than expected. By the second quarter of 2010, President Obama’s economics team had expected the unemployment rate to have fallen to 7.5 percent. In fact, it was 9.6 percent.41 (Other factors might explain the difference between forecasts and outcomes, not least fiscal stimulus working less well than expected or the legacy effects of the financial crisis being more severe than believed.)
In contrast to investment spending, changes to tax rates can be implemented and reversed more quickly (subject to political and legislative restraints). They can also provide positive supply-side effects by improving incentives to work, save, and invest. To the extent that we expect fiscal stimulus to work as Keynesian theory would predict, delays associated with infrastructure expenditure might mean tax cuts are more effective.
In addition to short-run concerns, political considerations mean government investment spending might worsen longer-term economic performance if used for short-term demand management. In deciding to use infrastructure spending to directly support jobs, boost the economies of certain localities, or find “shovel-ready” projects, programs may be selected that undermine the economy in the longer term.
If short-term jobs are a primary concern, more labor may be used for projects than is economically efficient, meaning higher costs for taxpayers. “Jobs” are a cost, not a benefit, of investments, and those “created” come only through the diversion of resources and opportunities from other parts of the economy. To highlight that fact, Milton Friedman is frequently quoted as reacting to the absence of heavy machinery in a canal built in Asia in the 1960s by asking why the project was being undertaken by men with shovels. Upon being told it was a “jobs program,” he said: “I thought you were trying to build a canal. If you really want to create jobs, then by all means give these men spoons, not shovels.”
Attempts to allocate funds to certain localities may likewise pour resources into regions with poor economic fundamentals when the same investment could have been better used to improve connectivity for regions with more growth potential. Funneling money quickly into “shovel-ready” projects may lead to bad decisionmaking and encourage rent seeking. As noted, guidance sent to governors by President Trump’s transition team suggested that projects considered for federal support should include those that were “shovel ready” and direct job creators, and that would support manufacturing employment. Given the leaked priority list of projects, moreover, resources might also be allocated according to the political party landscape in different states.
Attempts to boost demand in the short term can therefore lead to investment in projects producing unproductive capital in the longer term. If so, as IMF analysis has found, the need to adjust for the temporary fiscal expansion through cuts to transfer programs, increased government consumption, and especially tax increases in the future can actually contract the economy in the longer term.
Figure 1
Civilian Unemployment, U-5, U-6 rates
Source: U.S. Bureau of Labor Statistics, Employment Situation.
Does a Case for a Government Infrastructure Fiscal Stimulus Exist Now?
All this is moot for the United States right now. Macroeconomic indicators show little evidence that the economy requires a fiscal stimulus on Keynesian grounds, or that it would be effective or desirable.
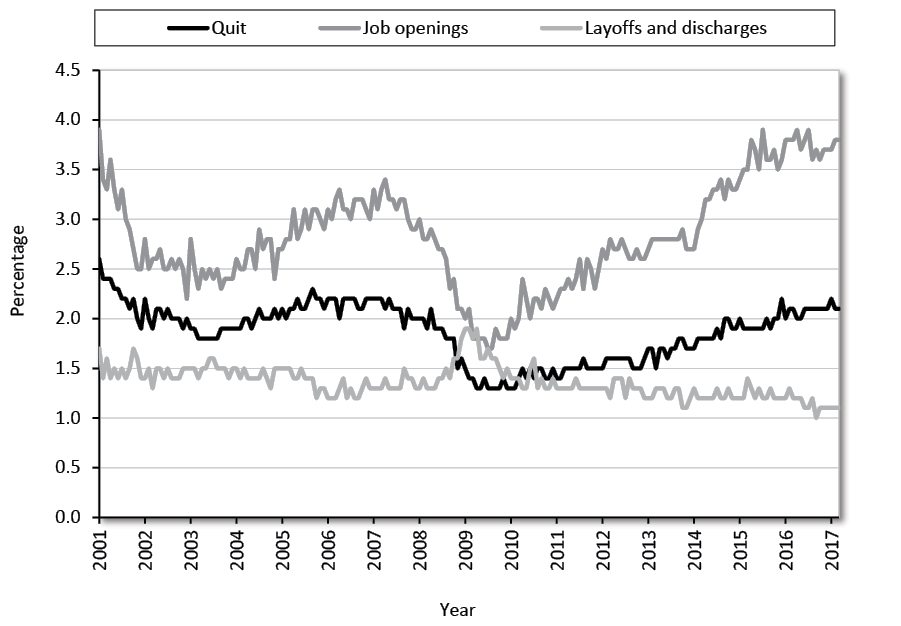
The U.S. economy is close to “full employment.” The civilian unemployment rate currently stands at 4.4 percent, having fallen from an official high of 10 percent in October 2009 (Figure 1). The current rate is below the Congressional Budget Office (CBO)’s estimate for the “natural rate of unemployment” of 4.7 percent.42 The unemployment rate has been below the current 4.4 percent rate in only 5 percent of all monthly observations since 1970. Labor-market tightening is also evidenced by other indicators returning to precrisis levels. The job openings rate is now above that seen precrisis, and the layoff and discharge rates below, whereas quit rates are about the same (Figure 2).
It is true that the overall civilian employment- to-population ratio—which fell substantially after 2008—has failed to reach its precrisis level (Figure 3). But drilling down further shows that the employment rate for 25- to 54-year-olds, although not fully recovered, is still relatively high historically and has rebounded to 78.3 percent from 74.8 percent in 2009 (compared with an average of 80.1 percent from 1997 to 2007). A big part of the story behind the lower overall work rates is older people opting out of the formal labor market, a structural story at least partly explained by demographic trends. It seems unlikely that significant numbers of these “discouraged” workers are the civil engineers or construction workers most likely to be employed in major infrastructure projects.
Figure 2
Quit, Job Openings, and Layoff and Discharge Rates
Source: U.S. Bureau of Labor Statistics, Job Openings and Labor Turnover.
Other measures of unemployment, including the U.S. Department of Labor’s U-5 unemployment rate (which adds discouraged and other marginally attached workers) and U-6 unemployment rate (which adds those part-time for economic reasons) are back to the levels of the mid-2000s.
True, recent analysis by Regis Barnichon and Geert Mesters suggests that accounting more comprehensively for an aging population widens slack in the market, raising the unemployment rate by 0.3 percentage points.43 But this rate is still around the CBO’s estimate for the natural rate, and the construction industry unemployment rate (which seems a particularly relevant measure of spare capacity for an infrastructure program) was lower in every single month of 2016 than the equivalent month in 2007 before the financial crisis.44 Any attempted macroeconomic stimulus through infrastructure investment would therefore be likely to crowd out other construction activity.
Given that the Federal Reserve Bank (Fed) has begun to raise its target rate, the interaction between monetary and fiscal policy outlined above would imply that fiscal multipliers are near zero, too. Paul Krugman, for example, wrote a year ago:
Spending can be withdrawn later on without hurting employment, because once you’re out of the liquidity trap the Fed can offset the contractionary effects of a fiscal tightening by holding off on the monetary tightening it would otherwise have pursued.45
Other economic fundamentals suggest low fiscal multipliers right now as well. U.S. federal public debt stands at over 77 percent of GDP. The long-term outlook for the public finances is dire, driven by rising entitlement spending reflective of demographic trends and rising health care costs. The federal deficit is projected to be 2.9 percent in 2017, but if current policies remain largely unchanged, the CBO estimates that the annual deficit would rise to 4 percent of GDP over the next decade. That estimate is largely due to a continued growth in spending on Social Security and Medicare. Even this scenario would envisage taxes rising 1 percentage point above the average of the past five decades.
Figure 3
Civilian Employment-to-Population Ratio and Employment-to-Population Ratio for 25- to 54-Year-Olds
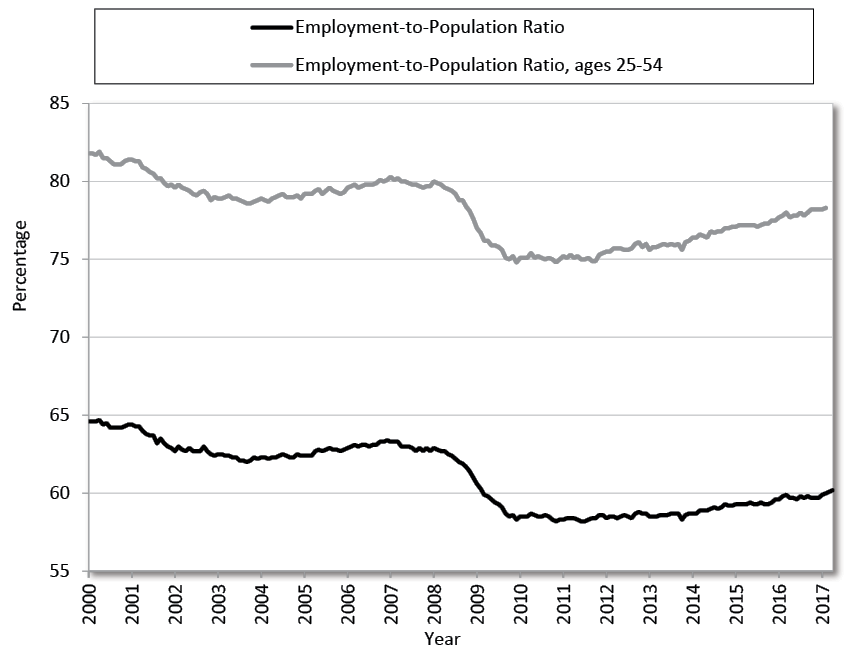
Source: U.S. Bureau of Labor Statistics, Employment Situation.
Against such a backdrop, a period of sustained growth would seem an appropriate time to consolidate the public finances through spending restraint and long-term entitlement reform. Theory would also suggest that any stimulus would be less powerful, as consumers and investors are increasingly aware of possible future tax increases. It would not seem the time to raise discretionary borrowing through an infrastructure stimulus program.
As a result, fewer economists nowadays argue that fiscal stimulus is necessary or desirable. Ben Bernanke, former chair of the Federal Reserve, exemplified this shift when he wrote, “Today, with the economy approaching full employment, the need for demand-side stimulus, while perhaps not entirely gone, is surely much less than it was three or four years ago.”46
Nevertheless, some economists continue to justify increases in spending. Krugman has previously suggested infrastructure investment as stimulus would be an “insurance,” given the U.S. economy remains close to having interest rates at zero.47 In his view, a possible downturn could lead to a position where once more the central bank has to slash interest rates. More government investment today could therefore help lift the natural rate of interest, giving more room for the Fed to cut interest rates in the future should a downturn appear.
Yet this argument only goes to show that infrastructure investment, as a “fiscal stimulus,” will not boost GDP. Any economic boost brought about by the higher investment spending would be offset by the Fed raising interest rates.
Krugman gets around this by implying that the Fed has raised interest rates prematurely, meaning they may currently be above their natural rate, dragging the economy below its full employment potential. For fiscal stimulus to raise GDP, the Fed would then have to about-turn on its view that interest rates should be raised and to decide not to offset any fiscal stimulus with monetary tightening. Krugman would have to be right and the Fed wrong about the economy having plenty of spare capacity, and the infrastructure investment would have to be delivered promptly. For the reasons outlined, these conditions seem unlikely. The cyclical position and structural state of the U.S. economy suggest that a federal investment–led fiscal stimulus neither is necessary nor would be effective.
Infrastructure Spending to Improve Productivity
A separate case says significant public infrastructure investment is necessary to enhance productivity. According to this view, the United States has an “infrastructure deficit”—a need for maintenance or new infrastructure—given current demands or projections of future economic activity. Absent this investment, potential growth will be diminished.
The growth performance of the economy has been sluggish compared with past recoveries, and the Federal Reserve believes the long-term sustainable annual growth rate of the economy is now a mere 1.8 percent. The sustained downturn in productivity even as unemployment has fallen suggests a problem on the supply side of the economy, perhaps because the conditions for growth are getting harder or bad policies are producing a strong headwind against robust productivity growth.
In such an environment and with interest rates still low, so the argument goes, this is an opportune time for the government to invest in roads, rail, energy, housing, and ports that will facilitate robust productivity growth in future.
Can Good Infrastructure Enhance Economic Growth?
Few economists would argue that better infrastructure would not, all else equal, enhance a country’s economic potential.
Consider a new highway that reduces the connection time between two cities. A reduction in travel times lowers costs for businesses requiring the movement of inputs and labor through production and delivery. Lower costs boost a company’s profits and increase its use of roads between the routes, because of the effective fall in the price of transportation. Provided markets are contestable and competitive, in time profit opportunities induce companies and individuals to relocate to the area now connected through improved transport links. The ultimate beneficiaries are customers who enjoy lower prices on final goods.
Some of the new activity will simply be displacement from other regions. But overall economic activity will have increased as a result of better connectivity. Productive infrastructure reduces costs and expands markets, allowing better realization of factor specialization and agglomeration effects. The inverse applies too. Worsening connections caused by disrepair or outmoded facilities raise input prices and reduce the beneficial effects of specialization.
Of course, infrastructure investment uses scarce resources. To assess whether a particular investment has truly raised productivity, it must be judged against alternative uses of the funds. The extent to which improved infrastructure actually feeds through into productivity improvements also depends on how much the lowered costs compare with the total cost of production. That is why all individual proposals should be judged on their own merits. But what is clear is that a strong theoretical basis exists for believing that good infrastructure improves productivity.
Is Government Investment the Best Means of Delivering Infrastructure?
What is the best means of achieving infrastructure investments to enhance productivity and long-run growth? Do we need public investment and planning through government, or are free markets capable of enhancing supply as demands change?
The justifications for government provision or oversight of infrastructure projects can be split into three broad categories: (a) markets fail and require government correction; (b) the cost of government borrowing is cheap, and it is economical for governments to invest; and (c) governments can put social ambitions above narrow commercial interests. The following sections evaluate each of those justifications.
Market failure. Transport and water infrastructure are said to share some of the features of “public goods,” meaning they might be unprovided or underprovided in a free market. The Brookings Institution gives the example of a levee. Once built, a levee provides flood protection for an entire town or village. Because nobody can be effectively excluded from its benefits, voluntary payments would unlikely occur for the levee before development. Individuals would have an incentive to free-ride on the generosity of others.48 In the absence of government provision, the levee would not be built.
In other words, government involvement in infrastructure provision can theoretically help solve a collective action problem to improve social welfare. Taking road construction as an example, the government may be better placed than private actors to deal with the transaction costs associated with construction spanning the property of different landowners.49 In other cases, socially beneficial investment might take place only alongside government privileges, such as noncompete clauses or agreements inserted into contracts for toll road development to allow investors relative certainty on returns by restricting the development of competing roads nearby.
Many (particularly large) projects certainly have significant external effects too, whether environmental spillovers, noise pollution, or displacement to surrounding areas. When assigning clear property rights and compensation is not possible, it is believed that government can intervene to ensure that these social costs and social benefits are considered.
Yet historical examples of private-sector delivery suggest that the “market failure” arguments for public investment are weaker than often asserted. Virtually the entire rail network in the United Kingdom (UK) was privately built and operated for more than 100 years before its nationalization following World War II. In the United States, the pioneering Philadelphia and Lancaster Turnpike Corporation began building private turnpikes in the late 18th century, and for the first third of the 19th century, private companies built thousands of miles of road.
The private sector can and does build roads and railways now. Road owners can and do charge tolls for use when they can, whereas railway owners can buy up the land around their tracks and thus capitalize on the appreciation in land values following the development of a rail line. In many other countries, airports and associated infrastructure are privately owned and delivered, with the government’s role often limited to applying a framework to deal with land-use planning, spillover issues, or complementary infrastructure in the surrounding area. Investors in London’s Heathrow Airport, for example, recently agreed to a plan to deliver £650 million ($810 billion) in additional investment in 2019.50 The biggest barriers to private investment in major projects are often regulatory or related to uncertainty (discussed later).
Correcting for “market failures” also tends to be a lot more difficult in practice than in theory. Most activities have external effects that are highly uncertain. The mere presence of externalities is not a sufficient condition to justify government action. It may be that private returns are still high enough that a project would be undertaken anyway, even though it has additional social benefits. With scarce resources, it is also necessary to review not just whether a project has some social benefits, but also whether the social rate of return is high compared with other uses of funds.51 There is even some evidence that some things traditionally thought to be public goods, such as lighthouses, actually get produced in a market economy.52
We should be skeptical then of those who use “market failures” as a justification for widespread government provision of infrastructure. That is not to say that some worthy projects would not be produced in a market economy. Government should undertake certain infrastructure projects if they are strongly socially desirable but not privately profitable. But that is likely to occur much less frequently than commonly believed. What is more, most projects with significant spillover effects tend to require highly localized knowledge, meaning state or local government would be better placed than the federal government to undertake any investment.
Cheap government borrowing. A less convincing argument says government should undertake large-scale investment because government borrowing is cheap. With real interest rates very low in 2015, Nobel laureate Robert Shiller argued, “The government should be borrowing, it would seem, heavily and investing in anything that yields a positive return.”53
The Brookings Institution recently employed similar logic, suggesting low rates should also be inducing private-sector investment.54 Many are puzzled by the private sector’s not taking advantage of this “near-free” money to invest in anything with a positive return. Surely, in this environment, they say, it makes sense for government to “step up.”
The mistake here is to conflate a less costly time to invest with a “good time” to invest. Take the example of a toll road. If the long-term outlook indicates the growth or the population of an area will slow, then expected use of the toll road would fall, as would demand for investment. That result would lower equilibrium interest rates. Even if the interest rates are lower, it would not be a good time to invest because demand for the toll road would be falling, lowering revenue expectations.
Similar logic applies to government investment in transport infrastructure without user fees. If demand for transportation use is falling for structural reasons, then any investment will have far fewer economic benefits, even if costs have fallen. The overall attractiveness of the project might be unchanged or may have deteriorated. Examining what has happened to interest rates alone tells us little about whether undertaking a project is worthwhile.
The fact that private-sector companies are not investing massively at low rates in infrastructure projects suggests that it may simply not be a good time to invest generally. The explanation might be because expected returns are poor. But it also might be because uncertainty is high.
Infrastructure investment comes with significant political risk. In France, the government declared it would limit increases in tolls on roads, despite contractual agreements with operating companies allowing increases via inflation-linked formulas.55 In Spain, a British investment fund took legal action against the government after it attempted to lower airport tariffs, despite a guarantee that they would be fixed for 10 years after privatization. The Norwegian government likewise stands accused of changing the regulatory framework surrounding oil pipelines after investments were made.56 Political risks of this kind are amplified when projects have exceptionally long lead times, with environmental and other policy decisions potentially being altered midproject.
Political risk comes on top of risks associated with construction costs and usage, some of which might be correlated with general economic health. There will be uncertainties unrelated to GDP too. The success or otherwise of high-speed rail and much mass transit, for example, is strongly linked to the potential for technological change, not least driverless cars. Private investors may fear the whole venture will become obsolete.
That the private sector fails to invest in such projects does not show “market failures” in many instances. It merely shows that private investors consider the project too risky or uneconomic. This is something politicians should bear in mind when committing taxpayer funds.
Low interest rates do reduce the fiscal cost of borrowing, but one must also consider the revenue/growth component and its effect on returns. All infrastructure investments should still go through rigorous cost–benefit analyses and be judged against alternative uses of the funds, including the option of leaving the money in the hands of taxpayers.
Social, rather than commercial, AIMS. Private companies will invest in projects in which they can make a profit. Governments can invest to achieve other social objectives. That argument is often heard for government-led investment. Of course, in many cases, that is at odds with the claim that government will invest prudently to raise productivity, although in some cases—such as those in which environmental projects help correct externalities—the two need not be incompatible. Nevertheless, resources for infrastructure allocated through the political process clearly seek other objectives, often with economic costs.
Short-term job creation is often one declared objective. Trump’s team has promised to prioritize schemes that directly create jobs. Yet, as noted previously, jobs are a cost to projects. If “job creation” is a target of government investment, then projects may be chosen and delivered in a less efficient manner than they could be, raising the burden on taxpayers through making infrastructure delivery more expensive.
Regional favoritism and pork-barrel spending often occur too. Infamously, in July 2005, Congress passed a bill that included earmarked funds for the Gravina Bridge in Alaska, the so-called Bridge to Nowhere. It was not funded with a view toward maximizing returns or allocating funds according to market demands. It is well known that Amtrak has historically allocated resources for investment to rural areas with low population densities at the behest of politicians.57 The Highway Trust Fund also allocates funds seemingly divorced from needs. A 2013 paper found that states with greater highway use or a larger highway system did relatively badly with regard to federal aid.58 The CBO echoes this criticism, noting that “spending on highways does not correspond very well with how the roads are used and valued.”59
For political gain, politicians also grant funds to prestige or so-called ribbon-cutting projects, rather than to projects with the highest economic returns, such as maintenance, repair, and bottlenecks. Consider that federal funds have been granted to the California High-Speed Rail scheme, which originally had a purported benefit–cost ratio of about 2.60 The estimated costs for this project have since expanded rapidly and are still rising, taking the estimated benefit–cost ratio closer to 1 already.61 Meanwhile, other schemes with much higher benefit–cost ratios have not received funds. The outgoing Obama administration highlighted the $8 billion Hampton Roads highway project, for example, that had a benefit–cost ratio of about 4.62
Choosing to prioritize investments that do not have the highest returns is a phenomenon not unique to the United States. In the United Kingdom, the coalition government’s 2010 Comprehensive Spending Review (which aimed to reduce government expenditure in light of a huge budget deficit) led to deferral, cancellation, or review of a host of road schemes with average benefit–cost ratios of 6.8, 3.2, and 4.2, respectively. Yet the government pushed on with plans for a high-speed rail project between London and Birmingham despite the high-speed line’s purported benefit–cost ratio of just 1.2.63 New historical evidence suggests a potential rationale: grand infrastructure projects can help boost electoral performance.64
Quirks in funding allocation also mean that on occasion politicians threaten the withdrawal of resources for infrastructure to achieve political objectives. Recent news reports suggest President Trump may cut transportation funding as a means of punishing so-called sanctuary cities.65 Allocating funds according to a city’s application of immigration laws—disregarding the congestion or other needs of the locality—is clearly not economically optimal.
That government investments are not bound by market discipline and often become politicized with other objectives is the reason projects are often not delivered efficiently.
The book Megaprojects and Risk: An Anatomy of Ambition—written by Oxford University economic geographer Bent Flyvbjerg and others—goes into detail about some of the accountability problems associated with political management.66 The conflicted role of both promoting a project and being responsible for examining its failures and risks leads politicians to make overoptimistic claims about a scheme’s benefits relative to costs. Politicians’ desire to leave an infrastructure legacy (with costs realized long after they have left office) means most large projects are mis-sold to electors. That factor manifests itself in a lack of realism about initial costs, underestimating the time a project will take, setting contingencies too low, not taking into account changes in specification, overestimating usage, and not accounting for some of the nonmonetary spillover effects of the project itself (congestion brought about by construction activity, for example).
Flyvbjerg and others highlight how a 1998 study by the U.S. Department of Transportation found that 10 U.S. rail transit projects with a total value of $15.5 billion saw a total capital cost overrun of 61 percent.67 Their finding corroborates a large study of 258 projects across 20 countries undertaken at Denmark’s Aalborg University that found 9 out of 10 such projects end with cost overruns, with rail projects costing 45 percent more than expected on average; tunnels and bridges, 34 percent; and roads, 20 percent.68 Urban rail projects seem to be particularly prone to higher-than-expected costs and lower-than-expected revenues. This systematic bias in one direction suggests we cannot attribute such overruns to mere error.
Recognizing some of these failings in delivering infrastructure efficiently, governments have sought in recent decades to harness private-sector capital to infrastructure provision, mainly through public-private partnerships (PPPs).
PPPs entail agreements between government and a private contractor for the building, financing, or operation of government infrastructure projects with the aim of passing on substantial risk to the private sector. According to the U.S. Department of Transportation website, PPPs can take five distinct forms for new infrastructure, ranging from simply transferring management responsibilities to a private-sector firm to integrated contracts incorporating the design, build, maintenance, and operation of the infrastructure (for example, toll roads). The idea is PPPs can provide the infrastructure government desires, harnessing commercial discipline in the delivery and maintenance of projects as agreed in a contract with government.
In sum, government may have a role in the provision of genuine public goods and in projects in which the social rate of return is very high and the project would not be delivered by the private sector. A government role in projects is, in many cases, inevitable and in some cases desirable. In principle, well-targeted state-financed infrastructure undertaken according to disciplined cost–benefit analysis buttressed with systematic risk evaluation can enhance economic welfare.
But these assumptions speak for themselves. Historical examples suggest that the market failure arguments for infrastructure development may be overblown. Governments can often borrow cheaply, but that tells us little about overall project desirability. Certainly, governments often pursue objectives other than economic growth, and the political process does not lend itself well to effective targeting and monitoring for investment. PPPs can help on particular projects, but even here many of the problems associated with government remain (as we will explore). A role exists for certain government investments, but the U.S. federal government already seems to be beyond that limited role.
Does Government Infrastructure Spending Boost Growth?
Unsurprisingly, given all these caveats and conditions, the evidence on the relationship between government infrastructure investment and growth is extremely mixed. It stems from three types of analysis: (a) cross-country regressions, (b) individual country case studies, and (c) time series work on the United States.
Using large panel data sets across countries, the most up-to-date evidence for advanced economies suggests small but significant positive effects of government investment on productivity growth, with a 10 percent increase in infrastructure assets raising GDP by 0.7 percent.69 These approaches, which regress growth on public investment, are believed by many to be the best means of measuring the true effect of investment, because they capture all potential spillovers to the broader economy.
Even here, estimates have considerable differences, depending on the countries, time periods, or types of investments examined. As an example, a 2014 study by Andrew Warner for the IMF focusing on 126 low- to middle-income economies (where one might have thought infrastructure investment more essential) found, for example, “no robust evidence that the investment booms exerted a long-term positive impact on the level of GDP.”70 Although a case for eliminating transport bottlenecks exists, the study found in its examination of case studies “no evidence that rational selection of public investments according to sound economic criteria was ever seriously followed.”71
There is also a range of methodological difficulties associated with cross-sectional regressions, not least because of the potential two-way relationship between growth and investment and important omitted variables (such as the tax increases needed to finance the investment in some cases).
Individual country-specific case studies show more clearly that substantial infrastructure investment is neither a necessary nor sufficient condition for robust growth. Japan’s huge outlays (according to an article in the New York Times, the country spent $6.3 trillion on “construction-related public investment” between 1991 and 2008)72 produced, among other things, the world’s best-rated rail system.73 Yet productivity increased three and a half times more between 1970 and 1990 than between 1991 and 2011.74
Spain, likewise, was left with empty airports following its infrastructure drive. A recent assessment of a host of major projects in China also showed that a great deal of infrastructure investment was plagued by cost overruns and overestimated benefits, with 55 percent of the projects having a benefit-to-cost ratio below 1. That is, they led to a net loss in economic value.75
Given that the United States has different institutions and policy frameworks than other countries, one has to be careful in generalizing conclusions from elsewhere. Instead, policymakers point to America’s own historical record.
Three decades ago, the scholarly consensus was that U.S. spending on infrastructure yields great public benefits. The work of Bates College economist David Aschauer in the late 1980s purported to show huge returns on public capital using time series data and hence attributed a large portion of the productivity growth slowdown following the postwar boom to a decline in public investment spending.76 Similarly positive results were found by Federal Reserve Bank of Boston (and later Boston College) economist Alicia Munnell.77 This quarter-century-old work still dominates publications seeking increases in infrastructure spending today.
But these studies are believed to have a range of important methodological problems. Edward Gramlich showed convincingly that Aschauer’s estimates were too high to be plausible.78 More recent analysis suggests much more modest effects of public investment on postwar growth rates.79
Historic work, as with evidence from other countries, can get us only so far with regard to lessons for future policy. That public capital investment historically increased growth tells us nothing of the desirability or growth effects of new projects, which should be judged on their own merits. That should be obvious on a conceptual level. The fact that some bridges in the past have enhanced growth tells us nothing of the desirability of a new bridge today.
Take the interstate highway system as a specific example. John Fernald’s work found that its construction substantially boosted productivity in industries closely associated with road use, bringing with it a one-time boost to U.S. economic growth.80 Yet more recent assessments have found that too many new highways were built between 1983 and 2003 and that marginal extensions to the highway system tend not to increase social welfare. The reason is the cost savings of reducing travel times are small relative to incomes and prices.81 That is one reason that meta-analysis suggests that the productivity gains from public capital investment have fallen over time.82
That is not to say that in areas with genuine bottlenecks, where heavy congestion has deleterious effects on labor markets, new investments do not make sense. The key lesson is that we cannot make generalized claims about the benefits of “infrastructure investment” without judging the worthiness of individual projects. Evidence from cross-country regressions and historical data may be interesting in their own right, but they do little to inform us about whether new projects will be beneficial.
Does a Need for Significant Government Infrastructure Investment Exist Now?
White House Press Secretary Sean Spicer recently explained how the Oroville Dam emergency was a “textbook example” of the consequences of the nation’s aging infrastructure. “Dams, bridges, roads, and all ports around the country have fallen into disrepair,” he said. “In order to prevent the next disaster we will pursue the president’s vision for an overhaul of our nation’s crumbling infrastructure.”83
The true state of American infrastructure is better than Spicer suggested. But even if the claims of widespread disrepair were true, would full repair and upgrades of existing infrastructure be a good proxy for how much government infrastructure investment is needed?
Absent real markets, how much infrastructure is wanted or needed is difficult to quantify. What level of congestion would drivers on a particular road be able to tolerate before they were willing to finance road expansion? Clearly, eliminating all congestion with 15-lane freeways would be prohibitively expensive. So how far should a road expansion go? How often should it be repaired? How much transportation should be by train? How much money should be spent on research and development for completely new ways of meeting transportation demand?
Markets are good at finding the optimal mix of infrastructure spending over time and rewarding those that are better at satisfying demand. Governments, even with the best of intentions, lack the necessary knowledge to find that mix. Without effective pricing in most cases for infrastructure, the government is simply unable to judge when new investments make economic sense.
In markets, investments are made when they are believed to be profitable. For government projects, cost–benefit analysis of new projects can be undertaken to decide where scarce resources are most needed for highest returns. But even with this framework, it is impossible to perceive whether enlightened transport technocrats will be able to perfectly estimate the balance of benefits and costs of any new development. We have already seen the overoptimism bias for big projects and the prospect that politicians may prioritize projects with lower returns for political reasons. Even assuming benefits and costs can be estimated accurately, that does not tell us anything about “how much” should be invested in infrastructure projects overall.
In the absence of guidance on this issue, different proxies for how much “should” be invested are quoted in public debate. Most commonly cited are surveys by the American Society of Civil Engineers, which believes the United States needs to invest $4.6 trillion in infrastructure between now and 2025. Its work assesses the condition of infrastructure, estimating how much it would cost to improve the infrastructure to a set standard as measured by eight different criteria: (a) capacity, (b) condition, (c) funding, (d) future need, (e) operation and maintenance, (f) public safety, (g) resilience, and (h) innovation.84
Yet although all those variables have merit, combining them in this way to get an aggregate figure of cost tells us little about what we “should” invest if one considered pure market demands. A cynic might point out that engineers have an incentive to exaggerate the amount of investment that is desirable. Indeed, investigations by CNN found the group’s estimates for infrastructure spending needs were much higher than the sum of those outlined by federal agencies.85
The quality of U.S. infrastructure actually appears relatively high when compared with other developed nations. The World Economic Forum’s Global Competitiveness Report ranks the United States 11th in the world for infrastructure overall, placing it ahead of many advanced economies, such as Australia, Belgium, Canada, and all of Scandinavia. Subindexes rank the United States 12th for roads, 13th for railroads, 10th for ports, and 9th for air transportation. The United States’ overall infrastructure position would be higher still were it not for relatively low numbers of mobile-cellular telephone subscriptions and landlines per capita, where America ranks 66th and 25th, respectively.86
Most of the variables used to construct these indexes are survey based, bringing the disadvantage of varying expectations across countries. The Kiel Institute’s more objective measures of capacity relative to the size of the country put the United States as high as fourth in the world overall and third for transportation infrastructure, behind only the city-states of Hong Kong and Singapore, which clearly have very different characteristics.87
Further, the U.S. government is not currently spending less on investment than other countries. Gross government fixed capital formation in the United States is projected to be 2.9 percent in 2017, above the average of 2.6 percent for members of the Organisation for Economic Co-operation and Development. That number is lower than the U.S. average of 4.1 percent since 1960, certainly, but according to the CBO, spending on transportation, drinking water, and wastewater infrastructure amounted to 2.4 percent of GDP in 2014—a figure that has remained fairly stable for the past 30 years.88
Of course, these capacity and spending measures tell us little about the quality of infrastructure, or about the needs of a major economy that is on the international technological frontier. Politicians usually focus on these metrics in making the case for new investments.
Politicians continuously talk of creaking and crumbling roads, highways, and bridges in particular. Democratic presidential candidate Hillary Clinton went as far as to say, “We have bridges that are right now too dangerous to drive on, although people take a deep breath and drive across them.”89 The picture painted is one of U.S. infrastructure falling into dire disrepair.
The actual evidence is mixed. It is regularly reported that 58,791 U.S. bridges are “structurally deficient,” and 84,124 are “functionally obsolete,” for example.90 That is as high as 9.6 percent and 13.7 percent of the total 611,845 U.S. bridges, respectively. With such scary-sounding terms and several instances of bridges actually collapsing, no wonder politicians and the public are spooked.
Rarely highlighted, though, are the definitions of these terms and the trends. “Functionally obsolete” does not mean unsafe but refers to the geometrics of the bridge relative to the
Figure 4
Proportion of Bridges Qualifying as Structurally Deficient or Functionally Obsolete
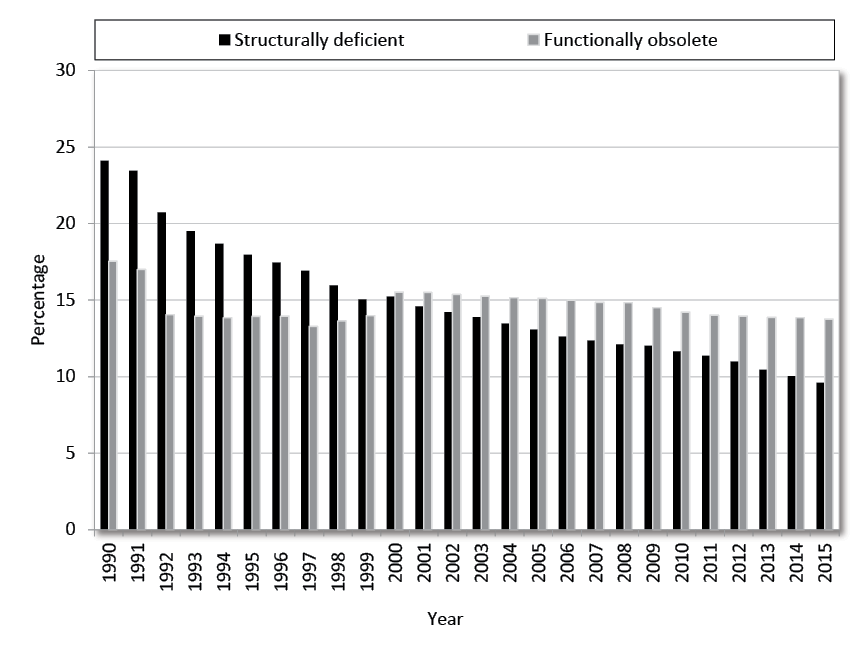
Source: U.S. Department of Transportation, Federal Highway Administration, Office of Bridge Technology, National Bridge Inventory, Count of Bridges by Highway System.
geometrics of modern design standards. As such, older bridges are more likely to be declared “functionally obsolete” simply by virtue of when they were built. Likewise, “the classification of a bridge as structurally deficient does not mean that it is likely to collapse or that it is unsafe,” explains the Federal Highway Administration. “Bridges are considered structurally deficient if significant load-carrying elements are in poor condition due to deterioration or damage.”91
The really important fact is, bridge quality has actually improved substantially since 1990. The proportion of bridges qualifying as structurally deficient and functionally obsolete was as high as 24.1 percent and 17.5 percent, respectively, back then, and the proportion of bridges believed to be structurally deficient has seen nearly annual improvement ever since. That holds for both urban and rural bridges. (See Figure 4.)
Concern about physical conditions may stem from individual catastrophic events, such as the I-35W Mississippi River bridge collapse in Minneapolis in 2007. But those are rarities and tell us little about the consequences of the bridge statistics outlined above. In 2007, when the I-35W bridge collapsed, it was labeled as structurally deficient, for example, but so were 74,055 bridges that did not collapse. In fact, the bridge had been so labeled for the previous 17 years. Inspections have since shown that the bridge’s design was flawed from the start.
Many other measures of quality tell a similar story of improvement. Since 1986, airport runway pavement conditions have improved significantly, with the proportion of pavements registered as good rising from 63.5 percent to 80.5 percent in 2016.92 The Federal Highway Administration estimates that the miles traveled on the National Highway System of “good” ride quality increased from 48 percent in 2000 to 60 percent in 2010, and miles traveled under “acceptable” ride quality increased from 91 percent to 93 percent.93 These improvements continued between 2010 and 2012.94
Figure 5
Annual Person-Hours of Highway Traffic Delay Per Auto Commuter
Source: Texas Transportation Institute, Congestion Data for Your City.
That is not to downplay problems. So-called collector roads—those capacity roads that tend to provide access to residential property—have seen a decline in the proportion regarded as “good quality” in both urban and rural areas. Roadway congestion has also become more acute over the long term. A substantial increase has occurred in the annual person-hours of highway traffic delay per auto commuter across all types of areas, although it has not really increased in recent years (see Figure 5). Similar stories are observed in delays to journeys in peak time against free-flowing traffic and in road congestion indexes.
Rail and transit systems appear to be the main areas with observable deterioration. The proportion of rail transit stations believed to be in excellent or good condition fell from 61 percent in 1995 to 24.9 percent by 2006, with a significant increase in the proportion regarded as substandard.95 The average age of all types of urban transit rail vehicles has also increased since 1990,96 whereas the proportion of urban bus facilities rated substandard or poor rose from 23.7 percent to 36.3 percent between 1997 and 2006.97
Yet although older vehicles and facilities may contribute to the feeling of creaking infrastructure, replacing them may not lead to greatly improved service. It may even be that in some cases neglect is deliberate and reflective of falling demand for the service.
Rather than highlight the scale of investment required, the evidence shown actually says more about who pays for infrastructure and the incentives it creates. As the Cato Institute’s Randal O’Toole has noted, “The difference between state highways, which are in good condition, local roads, which are in fair condition, and transit systems, which are in poor condition, is simple: State road maintenance is paid for almost entirely out of user fees; local road maintenance is paid for by a combination of taxes and user fees; while transit maintenance is paid for entirely out of taxes.”98
The incentive to keep transport networks well maintained is stronger when the operator has a stake in the future revenues associated with the asset. That suggests that policymakers’ focus on creating public revenue streams for infrastructure misses the point. A more fruitful policy agenda would be to shift toward revenue streams from tolling and user fees and to move away from government taxes and spending.
Indeed, it is difficult not to conclude from the overall available evidence that tales of a transportation “infrastructure crisis” are exaggerated, and the case for significant investment on “disrepair” grounds is not clear-cut. Most of the aggregate indicators cited in public debate purportedly showing how much “should” be invested are arbitrary and do not have an economic rationale. To get infrastructure provision that is responsive to people’s wants and needs, we need more in the way of market signals.
Implications for Policy
Changing patterns of demand and acute points of congestion require investment in maintenance and expansion. The real aim should be to have an institutional framework in which investment is responsive to economic wants and needs. When social returns are high and the private sector will not invest, then government can improve prospects. But more scope for private-sector delivery of infrastructure in the United States clearly exists.
Nevertheless, most debate on infrastructure policy starts with the premise that more infrastructure investment is necessary and then asks where the funds will come from to finance it. Having argued against significant new federal spending, this study uses the following sections to draw on the lessons noted to discuss the mooted proposals to use infrastructure tax credits and PPPs to raise funds. It concludes by highlighting a range of policies the Trump administration should consider to improve the framework for infrastructure decisionmaking and delivery without increasing the burden on taxpayers.
Are Tax Credit Plans and Public-Private Partnerships the Answer to Infrastructure Funding?
President Trump and his transportation secretary, Elaine Chao, have said the promised $1 trillion investment will include both public and private funds.99 With House and Senate Republicans believed to be reluctant to commit to substantial new federal deficit financing, however, Peter Navarro and Wilbur Ross—as part of President Trump’s campaign team—previously drew up an alternative financing plan that uses tax credits to incentivize $1 trillion of purely private investment. As far as can be ascertained, tax credits of this nature are still being considered today.
The Ross-Navarro plan would entail extremely generous 82 percent tax credits for equity investment into designated projects. The pair envisage that drawing in a total of $167 billion of private-sector equity investment (at a “cost” of $137 billion to the tax base) would then allow private investors to borrow on bond markets to finance the remainder of the $1 trillion ambition for infrastructure spending. In effect, close to 14 percent of the investment would come as a no-cost payment to the equity investors from taxpayers. Investors would then obtain streams of income through shares of user fees or from tax revenue via a PPP.
Navarro and Ross believe the tax credits will harness investment because the equity cushion helps ameliorate the large uncertainty associated with infrastructure projects’ costs and usage rates. They also believe the tax credits will be fiscally neutral, with the loss of the income tax base made up for by higher income and corporate income tax revenues associated with the labor and corporations hired to undertake the projects. Coupled with more discipline on construction costs associated with private-sector involvement, the pair believe their tax credit scheme will provide a better deal for U.S. taxpayers than traditional procurement and provision.
As shown, transport infrastructure can no doubt be delivered privately. Major airports are privately owned in a host of advanced economies, as railways and roads have been.100 Although the cost of capital can sometimes be high, particularly given political risks, PPPs can deliver road infrastructure on time and within budget. In Virginia, for example, the Dulles Greenway opened in 1995 having been entirely financed privately. Within that state alone, toll lanes on the Capital Beltway, the Midtown Tunnel, and the Jordan Bridge have all been financed overwhelmingly by private investment.101
There are two questions to consider then. First, will PPPs deliver the types of infrastructure the United States needs now? Second, is the infrastructure tax credit in particular a necessary and desirable policy to achieve the investment?
Provision of infrastructure through PPPs works best when obvious cash streams are associated with the asset. Theory would suggest that allowing private companies to both build and operate an asset with a user revenue stream, even for a fixed period, will incentivize them to consider the long-term maintenance needs of the asset at the point of construction and bear the usage risk.
Cato Institute scholar Randal O’Toole has described these types of arrangements as “demand risk PPPs.” They tend to work well. Clearly though, this form of PPP cannot be applied universally. The more difficult cases include maintenance or upgrading of existing infrastructure, rural roads and bridges, and loss-making modes that are believed to have some broader social benefits. No obvious user fees are associated with them. Indeed, Senate Environment and Public Works Committee Chairman John Barrasso (R-WY) recently expressed concern that PPPs were being touted as a solution to the infrastructure question when they could not deliver these types of projects.
Yet a different type of PPP can be used in areas where user fees are not possible. PPP contracts can be designed such that private investors design, build, operate, own, maintain, and finance an asset and gain revenue from a stream of taxpayer payments for leasing and maintenance services for a fixed period. These are called “availability payment PPPs,” because regular payments from government are conditioned on the asset being available to use at a specified quality, as outlined in a detailed contract.
This type of PPP already exists in the United States for rural transportation. In Pennsylvania, the Rapid Bridge Replacement Project is replacing hundreds of geographically dispersed, structurally deficient bridges with a bundled contract, including maintenance for the next 25 years. Tax revenues provide availability payments.102 Rolling up a significant number of assets in this way can help diversify risks for the private contractor.
The theoretical benefits of this approach are substantial. A large part of the construction and other risks are transferred to the private sector, albeit reflected in higher borrowing costs (a risk premium). Given that the private contractors are paid only when the asset is delivered, timely construction at a fixed price is encouraged. The long contracts should incentivize development with low whole lifetime costs, with the providers assessing maintenance needs in advance. Contracts can also be standardized, with penalties for failure to achieve targets and maintain quality. If many different smaller projects can be bundled in this way, the transaction costs of contract development can be reduced.
The question is whether these benefits overcome the higher borrowing costs the private sector often faces, and whether contracts can be effectively designed. As the CBO has noted, even with these PPPs, taxpayers are still the ultimate source of funds. They just do not face the upfront capital costs.103
Sadly, this “availability payment” model—in which the private contractor gets paid irrespective of usage—has a more mixed record than “demand risk PPPs.” In fact, the United Kingdom made extensive use of this type of agreement in building hospitals and schools through the 2000s under the New Labour government, and the results have been disappointing.
Success in road schemes and a number of privately owned prisons in the early 1990s (with a much higher proportion delivered on time and within budget than through traditional procurement) led to a huge expansion of PPPs in the 2000s. By 2004, they accounted for 39 percent of capital spending by UK government departments, and over 500 were in operation by 2008, including for building schools, hospitals, and public transportation (especially rail). That expanded use of PPPs occurred in part because this type of financing could be done “off balance sheet” for the government (as contingent liabilities), flattering the public finances. At a time when the government was looking for significant capital investment quickly, it appeared to make sense to allow private operators to build new infrastructure with taxpayers in essence paying over time.
Yet this huge expansion of PPPs is now widely regarded as a failed experiment. Any theoretical benefits arising from more innovation, the privatization of risk, and on-time and within-budget delivery of projects (for which some evidence existed104) was eclipsed by the higher borrowing costs in the private sector, the costs of a host of consultants and lawyers in drawing up the contracts, and unnecessarily expensive bundled services.105 The opacity of the liabilities for taxpayers has also proved very unpopular, with various attempts to renegotiate inflexible contracts.
What went wrong? Conservative member of Parliament Jesse Norman believes the government was simply a poor client:
These were generally huge one-off projects agglomerating very different skills, services and expertise, from construction to [information technology] to facilities management. They were laden with social, bureaucratic and political prestige, creating external interference and a demand for expensive “signature” buildings with unknown future costs. Often the clients were dominated by producer interests, overspecified the projects, changed the specification en route, lacked the necessary commercial or negotiation skills to manage the procurement, were naïve about using external professional advice, and did not adequately understand the risks involved, the likely future costs or the relevant financing models.106
He also identifies failures within the public sector to account for risk effectively. This point was echoed by the Institute of Economic Affairs, which highlighted how provision of perceived “essential” infrastructure through this mechanism led to a continued assumption that the ultimate risks lay with the public sector.107
Several major projects in the UK saw the government step in when private contractors were unable to fulfill contracts, not helped by the inflexibility of the agreements. The process of contract design often led to hostile bargaining. Add to this the fact that specific projects were dogged by political interference, even at the development stage, and it is easy to see why the UK record was so mixed. Many of the problems associated with government provision of infrastructure remained with government contracting for it.
Of course, in policy we should not allow the perfect to be the enemy of the good. The failures of other traditional procurement methods are well known. In other countries, such as Canada and Australia, the record of PPPs seems more positive.108 At best though, the UK experience shows that these types of PPPs are no panacea for infrastructure development. The poor results arose in part because the New Labour government wanted to see significant investment quickly, but without adding to the official national debt. U.S. policymakers should therefore be particularly wary of rushed investment contracts as part of an arbitrary aim of $1 trillion of infrastructure investment for the next decade.
Although the benefits of PPP arrangements can in theory run up against difficulties in practice, the case for infrastructure tax credits does not add up, even in theory. The tax credit in itself does not change the overall profitability of different investments, meaning loss-making areas of the transportation system and projects geared toward maintenance of existing roads, bridges, and highways are highly unlikely to get buy-in from investors.
Those projects appealing to investors would likely have been undertaken anyway. That is one reason why the tax credits almost certainly will not be “fiscally neutral.” Private companies already intending to invest in infrastructure development before the credit will now seek out the tax benefit, too. The Ross-Navarro plan implicitly assumes that any new infrastructure development uses engineers or construction workers who were previously unemployed. In fact, if the new projects compete for existing workers employed elsewhere at the same wage rate, then the tax credit will have a pure fiscal cost.
From a public finance perspective, it might just be cheaper for governments to borrow directly. As O’Toole has noted, the tax system is currently highly biased toward public provision of infrastructure, because government agencies can sell tax-free bonds at low borrowing costs.109 It is unclear how, given this tax advantage, allowing private taxable bonds coupled with a very generous tax credit can be economical.
Then there are questions about whether the tax credits will even work to stimulate significant investment. Many of the big institutional investors, such as pension funds, are tax-exempt anyway and so will not be incentivized by them. In fact, for tax efficiency reasons, the types of tax credits envisaged are most likely to incentivize companies repatriating overseas earnings. That is one of the reasons many Republicans are keen to link any infrastructure provision to a tax reform bill. Yet it is unclear economically why it would be sensible to link the amount spent on infrastructure to the financial decisions of large companies.
The scope for more private involvement in the provision of infrastructure is strong, but PPPs and tax credits are no substitute for genuine privatization. Although PPPs make sense for a range of projects, designing contracts well seems of paramount importance. The U.S. taxpayer should be wary of these schemes being used for huge upfront investments, but with often long-term expensive commitments for taxpayers.
What Policy Framework Would Improve U.S. Infrastructure Development?
The analysis of the underlying economics of infrastructure investment presented here has been highly skeptical of the desirability of significant government infrastructure investment. But the economics presented do provide lessons for creating responsive institutions. After all, at a time when new technological innovations such as driverless cars could revolutionize the way we travel, and with politicians talking of seeking to harness $1 trillion of new funds, we need to avoid the very real risk of wasted funds. Although the case is often exaggerated, the U.S. economy clearly has substantial infrastructure needs, as the figures on congestion alone illustrate.
The aim should be to allow innovation, cost-effective provision, and investment where it is most economically beneficial. A first step here is to set an infrastructure framework that seeks to expand productivity growth and that ignores short-term macroeconomic considerations. It has been argued that fiscal stimulus is not needed anyway, but that objective in itself—a short-run “demand boost”—is much more likely to lead to bad decisionmaking on projects, hampering the long-term growth potential of the economy.
Instead, a pro-growth agenda for infrastructure should get the incentives and institutions right, which means any dollar of spending (by the public or private sector) will go much further. Thankfully, the new administration has more recently acknowledged this. The 2018 infrastructure initiative emphasized, for example, that federal funding alone was not the solution to infrastructure, instead talking up the need for long-term reform of how infrastructure is “regulated, funded, delivered, and maintained.”110 The pro-growth aim can be achieved through the application of the following broad principles.
Privatize areas where government is not needed. Many types of infrastructure assets need not be under government control, whether at the federal, state, or local level. Other countries have perfectly decent privatized airports (London’s Heathrow), air traffic control systems (Canada) and railways (Japan), for example. The principle here should be of “subsidiarity”—the least centralized authorities providing infrastructure where they can, with subsequently higher levels of government intervening only when a clear and overwhelming need exists. Chris Edwards has previously outlined how, in the field of major infrastructure, the federal government should give up its provision of air traffic control, following the Canadian example. The responsibilities of the Tennessee Valley Authority, Amtrak, the Army Corps of Engineers, and the Bureau of Reclamation could likewise all be turned over to the private sector.111 In the UK, large-scale privatization often produced significant improvements in labor productivity and lower prices for users, without compromising safety.112
Localize decisionmaking as far as possible. In a similar vein, the federal government’s current role clearly goes way beyond that necessary to deal with genuine cross-state border coordination problems and so-called market failures. The administration acknowledges this, explaining how the federal government today “acts as a complicated, costly middleman between the collection of revenue and the expenditure of those funds by States and localities.”113 Federal aid, not least for highways, can distort local decisionmaking in a way that is not conducive to economic growth, while creating significant grievances. The Highway Trust Fund currently distributes money in a way that benefits large, relatively underpopulated areas, rather than investing in areas of rapid growth. Harvard economist Edward Glaeser has outlined how “Alaska received $484 million in the 2015 highway-aid apportionment … about $657 for each Alaskan.… New York State received $1.62 billion, or $82 per person.”114 Clearly, this is not reflective of the highway needs of the two states.
It would be far better to completely decentralize responsibility for transportation infrastructure back to the states, limiting any federal role to coordinating cross-state investments and financing and providing infrastructure with large social benefits where neither the private sector nor states were able to. We would not have the problem of the federal government crowding out state activity as discussed earlier in relation to Obama’s 2009 stimulus package.115 States would instead be able to experiment according to their own needs, and the funds for generating new infrastructure would be better matched toward growing regions of the country. This approach could include states adjusting their own gas taxes, working with the private sector to develop suitable PPP arrangements, or allowing the private sector to develop infrastructure independently.
Remove payment barriers for charging users. For both federal- and state-provided infrastructure, the aim should be to move toward user funding rather than tax revenues. That approach would have many benefits, not least allowing those who use infrastructure to be charged for their actions and providing an incentive to reduce congestion. The existence of streams of income would also make private investment into transportation infrastructure projects more attractive.
The CBO estimates that, historically, less than half of federal funding for highways was tied to the amount of travel on the roads. This lack of connection between use and investment can have significant negative effects on funding efficiency, biasing against regions with significant congestion and maintenance needs.
User charging—whether through per mile charging, congestion charging, or straight tolling of roads or highways—would adjust to allow traffic to move more quickly and reliably. At the moment though, barriers impede the application of user charging in the transportation sector. In particular, there are federal restrictions on the use of user fees to convert interstate highways into toll roads. In airports, the Passenger Facility Charge, a local user fee, is capped by the federal government at $4.50 per passenger.
Removing these restrictions would help attract private capital investments in highways and airports, making the provision of both less dependent on government and allowing a more efficient matching of investment to demand.
The effects of widespread user charging of this kind could be profound. According to the Federal Highway Administration, a wide rollout of congestion pricing could reduce the amount of capital investment required to meet the same goals for the highway system by about 30 percent. Heavily used roads such as Interstates would have the most to gain from user pricing, but at the moment just 7 percent of the current Interstate Highway System is composed of highways with tolls.116
Employ rigorous cost–benefit and risk analyses for government projects. Where government investment is needed and justified, both the federal and state governments should seek to use rigorous cost–benefit and risk evaluation to assign funding to the most economically valuable projects. As far as possible, other ambitions—such as creating jobs, helping manufacturing, and more—should be jettisoned in favor of maximizing overall economic gains relative to costs.
To get an idea of the scale of savings that could result from greater focus on “bang for the buck,” the Federal Highway Administration has estimated that funding highway projects purely on the basis of cost–benefit ratios could see the same overall level of benefits for about 25 percent less cost than currently delivered. Analysts believe this approach would lead to much more spending on urban Interstates, and repairs of urban highways and rural bridges.
Of course, where the political process is involved in projects, the cost–benefit analysis itself can be corrupted by overoptimism on both costs and usage rates, as we have seen. No doubt some states would attach much more weight to somewhat fuzzy social benefits than others. But with more localized funding, they would bear the full cost of their actions. To ensure high-quality, accurate output, the methodology and assumptions behind cost–benefit methodology should also be produced and published transparently, with states ideally using a clear framework that also presents the opportunity cost of undertaking any new project.
Level the playing field for private-sector funding. Cato Institute scholars have long argued that the tax system tilts the deck in favor of states borrowing to finance infrastructure over private borrowing. Under the present federal income tax, the interest income you receive from investing in municipal bonds is free from federal income taxes, which is not the case for private debt. Ideally, this exemption would be phased out, broadening the tax base, levelling the playing field and allowing for small cuts to overall taxes on investment in a revenue-neutral manner.
Reassess, revise, and review regulations that raise the costs of providing infrastructure. This paper is primarily concerned with evaluating the economic case for major government infrastructure investment in the United States. However, clearly, existing policies in many areas increase the cost of infrastructure provision more broadly. A paper by outside consultants for the Obama administration acknowledged, for example, “Increased capital costs are also a product of enhanced design standards and regulatory requirements related to performance, safety, environmental protection, reliability, and resiliency.”117
Complying with the National Environmental Policy Act (NEPA) has “extended the schedule and generally increased the cost of implementing major infrastructure projects.”118 The Federal Highway Administration estimates that “the average time to complete a NEPA study increased from 2.2 years in the 1970s, to 4.4 years in the 1980s, to 5.1 years in the 1995 to 2001 period, to 6.6 years in 2011.”119 A lengthy NEPA study increases costs and adds significant uncertainty to a project, deterring private investment. Useful suggestions have been made for how to relieve this burden, from time limits for agency decisions through to narrowing the act to focus only on issues not covered by other environment regulations.120 Thankfully, it appears the administration intends to streamline this regulatory process.
Regulations of inputs to the construction process also raise costs. The Davis-Bacon Act commits federal construction projects to pay the “prevailing wages” of the surrounding area for construction workers. In practice, this often means union rates, which means a significantly higher cost. The CBO estimates repealing the act could have saved taxpayers $13 billion between 2015 and 2023.121 Buy America regulations likewise impose requirements on federal construction projects to use American steel, iron, and other products in highway construction, unless a special waiver is granted—another regulation likely to increase costs. Add to this compliance with land-use planning laws, and it becomes clear that before asserting that more federal funding is needed for infrastructure, politicians should reassess existing regulations that make overall infrastructure delivery more expensive. Of course, higher import tariffs or antidumping measures on imported inputs such as steel would drive up costs further.
Conclusion
Clearly, President Trump wants to sign off on a major program of infrastructure investment. At times, the president and his team have used both short-term macroeconomic “stimulus” arguments and longer-term structural arguments to justify such a program. But more recently, the administration appears to have recognized that fixing “underlying incentives, procedures, and policies” is more important than funding alone.”122
This paper has dismissed the case for using infrastructure investment on short-term macroeconomic grounds today. In fact, a rushed attempt to begin “shovel-ready” projects or “create jobs” will likely harm the economy in the longer term, as resources are misallocated and infrastructure is delivered in the wrong places.
Instead, the administration should focus on long-term growth and on creating an institutional environment where investment is responsive to the wants and needs of users. That approach requires not obsessive focus on hitting arbitrary spending limits through big increases in federal funding, infrastructure tax credits, and a wide role for PPPs, but a reassessment of the whole framework of infrastructure policy.
Certainly, scope for significantly more private-sector investment exists. That could be achieved through regulatory and tax reforms, rather than new, costly tax credits or complex contracts that impose long-term burdens on taxpayers in a nontransparent way. Harnessing private-sector expertise should come as part of a broader attempt to remove current barriers to investment and to devolve decisions on infrastructure to as low a level of government as possible.
President Trump has a real opportunity to improve the framework for infrastructure development. The principles outlined in his recent infrastructure initiative provide a good starting point. But it is still unclear which projects will be considered, how they will be selected, how much power will be returned to states, and how private-sector involvement will be incentivized. These details are highly likely to determine the administration’s success or otherwise in improving policy.
Notes
- “Transcript: Donald Trump’s Victory Speech,” New York Times, November 9, 2016, https://www.nytimes.com/2016/11/10/us/politics/trump-speech-transcript.html.
- “Infrastructure: Donald Trump’s Vision,” Trump-Pence campaign website.
- Melanie Zanona, “Chao Commits to Multiple Funding Tools for Trump’s Infrastructure Plan,” the Hill, January 11, 2017, http://thehill.com/policy/transportation/313814-chao-commits-to-multiple-funding-tools-for-trumps-infrastructure- plan.
- “Fact Sheet, 2018 Budget: Infrastructure Initiative,” White House, https://www.whitehouse.gov/sites/whitehouse.gov/files/omb/budget/fy2018/fact_sheets/2018%20Budget%20Fact%20Sheet_Infrastructure%20Initiative1.pdf.
- Joan Lowy, “Senate Democrats Want Donald Trump to Support Their $1 Trillion Infrastructure Plan,” Associated Press, January 24, 2017, https://apnews.com/e7c29b21e1b3486a8f90f4b7ef32b90f; Elana Schor, “Hopes Dim for Trump Infrastructure Deal with Democrats,” Politico, January 29, 2017, http://www.politico.com/story/2017/01/trump-infrastructure-deal-democrats-234279.
- Lawrence Summers, “Building the Case for Greater Infrastructure Investment,” www.larry summers.com, September 16, 2016, http://larry summers.com/2016/09/12/building-the-case-for-greater-infrastructure-investment/.
- Lynn Horsley et al., “Trump Team Compiles Infrastructure Priority List,” McClatchy DC, January 24, 2017, http://www.mcclatchydc.com/news/politics-government/white-house/article128492164.html.
- Christina Romer and Jared Bernstein, “The Job Impact of the American Recovery and Reinvestment Plan,” Council of Economic Advisers, Washington, January 9, 2009.
- J. Bradford DeLong and Lawrence H. Summers, “Fiscal Policy in a Depressed Economy,” Brookings Institution, Washington, Spring 2012.
- See the explanation of differing methodologies in Roberto Perroti, “Estimating the Effects of Fiscal Policy in OECD Countries,” Working Paper no. 276, IGIER (Innocenzo Gasparini Institute for Economic Research), Bocconi University, Milan, Italy, 2004.
- Robert Barro and Charles Redlick, “Macroeconomic Effects from Government Purchases and Taxes,” Quarterly Journal of Economics 126 (2011): 51–102; Robert Hall, “By How Much Does GDP Rise If the Government Buys More Output?” Brookings Institution, Washington, 2009, p. 183–231.
- Valerie Ramey, “Identifying Government Spending Shocks: It’s All in the Timing,” Quarterly Journal of Economics 126 (2011): 1–50.
- This type of result tends to be more common for developing countries with high debts. However, one example appears in Andrew Mountford and Harald Uhlig, “What Are the Effects of Fiscal Policy Shocks?” Journal of Applied Econometrics 24 (2009): 960–92.
- Dylan Matthews, “Did the Stimulus Work? A Review of the Nine Best Studies on the Subject,” Washington Post, August 24, 2011, https://www.washingtonpost.com/blogs/ezra-klein/post/did-the-stimulus-work-a-review-of-the-nine-best-studies-on-the-subject/2011/08/16/gIQAThbibJ_blog.html.
- James Feyrer and Bruce Sacerdote, “Did the Stimulus Stimulate? Real Time Estimates of the Effects of the American Recovery and Reinvestment Act,” NBER Working Paper no. 16759, National Bureau of Economic Research, Cambridge, MA, February 2011.
- James Pethokoukis, “That Bernstein-Romer Jobs Chart: A Final Appraisal,” AEI Ideas (blog), American Enterprise Institute, January 10, 2014, http://www.aei.org/publication/that-bernstein-romer-jobs-chart-a-final-appraisal/.
- See, for example, the blog entries on “Market Monetarism” by the economist Scott Sumner; Scott Sumner, “Monetary offset isn’t really a choice, it’s built in to policy,” Econlog (blog), January 11, 2017; and Casey B. Mulligan, The Redistribution Recession: How Labor Market Distortions Contracted the Economy (New York: Oxford University Press), 2012.
- Ethan Ilzetzki et al., “How Big (Small?) Are Fiscal Multipliers?” NBER Working Paper no. 16479, National Bureau of Economic Research, Cambridge, MA, October 2010.
- Ibid., pp. 17–19; Ethan Ilzetzki, “Does Fiscal Policy Work?” LSE CentrePiece, autumn 2010.
- John Y. Campbell and N. Gregory Mankiw, “Consumption, Income, and Interest Rates: Reinterpreting the Time Series Evidence,” in NBER Macroeconomics Annual, vol. 4, ed. Olivier Blanchard and Stanley Fischer, pp. 185–246 (Cambridge, MA: MIT Press, 1989).
- Peter Ganong and Pascal Noel, “How Does Unemployment Affect Consumer Spending?” working paper, January 2016, https://scholar.harvard.edu/files/ganong/files/ganong_jmp_unemployment_….
- Alan Auerbach and Yuriy Gorodnichenko, “Measuring the Output Responses to Fiscal
Policy,” American Economic Journal: Economic Policy 4 (2012): 1–27. - Lawrence Christiano et al., “When Is the Government Spending Multiplier Large?” Journal of Political Economy 119 (2011): 78–121.
- Jérémie Cohen-Setton and Natacha Valla, “Unnoticed Potential Output Revisions and Their Impact on the ‘Stimulus/Austerity Debate,’” VoxEu, August 2010, http://voxeu.org/article/output-revisions-and-stimulus-debate.
- Olivier Blanchard et al., “Short-Run Effects of Lower Productivity Growth: A Twist on the Secular Stagnation Hypothesis,” Policy Brief no. 17–6, Peterson Institute for International Economics, Washington, February 2017.
- William Dupor, “So, Why Didn’t the 2009 Recovery Act Improve the Nation’s Highways and Bridges?” Federal Reserve Bank of St. Louis
Review 99 (2017): 169. - John Cogan and John Taylor, “What the Government Purchases Multiplier Actually Multiplied in the 2009 Stimulus Package,” in Government Policies and the Delayed Economic Recovery, ed. Lee Ohanian et al., pp. 85–114 (Stanford, CA: Hoover Institution Press, 2012).
- Edward M. Gramlich, “State and Local Budgets the Day after It Rained: Why Is the Surplus So High?” Brookings Papers on Economic Activity, 9 (1978): 191–216.
- E. Cary Brown, “Fiscal Policy in the ’Thirties: A Reappraisal,” American Economic Review 46 (1956): 867.
- “Fact Sheet, 2018 Budget: Infrastructure Initiative,” White House.
- “Paul Krugman: An Alien Invasion Could Fix the Economy,” Time, August 16, 2011, http://business.time.com/2011/08/16/paul-krugman-an-alien-invasion-could-fix-the-economy.
- Atif Mian and Amir Sufi, “The Effects of Fiscal Stimulus: Evidence from the 2009 ‘Cash for Clunkers’ Program,” NBER Working Paper no. 16351, National Bureau of Economic Research, Cambridge, MA, September 2010.
- Mark Hoekstra et al., “Cash for Corollas: When Stimulus Reduces Spending,” NBER Working Paper no. 20349, National Bureau of Economic Research, Cambridge, MA, July 2014.
- Valerie Ramey, “Discussant Comments on ‘Fiscal Policy in a Depressed Economy’ by J. Bradford DeLong and Lawrence H. Summers,” Brookings Institution, Washington, June 26, 2012.
- Aiko Mineshima et al., “Size of Fiscal Multipliers,” in Post-Crisis Fiscal Policy, ed. Carlo Cottarelli et al., pp. 315–72 (Cambridge, MA: MIT Press, 2014).
- Mountford and Uhlig, “What Are the Effects of Fiscal Policy Shocks?”; Alberto F. Alesina and Silvia Ardagna, “Large Changes in Fiscal Policy: Taxes versus Spending,” NBER Working Paper no. 15438, National Bureau of Economic Research, Cambridge, MA, October 2009; Christina D. Romer and David H. Romer, “The Macroeconomic Effects of Tax Changes: Estimates Based on a New Measure of Fiscal Shocks,” NBER Working Paper no. 13264, National Bureau of Economic Research, Cambridge, MA, July 2007; Karel Mertens and Morten Ravn, “A Reconciliation of SVAR and Narrative Estimates of Tax Multipliers,” Journal of Monetary Economics 68 (2014): S1–S19; Jaime Guajardo et al., “Expansionary Austerity: International Evidence,” Journal of the European Economic Association 12 (2014): 949–68.
- Alberto F. Alesina et al., “The Output Effect of Fiscal Consolidation Plans,” Journal of International Economics 96 (2015): S19–S42.
- Eric M. Leeper et al., “Government Investment and Fiscal Stimulus,” IMF Working Paper no. 10/229, International Monetary Fund, Washington, 2010, p. 3.
- Stephanie Condon, “Obama: ‘No Such Thing as Shovel-Ready Projects,’” CBS News, October 13, 2010, http://www.cbsnews.com/news/obama-no-such-thing-as-shovel-ready-projects/.
- Congressional Budget Office, “Policies for Increasing Economic Growth and Employment in 2010 and 2011,” January 2010, https://www.cbo.gov/publication/41813.
- Romer and Bernstein, “Job Impact of the Recovery and Reinvestment Plan.”
- Congressional Budget Office, “Budget and Economic Data” website, April 12, 2017, https://www.cbo.gov/about/products/budget-economic-data.
- Regis Barnichon and Geert Mesters, “How Tight Is the U.S. Labor Market?” FRBSF Economic Letter, Federal Reserve Bank of San Francisco, March 20, 2017.
- Bureau of Labor Statistics, “Labor Force Statistics from the Current Population Survey–Industry: Construction,” website, April 12, 2017, https://data.bls.gov/timeseries/LNU04032231?data_tool=XGtable.
- Paul Krugman, “The Cases for Public Investment,” New York Times, February 27, 2016, https://krugman.blogs.nytimes.com/2016/02/27/the-cases-for-public-inves….
- Ben Bernanke, “The Fed and Fiscal Policy,” Brookings Institution blog, January 13, 2017.
- Paul Krugman, “Cases for Public Investment.”
- Diane Whitmore Schanzenbach et al., “If You Build It: A Guide to the Economics of Infrastructure Investment,” Hamilton Project, Brookings Institution, Washington, February, 2017, https://www.brookings.edu/research/if-you-build-it-a-guide-to-the-economics-of-infrastructure-investment/.
- Noah Smith, “Don’t Lowball the Upside of Fixing Roads and Bridges,” Bloomberg View Economics, August 23, 2016, https://www.bloomberg.com/view/articles/2016–08-23/don-t-lowball-the-upside-of-fixing-roads-and-bridges.
- Rebecca Smith, “Heathrow Given £650m Post-Brexit Backing by Shareholders for New
Investments after PM Triggers Article 50,” City A.M., March 30, 2017, http://www.cityam.com/262042/heathrow-given-650m-post-brexit-backing-shareholders-new. - Andrew M. Warner, “A Framework for Efficient Government Investment,” IMF Working Paper no.13/58, International Monetary Fund, Washington, 2013.
- Ronald M. Coase, “The Lighthouse in Economics,” Journal of Law and Economics 17 (1974): 357–76.
- Dan Weil, “Shiller: Why Negative Rates Aren’t Sparking More Investment Is ‘Puzzle of Our Time,’” Newsmax, February 12, 2015, http://www.newsmax.com/Finance/Shiller-negative-rates-investment/2015/02/12/id/624455/.
- Schanzenbach et al., “If You Build It.”
- “Update 3: French Motorway Operators Contest Government Toll Freeze,” Reuters, January 27, 2015, http://www.reuters.com/article/motorway-freeze-idUSL6N0V62L220150127.
- John Authers, “Political Risk Lowers Appetite for Infrastructure Deals,” Financial Times Wealth Management, June 10, 2015, https://www.ft.com/content/ed3d0722-0f8d-11e5-94d1-00144feabdc0.
- Tad DeHaven, “Privatizing Amtrak,” Downsizing the Federal Government website, June 2010, https://www.downsizinggovernment.org/sites/downsizinggovernment.org/files/transportation-amtrak-subsidies.pdf.
- Pengyu Zhu and Jeffrey R. Brown, “Donor States and Donee States: Investigating Geographic Redistribution of the U.S. Federal-Aid Highway Program 1974–2008,” Boise State University, Montana, January 1, 2013.
- Congressional Budget Office, “Approaches to Making Federal Highway Spending More Productive,” February 11, 2016, p. 1, https://www.cbo.gov/publication/50150.
- California High-Speed Rail Authority, “California High-Speed Rail Benefit-Cost Analysis (BCA),” analysis prepared by Parsons Brinckerhoff, April 2012, http://www.hsr.ca.gov/docs/about/business_plans/BPlan_2012BCP.pdf.
- Edward L. Glaeser, “If You Build It … Myths and Realities about America’s Infrastructure Spending,” City Journal, September 12, 2016, https://www.city-journal.org/html/if-you-build-it-
14606.html. - Toni Horst et al., “40 Proposed U.S. Transportation and Water Infrastructure Projects of Major Economic Significance,” U.S. Treasury Build America Initiative, Fall 2016, https://www.treasury.gov/connect/blog/Documents/final-infrastructure-report.pdf.
- Oliver Knipping and Richard Wellings, “Which Road Ahead—Government or Market?,” Institute of Economic Affairs, London, October 12, 2012, https://iea.org.uk/publications/research/which-road-ahead-government-or-market.
- Nico Voigtlaender and Hans-Joachim Voth, “Highway to Hitler,” NBER Working Paper no. 20150, National Bureau of Economic Research, Cambridge, MA, May 2014.
- Tanya Snyder, “Trump’s ‘Sanctuaries’ Crackdown Imperils Transportation Projects,” Politico, February 18, 2017, http://www.politico.com/story/ 2017/02/trump-sanctuary-cities-crackdown-transportation-projects-235158.
- Bent Flyvbjerg, Nils Bruzelius, and Werner Rothengatter, Megaprojects and Risk: An Anatomy of Ambition (New York: Cambridge University Press, 2003).
- Ibid.
- Bent Flyvbjerg, Mette Skamris Holm, and Søren Buhl, “Underestimating Costs in Public Works Projects: Error or Lie?” Journal of the American Planning Association 68 (2002): 279–95.
- César Calderón et al., “Is Infrastructure Capital Productive? A Dynamic Heterogeneous Approach,” Policy Research Working Paper no. 5682, World Bank, Washington, June 2011.
- Andrew M. Warner, “Public Investment as an Engine of Growth,” IMF Working Paper no. 14/148, International Monetary Fund, Washington, August 2014, p. 25.
- Ibid., p. 63.
- Martin Fackler, “Japan’s Big-Works Stimulus Is Lesson,” New York Times, February 5, 2009.
- Klaus Schwab, ed., The Global Competitiveness Report 2016–2017 (Geneva: World Economic
Forum, 2016). - Organisation for Economic Co-operation and Development data website, GDP per hour worked, Total (U.S. dollars), 1970–2016.
- Atif Ansar et al., “Does Infrastructure Investment Lead to Economic Growth or Economic Fragility? Evidence from China,” Oxford Review of Economic Policy 32 (2016): 360–90.
- David Aschauer, “Is Public Expenditure Productive?” Journal of Monetary Economics 23 (1989): 177–200.
- Alicia H. Munnell, “Infrastructure Investment and Economic Growth,” Journal of Economic Perspectives 6 (1992):189–98.
- Edward M. Gramlich, “Infrastructure Investment: A Review Essay,” Journal of Economic Literature 32 (1994): 1176–96.
- Etsuro Shioji, “Public Capital and Economic Growth: A Convergence Approach,” Journal of Economic Growth 6 (2001): 205–27.
- John Fernald, “Roads to Prosperity? Assessing the Link between Public Capital and Productivity,” American Economic Review 89 (1999): 619–38.
- Gilles Duranton and Matthew A. Turner, “Urban Growth and Transportation,” Review of Economic Studies 79 (2012): 1407–40.
- Pedro Bom and Jenny Ligthart, “What Have We Learned from Three Decades of Research on the Productivity of Public Capital?” Journal of Economic Surveys 28 (2014): 889–916.
- White House, Office of the Press Secretary, “Press Briefing by Press Secretary Sean Spicer #12,” February 14, 2017, https://www.whitehouse.gov/the-press-office/2017/02/14/press-briefing-press-secretary-sean-spicer-2142017–12.
- American Society of Civil Engineers, “2013 Report Card for America’s Infrastructure,” Reston, VA, March 2013.
- Thomas Frank, “Civil Engineers Say Fixing Infrastructure Will Take $4.6 Trillion,” CNN, March 9, 2017, http://money.cnn.com/2017/03/09/news/infrastructure-report-card/.
- Schwab, Global Competitiveness Report 2016–2017.
- Julian Donaubauer et al., “A New Global Index of Infrastructure: Construction, Rankings and Applications,” Working Paper no. 1929, Kiel Institute for the World Economy, Kiel, Germany, June 2014.
- Chad Shirley, “Spending on Infrastructure and Investment,” Congressional Budget Office, March 1, 2017, https://www.cbo.gov/publication/52463.
- Hillary Clinton, “Remarks on Investing in Infrastructure during the First 100 Days in Office,” May 26, 2016, Iowa State University Archives of Women’s Political Communication, Ames.
- U.S. Bureau of Transportation Statistics, “Condition of U.S. Highway Bridges,” U.S. Department of Transportation, https://www.rita.dot.gov/bts/sites/rita.dot.gov.bts/files/publications/national_transportation_statistics/html/table_01_28.html.
- Federal Highway Administration, “2015 Status of the Nation’s Highways, Bridges, and Transit: Conditions & Performance,” chap. 3, pp.159.
- U.S. Department of Transportation, Federal Aviation Administration, Office of Airport Planning and Programming, National Planning Division, https://www.rita.dot.gov/bts/sites/rita.dot.gov.bts/files/publications/national_transportation_
statistics/html/table_01_25.html. - U.S. Department of Transportation, Federal Highway Administration, Status of the Nation’s Highways, Bridges, and Transit: Conditions & Performance, (Washington: DOT, 2015), chap. 3.
- Changes to the methodology mean that the newer figures are not directly comparable with those presented above.
- U.S. Department of Transportation, Status of the Nation’s Highways, Bridges and Transit: Conditions and Performance (Washington: DOT, Biennial Issues), Tables 3–35 and 3–36.
- Federal Transit Administration, “National Transit Summaries and Trends” website (annual reports), Table 25.
- U.S. Department of Transportation, Status of the Nation’s Highways, Tables 3–31 and 3–34.
- Randal O’Toole, “The Truth about Infrastructure,” U.S. News and World Report, March 24, 2015, https://www.usnews.com/opinion/economic-intelligence/2015/03/24/dont-raise-gas-tax-to-fix-supposed-infrastructure-crisis.
- Peter Navarro and Wilbur Ross, “Trump versus Clinton on Infrastructure,” October 27, 2017, http://peternavarro.com/sitebuildercontent/site builderfiles/infrastructurereport.pdf.
- R. Smith, “Heathrow Given £650m Post-Brexit Backing.”
- Chris Edwards, “Take the Public-Private Road to Efficiency,” Wall Street Journal, February 19, 2013, https://www.wsj.com/articles/SB10001424127887323478004578304372344816256.
- More information about the project can be found at http://parapidbridges.com/projectover view.html.
- Shirley, “Spending on Infrastructure and Investment.”
- National Audit Office, “Private Finance Projects,” October 2009, https://www.nao.org.uk/report/private-finance-projects/.
- HM Treasury, “A New Approach to Public Private Partnerships,” London, December 2012, https://ppp.worldbank.org/public-private-partner ship/library/new-approach-public-private-partner ships.
- Jesse Norman, “After PFI,” Centre for Policy Studies, May 7, 2012, http://www.cps.org.uk/files/reports/original/120430110627-AfterPFI.pdf.
- Institute of Economic Affairs, “Public-Private Partnerships,” Economic Affairs 29, no.1 (2009).
- Allen Consulting Group and the University of Melbourne, “Performance of PPPs and Traditional Procurement in Australia,” November 30, 2007.
- Randal O’Toole, “The Trouble with Trump’s Infrastructure Ambitions,” New York Daily News, November 30, 2016, http://www.nydailynews.com/opinion/trouble-trump-infrastructure-ambitions-article‑1.2893156.
- “Fact Sheet, 2018 Budget: Infrastructure Initiative,” White House.
- Chris Edwards, “Infrastructure Investment,” in Cato Handbook for Policymakers, 8th ed., pp. 325–33 (Washington: Cato Institute, 2017).
- Ryan Bourne, “What Did Privatisation Do for Us?” Centre for Policy Studies Growth Bulletin, April 11, 2013.
- “Fact Sheet, 2018 Budget: Infrastructure Initiative,” White House.
- Glaeser, “If You Build It.”
- Dupor, “Why Didn’t the Recovery Act Improve Highways and Bridges?”
- Congressional Budget Office, “Making Federal Highway Spending More Productive.”
- Horst et al., “40 Proposed Infrastructure Projects,” p. 7.
- Ibid.
- Transportation for America, “State Transportation Funding: States Successfully Raising New Transportation Revenue,” 2015.
- Diane Katz and Craig Manson, “The National Environmental Policy Act,” in Environmental Conservation: Eight Principles of the American Conservation Ethic, ed. Jack Spencer, pp. 59–64 (Washington: Heritage Foundation, 2012).
- Congressional Budget Office, “Choices for Deficit Reduction: An Update,” December 2013.
- “Fact Sheet, 2018 Budget: Infrastructure Initiative,” White House.

About the Author
