
Transit, intercity rail, automobile, and commercial air travel all receive taxpayer subsidies, albeit to widely varying degrees. Both public transit and intercity rail are heavily subsidized, with costs far exceeding operating revenues. Auto and driver taxes and fees cover most, but not all, of the costs of car travel when all user revenues are considered. Air travel also receives significant taxpayer subsidies, especially in times of crisis such as after 9/11 and during the COVID-19 pandemic.
Enhanced communications technologies are reducing the need for travel under certain circumstances. Government policies such as the Buy America requirements and employee benefit mandates increase the cost of building and operating transportation facilities. We offer a range of policy options that would either eliminate transportation subsidies or reduce their size while improving their efficiency. These recommendations include shifting to driverless transit vehicles, removing the tax preference for employee parking, and privatizing airports.
Introduction
Governments at all levels have been heavily involved in providing transportation services for centuries. Evolving government interventions have given rise to a complex set of subsidies provided to users of all transport modes. The goal of this study is to disentangle the thicket of subsidies to determine the net government support that is being provided to four transport modes: transit, intercity rail, car travel, and commercial air travel.
Unsurprisingly, both transit and intercity rail receive heavy subsidies. Decades have now passed since the private sector was the primary provider of these services, and they have become increasingly inefficient under public ownership. Without injections of general tax revenue most of these services could no longer operate, let alone make the capital investments required to maintain and expand services.
Public transportation advocates argue that car travel also receives heavy subsidies. But their analysis is often incomplete, limited to observing the fact that federal gas tax revenues have failed to keep up with the increasing cost of building and maintaining roads. But this perspective misses several revenue streams that governments obtain from road users (i.e., drivers and car owners). These include state and local gas taxes, vehicle registration fees, sales taxes on vehicles and vehicle parts, and tolls. When these other revenue sources are combined with federal gas taxes, driving is still subsidized, but these subsidies are marginal. They could be eliminated with incremental policy changes that would only have minimal impacts on drivers.
Fliers who have studied the components of their airfares (which include heavy taxes) and noted the premium prices they pay for airport concessions may be surprised that they, too, are being subsidized by other taxpayers. Most of the subsidies arise from Transportation Security Administration (TSA) screening, which is financed from general revenues and periodic taxpayer bailouts of the air carriers.
While subsidies have obvious benefits to transportation providers and users, these benefits are provided by extracting money from taxpayers and often encourage inefficient provision of transportation services. Government injects further inefficiencies through policies that require the use of American products in capital projects, which encourage unionization in public transit and require excessive environmental reviews of transportation projects.
Overall welfare would improve if government fully separated itself from transportation. But in recognition of the reality that some transportation subsidies are deeply embedded and enjoy strong political support, there are some incremental policy options that would reduce the size of transportation subsidies and the inefficiencies they engender.
Estimates of Transport Subsidies by Mode
Estimates of net transportation subsidies are summarized by mode in Table 1, and a more detailed discussion describing our sources and calculation methods can be found in the Appendix. A subsidy is defined here as the difference between total spending to support each transportation mode and the amount of user fees collected. Trust fund balances and the interest credited to them are disregarded, and externalities that arise from transportation subsidies (both positive and negative) are not taken into consideration because they are difficult to quantify.
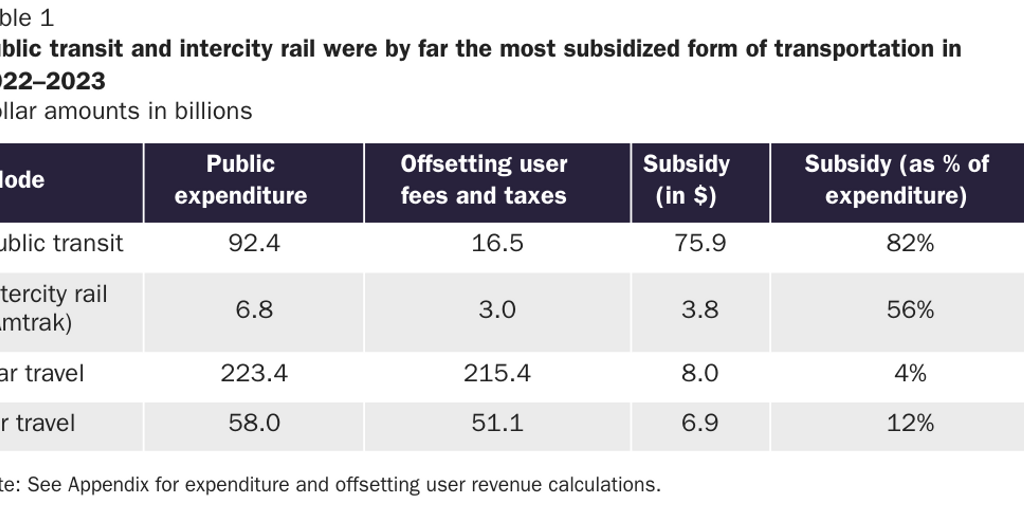
In fiscal year (FY) 2023, governments at all levels spent $92.4 billion on public transit, of which only $16.5 billion was offset by fares and other system-generated revenues (from advertising, station parking, etc.), yielding a net subsidy of $75.9 billion. Intercity rail is also heavily subsidized: Amtrak received $3.8 billion in state and federal subsidies during its FY 2023, roughly equivalent to the $4 billion of passenger revenue it generated during the year. These heavy subsidies perpetuate passenger rail transportation systems, both local and intercity, that proved to be unprofitable during the 20th century and have recently become even more economically inefficient because of rising labor costs.
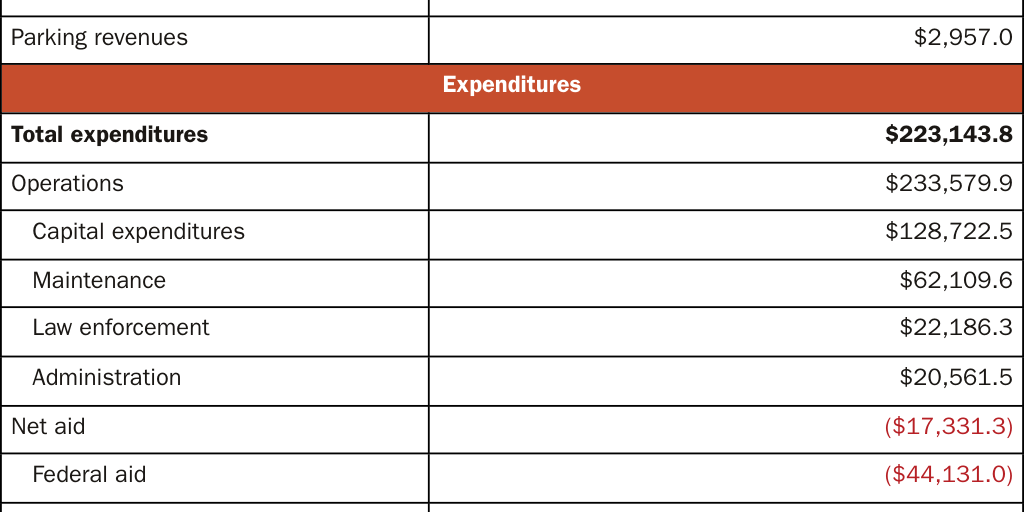
With respect to road transportation, the situation is murkier. For 2022 (the latest year that data were available when we conducted our research), we identified $223 billion of government expenditures related to driving and road infrastructure, compared to $216 billion of revenues. The revenues were derived from a variety of sources, as shown in Table 2. Modest increases in user fees and/or more efficient service provision would eliminate these subsidies.
Finally, air travel generated $51.1 billion of public revenues, which were offset by $58 billion of government expenditures, yielding a net subsidy of $6.9 billion. Commercial airlines, which account for the bulk of air travel revenue and expenditure, did not receive public subsidies in 2023, but they did receive federal support during the COVID-19 pandemic. As with car travel, there appears to be enough consumer demand to make air travel fully self-sustaining if the political will to eliminate subsidies were present.
Table 1 summarizes these findings and shows the relative degree of subsidization. Arguably the percentages for car travel and air travel are overstated because the very large proportion of private expenditure is not included. Even with this omission, on a relative basis, these two modes receive a much smaller public subsidy than transit and intercity rail.
Desirability of Subsidies and Other Policy Concerns
Subsidizing any desirable human activity typically comes with highly visible benefits and unseen costs. While the advantages of moving around at submarket prices are readily apparent, providing that benefit imposes costs on the rest of the economy through taxation and inflation. Because these costs are widely dispersed, they are often hard to notice.
The Case for Subsidies
Greater mobility is thought to be associated with greater wealth and opportunity. During the Middle Ages, many people rarely traveled more than a few miles from their homes, which limited their opportunities to prosper.1 Today, the concern is that poor and racial minorities are unable to share the benefits of mobility because of market failure.
In the United States, poverty is usually highly concentrated in a few geographical areas, which experience a high degree of social isolation.2 Sociologist William Julius Wilson, in his 1987 book The Truly Disadvantaged, noted that residents of highly impoverished areas “only infrequently interact with those individuals or families who have had a stable work history” and “also seldom have sustained contact with friends or relatives in the more stable areas of the city or in the suburbs.”3 According to some civil rights activists, the existence of these areas could be attributed, at least partly, to market failures in transportation. For example, the late civil rights leader John Lewis decried transportation practices that “isolate and segregate our citizens in deteriorating neighborhoods, and fail to provide access to jobs and economic growth centers.”4 Therefore, the best way to address this perceived market failure is to provide frequent, reliable transit service to individuals in disadvantaged communities at little or no cost.
Moreover, public subsidies for mobility are justified because they have many positive externalities. For example, the Department of Transportation argues that “Enhanced transportation networks can attract investment and spur economic growth by improving connectivity among regions, fostering trade, and creating job opportunities. Reliable, clean, and modern transportation systems increase productivity by allowing businesses to operate more efficiently and effectively.”5
A very specific positive externality is the increase in property values experienced by nearby property owners when transit facilities are added. Because offices, retail facilities, and homes that are located near public transportation are readily accessible, they can fetch higher prices on the real estate market. According to the National Association of Realtors, the premium for properties near transit facilities may be as much as 150 percent.6 Finally, a strong transportation network has been seen as essential to national defense. This argument was used to justify the creation of the Interstate Highway System in the 1950s. During World War II, General Dwight D. Eisenhower noted that the German autobahn system enhanced the mobility of both German and Allied forces. When he became president, he championed the National Interstate and Defense Highways Act of 1956.7
This perspective also applies to rail networks. The US Army states on its Railroads for National Defense webpage, “Rail is a vital mode of transportation for the [Department of Defense] due to the size, weight and amount of military cargo required to deploy to seaports of embarkation in a timely manner.”8
Rebutting the Case for Subsidies
Individuals who live in isolated or impoverished areas do face greater obstacles to accessing economic opportunities. However, it does not follow that these obstacles to economic opportunities are a result of market failures in the transportation sector. In fact, most of these obstacles are a result of government failures. Exclusionary zoning, for example, has been used to prevent racial minorities from accessing economic opportunity ever since its original inception.9 Liberalizing zoning laws and other land-use policies in impoverished neighborhoods can promote greater local economic activity, thereby reducing the need to travel for employment purposes.
Moreover, there is little evidence that subsidized transportation benefits lower-income individuals. For instance, the median income of users of public transportation is consistently higher than the median income of drivers.10
In fact, there exists some evidence that subsidies for transportation can be harmful to low-income individuals. The historical development of the Interstate Highway System from 1956 to 1992, for example, displaced large numbers of low-income individuals in the name of “urban renewal.”11 In the 21st century, subsidized public transit can lead to gentrification in poorer neighborhoods. University of Minnesota economist Yunlei Qi, for example, found that poorer areas with new transit developments are likely to experience transit-induced gentrification.12 To be clear, gentrification, when it occurs as a result of market forces, is unavoidable and not necessarily harmful. However, gentrification becomes harmful when it is supported by public funds and is a result of distortionary government intervention.
Moreover, the positive externalities associated with improved transit may not necessarily hold in all instances. In a 1992 study, University of Arizona professor Arthur C. Nelson found that in Atlanta, Georgia, “elevated transit stations have positive price effects on homes in lower income neighborhoods and negative price effects on homes in higher income neighborhoods.” Specifically, for neighborhoods with higher income, increases in transit nuisance usually leads to a reduction in home prices.13 Similarly, in a 2017 study, Brigham Young professor Michael R. Ransom found that in Seattle, Washington, “the estimated impact of light rail service was positive for only one station and negative for two stations,” mostly because Seattle’s light rail “was not a significant improvement relative to the bus lines that serviced the area before light rail was built.”14
Ultimately, the focus on the positive externalities of transportation subsidies only focuses on its seen benefits. It is a fact that the vast majority of public transit systems in the United States are unprofitable. As such, the government needs to redirect highway user fees and general fund money to support these transit systems. The fiscal and economic costs of these redirected funds may outweigh any of subsidized transportation’s positive externalities. However, since these costs are unseen, they are often ignored by the public.
The national defense justification for transportation subsidies (i.e., federal funding of interstates) largely relies on the possibility of a land war in the continental United States, an event that last occurred in the 19th century. Today, the Defense Department’s larger concern is security threats overseas—and the logistics required to address these issues mainly rely on air and sea transport.
Finally, while it may be good for people to move around more, it is not obvious that private firms operating without subsidies would not offer this service in sufficient quantity. Just about everyone has mobility today because individuals invented locomotives, automobiles, and airplanes, and then private firms commercialized these inventions. There is every reason to expect that private parties will continue to improve existing forms of transportation and add new ones without government involvement. Indeed, private companies are already innovating in the areas of shared micromobility and robotaxis.
Subsidy Patterns Are Failing to Keep Up with Change
One drawback of government transportation subsidies is that they often fail to keep up with the evolution of mobility preferences and technologies. This is especially notable in the case of heavily subsidized urban metro and commuter rail systems designed to move large numbers of riders into and out of a city’s central business district at rush hour.
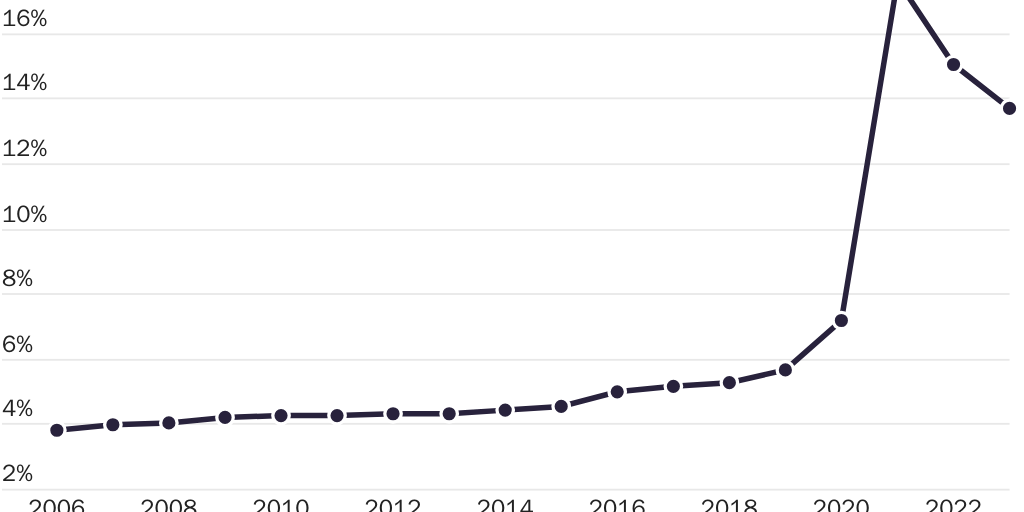
The transition to hybrid and fully remote work, which was underway before the COVID-19 pandemic but greatly accelerated by it, has undermined the business model for these costly, high-capacity commuter services. Data from the American Community Survey shown in Figure 1 portray a gradual rise in working from home before 2020, followed by a sharp spike. Although the rate is now falling back, it is likely to stabilize at a much higher level than it reached pre-pandemic and may well resume its gradual upward trend at a later date. And, because the American Community Survey does not ask about hybrid work, it understates the degree to which workers have become less dependent on commuting. According to Work from Home Research, an academic consortium affiliated with multiple universities, home-based work was still accounting for 27.9 percent of paid workdays in September 2024, compared to 7.2 percent pre-pandemic.15
Yet federal, state, and local governments continue to subsidize commuter and heavy rail infrastructure, and, in certain cases, have increased subsidies to offset declining farebox revenue. For example, during the COVID-19 pandemic, Congress appropriated an extra $69.5 billion to transit agencies, with much of the money going to commuter systems.16 With pandemic-era federal subsidies running out, some states have stepped in to continue providing operating support. In 2023, New York Governor Kathy Hochul agreed to increase a payroll tax on large employers in New York City to fund the Metropolitan Transportation Authority, which operates New York City subways and commuter railroads.17 In the same year, California Governor Gavin Newsom authorized $5.1 billion of extra funding for transit agencies across the state, including those, such as the San Francisco Bay Area Rapid Transit District, that provide commuter services.18
Environmental Goods
Advocates for transit and passenger rail subsidies often frame them as a climate change solution. But the rise of electric vehicles undermines this narrative. To the extent that train and bus trips replace trips in personal vehicles that are powered by internal combustion engines, they may help reduce greenhouse gas emissions. But the benefits are less clear when the personal vehicle trip being replaced is in an electric vehicle (EV). If the source of electricity for the EV trip is nuclear, solar, or wind, that vehicle trip is not adding carbon to the atmosphere.
Thus, California’s policy of subsidizing transit and electrified intercity rail seems at odds with its electric-vehicle mandate. California regulations require that zero-emission vehicles account for 35 percent of all new vehicle sales in 2026, 68 percent in 2030, and 100 percent in 2035 and thereafter.19 If this policy is successfully implemented, California’s expensive high-speed rail project will only displace emissions from older vehicles. A similar critique may be applied to local transit extensions that have been justified in climate change terms.
Alternative Mobility
Increasingly popular bike, electric bike, and scooter sharing services provide a low-cost alternative to transit under certain circumstances. Across the United States, shared micromobility trips increased from 2.4 million in 2011 to 136 million in 2019. After declining sharply in 2020 because of COVID-19, shared micromobility utilization nearly recaptured its pre-pandemic peak in 2023.20 The further evolution of adaptive bikes promises to make shared micromobility available to the disabled and others facing physical challenges.21
Another emerging alternative to traditional bus and rail transit is driverless ridesharing. Waymo operates fleets of electric robotaxis in San Francisco and Phoenix, with plans to expand service to Los Angeles and Austin.22
Transit subsidies that stunt the growth of this alternative in favor of reliance on larger, often underutilized, transit vehicles employing a salaried operator are inefficient.
Policies That Raise the Cost of Providing and Operating Transportation Infrastructure
Some government policies have the unintended consequence of increasing transportation costs. These policies operate at the federal, state, and local levels and have the further unintended consequence of heightening the demand for transport subsidies. Three of these policies are protectionism in federal grants, encouragement of unionization in public transportation, and environmental regulations.
Protectionism in Transportation Grants
Most major transportation projects in the United States are supported by federal grants, all of which must comply with Buy America provisions. These provisions mandate certain levels of domestic sourcing, thus increasing the cost of building transportation infrastructure.
In 1978, Congress passed the Surface Transportation Assistance Act. One major provision of the act was that federal transportation grants need to use “U.S.-made iron and steel and the domestic production and assembly of certain other manufactured goods.”23 These provisions, which came to be known as Buy America, differ for each mode of transportation. For example, highway grants require all iron, steel, and other unmanufactured goods to be domestically sourced. However, since 1983, the Federal Highway Administration has granted agencies a Buy America waiver for manufactured goods.24 On the other hand, Amtrak grants require both manufactured and unmanufactured goods to be “substantially domestic.”25
Compliance with Buy America provisions substantially increase the costs of transportation project spending in the United States. In 2017, the Washington Metropolitan Area Transit Authority (Washington, DC’s, metro system) bought 748 new train cars. According to the nonpartisan think tank American Action Forum, if it “had been able to purchase metro cars at a price equaling the foreign average, it would have saved $441 million,” or $700,000 per car.26
In some instances, Buy America compliance has meant delays in upgrading existing technology. In 2013, New York City wanted to install liquefied natural gas (LNG) engines on its Staten Island ferries. These engines would have reduced greenhouse gas emissions by 25 percent and would have halved a boat’s fuel costs. To finance this, New York City received a $2.34 million grant commitment from the Federal Transit Administration (FTA). However, city authorities were unable to source an American-made LNG engine suitable for their purposes and thus applied for a waiver. This waiver, however, was never approved by the FTA, and New York City authorities took no further action to pursue the matter.27
President Joe Biden expanded the scope of Buy America provisions. In Executive Order 14005, Biden signaled that his administration would increase enforcement and compliance of various Buy America statues.28 And, in late 2021, Congress passed the Build America Buy America Act as part of the Infrastructure Investment and Jobs Act. The new act expanded Buy America compliance to materials that included “nonferrous metals, such as copper used in electric wiring; plastic- and polymer-based products; glass, including optical fiber; and certain other construction materials, such as lumber and drywall.”29
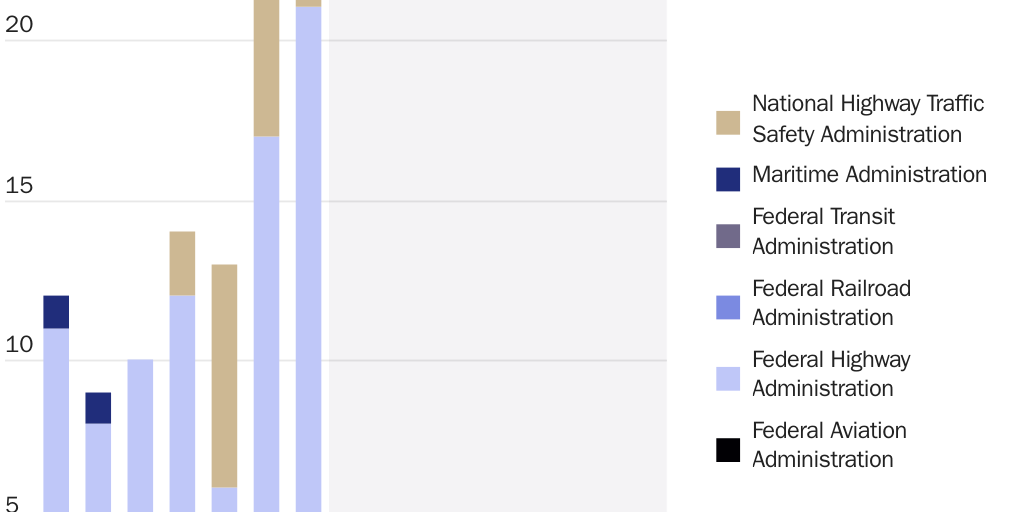
Figure 2 plots the number of Department of Transportation Buy America waivers issued each year. The usage of these waivers has fallen since Donald Trump’s first presidency and has continued to remain low throughout the Biden presidency.
Recent attempts to expand Buy America requirements have been met with pushback by state transportation agencies. In 2024, the Federal Highway Administration, citing the Build America Buy America Act and the Infrastructure Investment and Jobs Act, proposed to end the general manufacturing waiver for highway projects, citing a need to “maximize the use of goods, products, and materials produced in the United States.”30 In response, the transportation agencies of at least 15 states submitted comments in support of the waiver. The Kentucky Transportation Cabinet, for example, stated that “removing the Manufactured Products General Waiver immediately will likely introduce a pricing and supply shock across the [transportation] industry, resulting in delivery delays and cost increases due to lack of supply.”31 These concerns were repeated by the transportation departments of five Midwestern and Western states. Specifically, these states had sourced Intelligent Transportation Systems equipment, which displays messages to motorists about road conditions, from outside the United States. The states claim that it “may take years for those [ITS manufacturers] to transition to US-located, Buy America qualified manufacturing.”32
Other protectionist laws also interact with the Buy America provisions to raise transit costs. For example, the Merchant Marine Act of 1920 (Jones Act), prevents ships sailing in the United States from being crewed by non-US citizens. This requirement was cited as a reason for crew shortages in ferry services in the State of Washington.33
Moreover, states and localities have their own versions of Buy America laws. For example, in-state bidders for public works projects in Alabama have their bids discounted by 5 percent when compared to out-of-state competitors. These local preference laws undoubtedly increase the cost of transportation projects by preventing state officials from choosing the lowest-priced bids.34
Mandated Unions
In 2020, it was estimated that 74 percent of America’s transit workers were unionized.35 Unions can drive up the cost of labor in transit by negotiating wage and benefit packages that are considerably higher than similarly qualified nonunionized employees might expect.
For one, there is evidence showing that unionized transit drives up transportation costs relative to nonunionized labor. A 2018 article published by Massachusetts Institute of Technology economists Javier Morales Sarriera and colleagues finds that states with right-to-work laws incur, on average, 17 percent lower unit costs on transit buses than states without right-to-work laws. Moreover, these states see their costs escalate at an annual rate 0.4 percent slower than states lacking right-to-work protections.36 From these results, the authors conclude that “strong union bargaining power tends to lead to higher wages and benefits, higher wage and benefit growth, and also reduced flexibility to improve efficiency in service delivery.”37
Unionized transit agencies could plausibly cut costs through automation, using more nonunion labor, or by negotiating competitive labor contracts. Unfortunately, the federal government prevents transit agencies from making their services more competitive through Section 13(c) of the 1964 Urban Mass Transportation Act. This section states that grant-receiving agencies must preserve the “rights, privileges, and benefits (including continuation of pension rights and benefits) under existing collective bargaining agreements or otherwise.”38
Section 13(c) raises transit costs by preventing automation. Under Section 13(c), workers who are laid off through automation must have assurances of employment. A 1976 report produced by the Office of Technology Assessment states that section 13(c) means that “automation of an existing transit system may be deferred for a number of years until retraining, transfer, or attrition can account for the displaced workers.”39 And, according to Reason Foundation policy analyst Marc Scribner, regulations like Section 13(c) may prevent many transit agencies from adopting full automation, which has the potential to cut rail transit costs by 46 percent.40
The federal government has also attempted to use Section 13(c) to prevent transit agencies from negotiating cost-saving labor contracts. In 2013, California passed the Public Employees’ Pension Reform Act (PEPRA), which limited pension benefits for newly hired employees. In October 2021, the Department of Labor claimed that the act, when applied to transit workers, violated Section 13(c). As a result, the Department of Labor halted Section 13(c) certifications for California transit grantees, thus halting all federal transit grants to the state.41 In response, California filed a lawsuit, claiming that the department’s actions were arbitrary and capricious. This litigation remains unresolved in 2024, but the case shows how the federal government could weaponize Section 13(c) to prevent states from enacting any cost-saving reforms.
Labor unions, by themselves, are not necessarily a problem. Their existence is just another instance of free association. Unfortunately, the federal government, by protecting unions through laws such as Section 13(c) of the Urban Mass Transportation Act, has given organized labor the opportunity to continually raise transit costs at the expense of taxpayers.
Weaponized Environmental Regulations
Since the 1970s, groups of concerned citizens have used federal environmental regulations to delay infrastructure projects. The cost of these delays and the efforts spent in trying to make an infrastructure project litigation-proof further drive up infrastructure costs.
In 1971, the Supreme Court decided the case Citizens v. Volpe. In this case, a group of Memphis residents sued Secretary of Transportation John A. Volpe for approving construction of an interstate highway through Overton Park, Tennessee. The Supreme Court ruled in favor of the plaintiffs, finding that the plans to build the interstate highway were unlawful. As such, Citizens v. Volpe narrowed discretionary administrative actions that were not subjected to judicial review.42
Before Citizens v. Volpe, many homeowners had been opposed to the infrastructure projects that were the centerpiece of Dwight D. Eisenhower’s presidency. In 1959, for example, 30,000 San Francisco residents of Sunset and Glen Park successfully petitioned to halt the building of six freeway routes through the city.43 Yet most efforts to stop infrastructure before the 1970s took the form of protests and petitions.
Citizens v. Volpe opened the door for citizens to submit civil complaints on discretionary infrastructure decisions. Many of these complaints were based either on the National Environmental Protection Act (NEPA) of 1970 or the Endangered Species Act (ESA) of 1973.44 To be clear, both the NEPA and the ESA already impose heavy compliance costs on projects, with NEPA compliance taking an average of 4.5 years to complete.45 Nevertheless, concerned citizens can delay projects even further by filing NEPA or ESA lawsuits against transit projects.
One example of this is the so-called amphipod lawsuit. In 2014, a small group of Maryland homeowners filed a federal civil complaint against the construction of the Purple Line extension of the Washington area’s Metrorail transit system. At the center of this lawsuit were two endangered species of shrimp-like creatures known as amphipods. The plaintiffs argued that building the Purple Line would disturb the environment of these creatures, thus violating the Endangered Species Act.46 Maryland state officials, supported by the Fish and Wildlife Service, argued that there was no evidence of such disturbances.47 After two years of deliberation, a federal judge threw out the amphipod lawsuit. Ironically, the judge also halted the project, ordering Maryland to conduct another environmental review in accordance with the NEPA.48
The amphipod lawsuit was not a unique occurrence. A 2018 study by Stanford University researchers Michael Bennon and Devon Wilson found that half of all light rail transit and a quarter of all highway improvement projects faced NEPA litigation.49 A 2019 study by economists Leah Brook and Zachary Liscow found that the rise in infrastructure costs since the 1970s can be explained by the institutional response to the Citizens v. Volpe decision, NEPA, and environmental legislation of the late 1960s and early 1970s.50
State-level regulations can also be weaponized. California, for example, has its own version of NEPA called the California Environmental Quality Act. A 2015 study by lawyer Jennifer Hernandez and colleagues found that 23 percent of all lawsuits filed under the act are against public infrastructure and transit projects.51
These federal and state requirements raise the costs and slow the completion of new infrastructure. As a result, more tax subsidies are required to build any given number of road and rail projects.
Policy Recommendations
There are a number of policy recommendations that would reduce transport subsidies and the inefficiencies they engender, ranging from maximalist to incremental. While those in the latter category are less preferable, they are more politically feasible given the broad political support for some types of transportation subsidies.
Rail and Transit
Ideally, intercity rail and transit should be privatized, with services provided by for-profit firms, nonprofits, and cooperatives.52 Operators should only offer rail, bus, and ferry services that cover their costs.
Admittedly, such a solution would greatly reduce the amount of transit and passenger rail services available around the country. Given the strong political support for transit, alternatives that reduce and streamline subsidies may be more feasible in the short to intermediate term. Several such incremental reforms are described in the following sections.
Make Proper Use of Cost-Benefit Analysis for Transit Projects
The Federal Transit Administration chooses capital projects to fund based, at least in part, on an assessment of the costs and benefits of proposals submitted by local agencies. Benefits largely derive from the number of riders that are expected to use the new infrastructure. Consequently, estimates of construction costs and ridership are necessary for the FTA to select projects.
While government cost-benefit analysis is less likely to efficiently allocate capital than a true free-market process, it is still preferable to selecting projects based solely on political considerations. But although this type of analysis is useful in theory, its value can be compromised by poor data input and modeling choices. However, there are two enhancements that would improve the cost-effectiveness of the FTA’s use of cost-benefit analysis.
First, current FTA estimates of ridership and cost are routinely flawed, possibly because the transit agencies that are applying for grants are biased toward overstating benefits and understating costs. Many of these errant assumptions are brought to light by before and after studies, which can be found on the FTA’s website.53
One of these studies examined the Perris Valley Commuter Rail Extension, a 24-mile extension of a commuter rail line in Southern California. The extension was originally expected to cost $168.3 million but ultimately cost $248.3 million, with service commencing in 2016—five years later than expected. The error on ridership was worse, with actual weekday ridership of 550 passengers falling well below the projection of 3,430.54 Taken together, these differences result in capital costs per passenger that are 9.2 times higher than what was originally expected. Had the forecasts for this project been more accurate, perhaps it would not have been authorized.
The Government Accountability Office concluded in a 2023 report that cost forecasting has become more accurate in recent years. However, the agency also found that the pandemic made ridership forecasting more complicated and that several recently completed projects had yet to file before and after studies.55
One project that has yet to provide such a study is the Bay Area Rapid Transit extension from Warm Springs to Berryessa in North San Jose. CBS News Bay Area reported that the daily ridership projection for this $2.3 billion project was 23,000, but the actual ridership was 2,340.56
To promote better forecasting, the federal government should rely on technical experts who are independent of the prospective grantee. These experts should not receive remuneration from prospective grantees or contractors. This would eliminate any potential conflicts of interest that could bias the estimates.
To reduce spending, an additional reform is needed. Currently, Congress appropriates a fixed amount of money to the FTA for its grant programs each year. With proper cost-benefit analysis, the FTA can allocate funds to the worthiest projects, but some of these may still be wasteful. Grant funding should only be provided for projects whose benefits exceed their costs. If there are not enough projects with positive net benefits in any given year, available grant funds should be rolled over to future budget years or removed from the FTA’s budget.
Remove Legal Barriers That Raise Costs
Buy America provisions and the weaponization of environmental laws delay the completion and raise the costs of transportation projects, including rail projects. California has taken steps to exempt passenger rail projects from the California Environmental Quality Act, its version of NEPA.57 This reform could be a template for reducing transportation project costs in 15 other states that have state-specific environment planning laws.58 Eliminating Buy America requirements would involve federal action, but states should avoid layering on their own domestic sourcing requirements, as Oregon and Virginia have recently done.59
Reforming laws that encourage transit workers to unionize and that enhance union power could help to constrain operating costs, but that is a heavy lift in blue states where most transit operations are concentrated. Because of that, Congress should modify section 13(c) of the Urban Mass Transportation Act so that it no longer locks in costly post-employment benefits.
Consider Bus Rapid Transit Rather than Light Rail or Heavy Rail
Rail transit can move a very large number of passengers along a fixed route, but it is very expensive and inflexible. New rail extensions are expected to cost more than $1 billion per mile, and recent subway car procurements in New York and San Francisco had costs per vehicle of $2.7 million and $2.8 million, respectively.
Despite high capital costs, rail transit has historically been well suited to large city systems shepherding tens of thousands of workers to a dense downtown area in a short time. But that need is becoming less important now in this age of increased remote and hybrid work. And, given the expense of building and maintaining rail systems, rail is a poor match for smaller cities. Simply put, rail transit may no longer make sense from a cost-benefit perspective.
By contrast, buses and vans are less expensive to acquire and do not require dedicated tracks. They also provide greater flexibility, allowing transit agencies to alter their routes as land-use patterns and passenger demand changes. For those reasons, transit agencies should consider bus transit for future service expansion.
One drawback of buses and vans is low operating speeds. These vehicles are subject not only to the signals and traffic jams that slow cars, but they must also make more frequent stops to load and unload passengers. Buses can operate faster if they can take advantage of dedicated lanes, signal preference (i.e., traffic lights quickly turn green when they approach the intersection), and level boarding (eliminating the time required for passengers to walk up and down stairs). These elements of bus rapid transit increase costs and reduce route flexibility, but they may be preferable to obtain travel time savings and attract more riders.
Compared to rail, bus rapid transit is considerably less expensive. When the Maryland Department of Transportation estimated capital costs for its proposed Baltimore Red Line, it estimated savings of between $1.3 billion and $1.9 billion for using bus rapid transit as opposed to light rail. It also estimated an annual operational cost of $20 million—roughly half that of rail.60
Focus on Farebox Recovery
Although large transit systems became unprofitable and were municipalized decades ago, they can and should continue to be evaluated by financial metrics. The most widely used financial measure for transit agencies is the farebox recovery ratio, which is the quotient of passenger revenue and operating expenses. Because the denominator excludes capital costs, this ratio exaggerates the degree to which agencies offset their expenses at the farebox, but it still provides insight into public demand and the relative cost-effectiveness of transit operations.
While the FTA only reports farebox recovery, the State of California uses it for decisionmaking purposes. Specifically, California’s Transportation Development Act conditions state aid to transit agencies based on their ability to meet farebox recovery ratio thresholds.61
This policy is not without critics. Ridership losses during the pandemic and changing ideas about the goals of transit have led to criticism of the farebox recovery ratio as a policy tool. In 2023, the Institute of Transportation Studies at UCLA recommended that the state drop the ratio as a criterion for ongoing transit agency support because it undermined other state transit goals, such as maximizing ridership.62
According to farebox recovery critics, the focus on farebox recovery disincentivizes transit agencies from running extra service in the face of low ridership, offering more aggressive fare discounts, and providing fare-free service to some or all riders. Fare-free transit has become especially popular in recent years as transit advocates emphasize the dangers of climate change and the importance of equity.
Urban infrastructure researcher Jenny McArthur told Wired, “When you remove fares that says to people that you’ve got a right to get around regardless of your means, it’s a public good.” McArthur and other advocates analogize transit to public health, libraries, and schools, which are usually expected to be free at the point of use. Wired also notes that a benefit of free-fare transit is that agencies no longer bear the costs of collecting fares.63
But free transit can also deter some people from riding. Foremost, it results in an inefficient shift in consumption, with some people using transit because it is free to them even though it is not free to society. Second, this shift can bring especially undesirable consumption and lose desired consumption. In Portland and Tucson, fare-free initiatives were associated with an increase in assaults and more antisocial behavior on transit vehicles.64 Elsewhere, lax fare enforcement has been associated with higher crime on transit systems,65 and potential riders have cited safety concerns as a reason for avoiding transit.66
Aside from the safety issues with fare-free transit, a lack of focus on farebox recoveries reduces incentives for transit agencies to control wasteful spending and provide good customer service. Reliance on passenger revenue encourages transit agency leadership to think more like managers of a business rather than as political actors whose main objective is to maximize state and federal subsidies, as well as local transit taxes.
Consider Driverless Transit Vehicles
Because labor costs account for 57 percent of total transit operating expenses and are subject to upward pressure, finding ways to make transit less labor-intensive promises to make it more cost-effective.67 One way to reduce labor costs is to use driverless trains and buses.
Although progress toward driverless cars has been slower than was expected by industry promoters in the 2010s, there have been notable advances. Tesla now offers a full self-driving mode in its vehicles, in which the car handles all aspects of a highway trip, including lane changes and navigating on- and off-ramps.68 Waymo provides a ride-hailing service using fully autonomous vehicles throughout the city of San Francisco.69
Automating road travel is complicated by the need to handle many possible events, especially pedestrians and other road users unexpectedly crossing the vehicle’s path. This concern normally applies to both driverless cars and driverless buses. But the latter may be more feasible if they have access to dedicated lanes. As of this writing, driverless buses are operating in China, with operators in other countries evaluating the technology.70
Given the current level of technology, driverless trains running on dedicated tracks are more practical because obstructions are far less likely. In the United States, driverless airport connector trains have been common for a few decades, but the technology was not implemented on a public transit system until Skytrain began service in Honolulu in 2023.
Outside the United States, there are many more driverless metro lines. Vancouver’s fully automated metro system dates to 1985.71 Montreal is now getting its own automated system. Other international cities making extensive use of driverless trains include Paris, Doha, and Singapore. In Paris, authorities have not only built new driverless lines but converted older lines to automated operation.72 All told, more than 50 international cities now have automated train service.73
Rather than use scarce capital funds to extend transit service, authorities should invest in upgrading existing lines to driverless operation. They can then run trains on these lines more frequently, thus attracting more riders by the reduction in waiting time. But the federal government may have to relax Section 13(c) of the Urban Mass Transportation Act to allow federal funding of automation projects.
Focus Intercity Rail on Existing High-Utilization Corridors
Although Amtrak loses money overall, its Northeast Corridor service and Auto Train (which transports passengers and their personal vehicles from Northern Virginia to the Orlando area) both showed significant net operating income in FY 2023. All other routes reported adjusted operating income of less than $1 million, and all but three of these experienced operating losses.74
Operating income and losses by service are somewhat misleading because they do not reflect certain Amtrak expenses, such as employee pensions and the costs of Amtrak’s Office of the Inspector General, but they do allow for a reasonable comparison of relative financial performance by route.
Routes that show poor financial results should be targeted for elimination. Several of Amtrak’s long-distance routes have especially high operating losses and are thus the strongest candidates for termination. These include the California Zephyr (Chicago to Emeryville, California) and the Southwest Chief (Chicago to Los Angeles), which lost $75 million and $82 million to operate in FY 2023 respectively. One factor contributing to low ridership, and thus losses, on these lines is their lack of reliability. For example, during FY 2023, 14 daily California Zephyr west-bound departures never reached their final destination, while another 8 were 10 or more hours late.75 The average delay for the full fiscal year was 1 hour 45 minutes for a train that is supposed to cover 2,438 miles in 50 hours, 57 minutes.
Aside from downsizing Amtrak to its core routes, the federal government should avoid subsidizing new intercity passenger rail projects, especially those with poor cost-benefit profiles. Most notable among these is California High-Speed Rail, which has already garnered $6.8 billion in federal support. The most recent estimate of the full cost of completing Phase 1 of this project, connecting San Francisco, Los Angeles, and Anaheim, is $128 billion. Service along a portion of this route may begin in the early 2030s, but there is no date for service along the entire route because of a lack of committed funding.76 If and when service begins, ridership will almost certainly not reach the California High-Speed Rail Authority’s optimistic projections and, as a result, the line will likely produce operating losses in contravention of the ballot language that authorized bond funding of the project in 2008.77
Car Infrastructure
User charges nearly cover the full cost of building and maintaining car infrastructure. This means that a fully privatized road system should be able to operate profitably if operators can implement efficiencies and increase user charges as needed. While full privatization is a stretch goal in today’s political context, incremental reforms could better align user charges and utilization.
Privatize More Bridges and Highways—or at Least Use More Public-Private Partnerships
When private companies build and operate road infrastructure profitably and without a government subsidy, it is highly likely that both construction and operating costs are being offset by user fees and other sustainable revenue sources, such as rest stop concessions. And there are many examples of successful private bridge and highway projects, both in the United States and internationally.
As of June 2023, the private infrastructure firm Transurban solely owned and operated five toll roads in Australia, while partially owning 17 other toll roads in Australia and North America. It also operates managed lanes in the Washington, DC, area. Overall, the company had revenue equivalent to $2.8 billion in US dollars and pre-tax profits equivalent to $45 million in US dollars in 2023.78
Puerto Rico has several privately managed toll roads in operation or development. The Spanish infrastructure firm Abertis operates the PR-22 and PR‑5 toll roads and the Teodoro Moscoso toll bridge, comprising a total of 74 miles. In 2023, the company won a 40-year contract “to improve, finance, operate, and maintain toll roads PR-20, PR-52, PR-53, and PR-66 under a public-private partnership concession agreement.”79 This contract adds 144 additional miles of roadway to Abertis’ portfolio. To obtain the concession, the company had to make a $2.85 billion up-front payment to the Puerto Rico Highway and Transportation Authority.
Related Media
In addition to operating thousands of miles of toll roads abroad, Abertis also operates two tunnels in the Hampton Roads region of southeast Virginia.80 Another bridge in that area, the South Norfolk Jordan Bridge, was privately built without government funding by FIGG Bridge Engineers and is operated without subsidy by United Bridge Partners, which also operates toll bridges in Illinois, Indiana, Michigan, and West Virginia.81
These examples suggest that a large share of bridge and highway infrastructure could be operated profitably by private firms. While outright private ownership is the best solution, public-private partnerships (P3s) have been more common in the United States thus far. Under these arrangements, government and a private firm collaborate to finance, build, and/or operate pieces of infrastructure, with the private firm often having a concession to operate the infrastructure for a certain length of time. Tolling is especially attractive because, unlike the gas tax, it is not subject to revenue loss as more drivers switch to EVs. Finally, with the advance of technology, it is no longer necessary for drivers to stop or even slow down to pay their tolls.
Ensure That Other User Fees Cover Costs
The costs of building and maintaining road infrastructure that is not toll-financed have been covered by registration fees and fuel taxes. Although these charges have a long history throughout the country, they are not necessarily aligned with driving costs. The increased share of hybrid and electric vehicles is limiting gas tax revenues, and some of these revenues are being diverted to transit.
Given the loss of gas tax revenue, registration fees could play a bigger role in transportation finance. Raising registration fees across the board would reduce the subsidy that is now being provided to electric vehicle owners. The subsidy could be further reduced by varying fees by vehicle weight, thus compensating for the extra wear that heavier EVs inflict on roads. These recommendations presume that states apply registration fees to their road transportation programs rather than place them in the general fund.
Another alternative is to supplement or replace existing means of road finance with a mileage-based user fee (also known as a road usage charge). Mileage-based user fees have been piloted in most states, with Hawaii, Oregon, Utah, and Virginia operating ongoing programs.82 In Oregon drivers can pay 1.9 cents per mile driven in exchange for rebates on the gasoline tax or, in the case of EV owners, registration fees. Miles driven are reported to the state by an in-car device or calculated based on fuel consumption.83
A better alternative would be to abolish fuel taxes and rely on mileage-based user fees instead. The most accurate and timely way of assessing these fees involves the installation of an in-car device that reports mileage to the agency that is assessing the fee. But many drivers may be reluctant to install such a device because of privacy concerns. Oregon has adopted several protections that may allay these worries. For example, private companies collect the device output and then strip out location data before sharing it with the state, and the law requires all location data be destroyed within 30 days.84 Hawaii calculates the tax without an in-car device, relying instead on odometer readings at mandatory annual vehicle inspections.85
Note here that we are not arguing against (or for) a tax to correct the externalities associated with carbon emissions resulting from fuel use—that is, a Pigouvian tax.86 Admittedly, the case for any such a tax is debatable. But, even if such taxes were to be implemented, they should focus solely on offsetting the externalities associated with carbon emissions and be completely unrelated to infrastructure funding needs.
Eliminate Tax Incentives for Parking
The federal tax code allows employers to pay for employee parking benefits on a pretax basis. Under IRS regulations, employees can instruct employers who offer the benefit to deduct up to $315 per month from their taxable income and then use that money to pay the employees’ parking fees.87 For employees in the top 37 percent tax bracket, this benefit can result in tax savings of up to $1,399 per year.
The tax code offers similar tax subsidies for carpools and transit passes. From an environmental standpoint, these tax incentives are more attractive because they promote alternatives to solo passenger driving. But all these exclusions potentially increase the propensity to travel and intensify resource use.
These exclusions were added to the tax code long before the deployment of cloud computing and the COVID-19 pandemic, which together have made remote work more feasible and attractive. As a result, these tax provisions now have the unintended consequence of encouraging employees to commute rather than work from home.
While the idea of eliminating the parking incentive may garner the most support, all commuting-related tax preferences should be reevaluated.
Air Travel
Today, air travel is mostly privately operated and often profitable, but it should be fully separated from government at all levels. While air travel receives minimal subsidies in good years, large bailouts have been provided during lean years. If policymakers genuinely believe that airlines and airports should be protected from economic disruption, they should insist that these entities insure themselves against future downturns.
Ban Bailouts of Airlines and Airports
As discussed in the section on air travel subsidization, airlines are vulnerable to steep losses during crises such as 9/11 and the COVID-19 pandemic. To maintain industry continuity, Congress has felt the need to bail out the airline industry when crises occur. But, rather than burden taxpayers, airline companies could survive downturns on their own by accumulating reserves during good times.
Ideally, airlines would accumulate reserves on their own, but they may not be doing so because of moral hazard: since management knows that taxpayer support will be available when a crisis hits, there is no need to make their own preparations. This moral hazard might be addressed by a legislative ban on airline bailouts, but such a restriction could be reversed by a future congressional majority.
Lowering barriers to foreign carriers serving domestic city pairs might reduce political support for future bailouts. Currently, federal law generally prohibits foreign airlines from transporting passengers within the United States unless their country has entered into a reciprocal open-skies agreement with the United States. If this prohibition was relaxed and foreign carriers increased their market share, support for bailouts would be less because proponents would have to justify US taxpayer money going to foreign firms. This more subtle benefit would be in addition to the core benefit of repealing so-called cabotage laws, that is, it would reduce fares and increase options for domestic passengers.88
Privatize Airports
Although airports are supposed to run without operating subsidies, the Federal Aviation Administration (FAA) grant guidelines provide some wiggle room.89 Further, the fact that airports are mostly owned and operated by local government entities heightens the risk that they will attract taxpayer funds. The best way to reduce this risk is to privatize them.
In Europe and Latin America, most airports are partially or wholly owned by private firms, but in North America, 99 percent of airports are government owned.90 Sabrina Howell and her colleagues found that, after privatization, airports generally attracted more passengers and improved their financial performance. (An exception was airports in highly corrupt countries taken over by publicly traded companies.)91
Despite its benefits, outright airport privatization is illegal in the United States, but the federal government does permit airports to be run by P3s.92 These arrangements can shield taxpayers from risk if the contract makes the private operator responsible for losses.
There are currently two airport P3 agreements in the United States. Aerostar Airport Holdings has a 40-year lease on Luis Muñoz Marín International Airport in San Juan, Puerto Rico, which ends in 2053. Annual lease payments to the Puerto Rico Ports Authority are based on a share of airport revenue, leaving Aerostar fully responsible for its own expenses.93 In 2022, Avports signed a P3 agreement to operate Tweed New Haven Airport in Southern Connecticut. The agreement eliminates operating subsidies to the airport from the City of New Haven and State of Connecticut.94 A third airport may be privatized if the FAA accepts the City of Avon Park’s Airport Investment Partnership Program application, which was submitted in 2023. The Florida city is hoping to offload a money-losing general aviation airport onto a private operator.95
Conclusion
Mobility is a wonderful thing, but it is not without costs, and those costs should be borne by those reaping the benefits of mobility. Unfortunately, governments at all levels have created a complex web of free or discounted services, taxes, fees, and bailouts that have resulted in a set of mobility subsidies that are hard to understand, let alone calculate.
Some of the subsidies have strong political support, so it may not be possible to reach the ideal of fully user-funded transportation in the near term. But many incremental steps can be taken to reduce the degree of subsidization and unwind some of the funding complexities, thereby making the remaining subsidies more transparent and the nation’s passenger transportation systems more cost-effective and able to evolve with changes in technology and travel preferences.
Appendix
Defining Transportation Modes and Subsidies
Transportation can be categorized in a variety of ways. In this paper, we are concerned with passenger transportation rather than freight transportation. Although a passenger train or plane may transport some amount of cargo, the distinctions between freight and passenger rail and that between cargo and passenger flights are generally understood.
We divide the world of passenger travel into four modes:
Transit: Local rail, bus, and ferry services, which are usually subsidized and overseen by the Federal Transit Administration (FTA).
Intercity rail: Amtrak and other long-distance rail services that are under the purview of the Federal Railroad Administration (FRA).
Car travel: Motor-powered, rubber-tired vehicles traveling on national, state, and local roads and at least partially under the purview of the Federal Highway Administration (FHWA).
Air travel: Passenger air services provided by common carriers and overseen by the Federal Aviation Administration (FAA).
This categorization is largely dictated by the availability of federal data and is subject to some omissions and overlaps. For example, walking and biking are not evaluated here even though pedestrians and bikes share public roads and sidewalks with motor vehicles. Intercity buses are not considered, but these are generally private and do not receive direct subsidies.
Subsidies can be direct or indirect. In this analysis, we focus mainly on direct subsidies, which are more readily observable than indirect subsidies and thus are easy to calculate. Nonetheless, our approach to calculating direct subsidies might still yield underestimations. For example, in the transit section we derive our subsidy amount from federal, state, and local contributions to systems’ operating and capital costs. Adding these contributions of tax dollars to operating revenues yields a break-even cost of operating transit systems. But if the transit operator were a private company, it would be seeking profit. Assuming constant costs, the operator would need some combination of higher fares and greater subsidies to operate profitably.
Indirect subsidies can be difficult to define and even harder to measure. For example, if part of a city was privatized and all land-use decisions in the area were turned over to a private company, that firm might decide it could improve its financial performance by reducing the amount of space devoted to roads. If that were the case, we could regard the current land-use pattern as an indirect driving subsidy because the government that had previously managed the area devoted extra space for the convenience of drivers. But, in the absence of cases in which urban areas were transitioned from public to unregulated private ownership, measuring this theoretical subsidy would require strong and controversial assumptions.96
Finally, both direct and indirect subsidies give rise to opportunity costs, which we also do not attempt to measure here.
Measuring Transportation Subsidies
In this section, we estimate the size of taxpayer subsidies for each mode of transportation. We do this by first measuring the financial cost of providing the travel mode and then identifying all revenues contributed by users of that mode, such as transit fares, tolls, and gasoline taxes. The difference is deemed to be the subsidy.97
Transit
The Federal Transit Administration collects data on transit costs, revenues, and ridership. The last year for which the FTA has published full data is 2023. These data are based on each transit agency’s fiscal year (or “report year” in FTA terminology), which more often ends on June 30 than December 31.98
For report year 2023, the FTA reports aggregate operating expenses of $65 billion and capital expenses of $27.4 billion. Total expenditures of $92.4 billion were offset by fare revenues of $10.1 billion and other system-generated revenues (such as advertising) of $6.4 billion, yielding a taxpayer subsidy to transit agencies of $75.9 billion.99
The American Public Transportation Association publishes historical data that allow us to conduct trend analysis.100 Figure A1 shows fare revenues in current dollars since 1992. Collections peaked at around $16 billion before the pandemic and subsequently fell back to levels not seen since the early 1990s. Given that ridership in most large systems is plateauing well short of pre-pandemic levels101 and that some systems are making greater use of fare discounts, it is unlikely that current dollar fare collections will return to 2019 levels in the next few years, and constant dollar collections may never return to pre-COVID-19 peaks.102
![Copy: Figure A1 [print]: Transit Fare Revenue](https://infogram-thumbs-1024.s3-eu-west-1.amazonaws.com/83749b0e-a4b7-46c8-a88d-b0bcddf6c3aa.jpg)
Figure A2 shows fare revenues as a percentage of total expenditure (operating and capital combined). This ratio saw troughs during the dot-com recession of the early 2000s and the 2007–2008 global financial crisis. Although it rebounded from these lows, it has never returned to the peak levels of the 1990s. Given revenue pressures, as well as escalating labor costs, this ratio is unlikely to return to pre-pandemic levels.
![Copy: Figure A2 [print]: Transit Fare Revenue as Pct of Expenditure](https://infogram-thumbs-1024.s3-eu-west-1.amazonaws.com/47d18d7b-93f2-41be-bbd0-38b7ba334619.jpg)
Intercity Rail
Most taxpayer support for intercity passenger rail is provided to Amtrak, but state-level projects and operations also receive some assistance.
According to Amtrak’s most recent financial statements, the federally owned rail company recorded operating revenues of $3.6 billion and operating expenses of $5.4 billion in federal fiscal year 2023, resulting in an operating loss of $1.8 billion. Operating revenues included $2.2 billion from ticket sales, as well as $1.8 billion of other revenues earned from food and beverage sales, commercial development, access fees charged to other rail carriers, and more. An additional $0.6 billion of operating revenue came from state governments. Federal aid of $3.2 billion offset the operating loss and supported capital investment. Combining state and federal funds, 2023 taxpayer subsidies to Amtrak totaled $3.8 billion.103
Aside from Amtrak, the federal government has provided grants to several intercity rail providers. The largest recipient over the years is the California High-Speed Rail Authority, which has been awarded $6.8 billion of federal funds between 2009 and 2024, much of which has yet to be spent.104 Brightline West, a high-speed rail project connecting Southern California to Las Vegas, was awarded a $3 billion federal grant in December 2023, covering about a quarter of the line’s anticipated construction costs.105
Federal Railroad Administration grants have been awarded to several state railroad departments, but most of the large grants support Amtrak operations. One exception is the Alaska Railroad Corporation, which operates between Anchorage and Seward.106 The corporation operates without a state subsidy but has been awarded more than $140 million in federal grants for capital projects.107
Car Travel
Driving is the dominant mode of passenger transportation in the United States. According to the Census Bureau, 69.2 percent of Americans drove alone to get to work in 2023, while the Bureau of Transportation Statistics reports that highway travel (excluding buses) accounted for 80 percent of overall passenger miles in 2022.108 Drivers covered most, but not quite all, of the costs that governments incurred to provide and support driving infrastructure. Table 2 shows the breakdown of government revenues and expenditures for car travel in 2022.
Driving Revenues
Drivers pay for road services through sales taxes, motor fuel excise taxes, registration fees, tolls, and parking fees. Figure A3 gives the total real value of these various driving-related payments from 2010 to 2022. In 2022, drivers paid $216 billion to various governmental authorities.
![Copy: Figure A3 [print]: JOFFE_CHANWONG_car_revenues](https://infogram-thumbs-1024.s3-eu-west-1.amazonaws.com/c4014f3e-d6c3-468c-929e-5de5f238d0fa.jpg)
Highway-Related Excise Taxes ($100.6 billion)
The federal government, as well as state and local authorities, collect multiple highway-related excise taxes. In 2022, the combined value of these taxes was $100.6 billion.
Federal Taxes
The federal government levies four highway-related taxes:
- Fuels. In 2022, the federal government collected $41 billion from an 18.4 cent per gallon tax on gasoline and a 24.4 cent per gallon tax on diesel.109
- Trucks and trailers. The federal government assesses a 12 percent tax on the retail sales of heavy vehicles, from which it collected $4.6 billion in 2022.110
- Federal use tax. The federal government collects a tax on heavy vehicles that use highways. This tax generated around $1.6 billion in 2022.111
- Tires. In 2022, the federal government collected $712 million from an excise tax on a variety of tire types.112
Gross revenues from these four sources total approximately $48 billion. However, some of this revenue comes from nonhighway sources, such as motorboats and airplanes.113 Excluding these nonhighway sources, the net excise tax amounts to around $46.6 billion.
Figure A4 shows the inflation-adjusted federal excise tax revenues from 2011 to 2022. The real value of total federal receipts has decreased significantly, declining by approximately 9 percent from 2012 to 2022. Most of this decline is because federal fuel taxes are levied at a fixed rate per gallon and do not rise with inflation.
![Copy: Figure A4 [print]: JOFFE_CHANWONG_fed_excise](https://infogram-thumbs-1024.s3-eu-west-1.amazonaws.com/5083fc52-96dc-4a0e-8cca-ef969c296698.jpg)
State and Local Taxes
In 2022, states and local governments collected $54 billion in fuel and other highway-related excise taxes. Figure A5 plots the real value of nonfederal driving-related excise taxes from 2007 to 2022. The real value of these excise taxes increased until 2020 before falling back in response to the pandemic and the increased adoption of electric vehicles. This marks a major divergence from federal taxes, whose real value has decreased significantly since 2007.
![Copy: Figure 5 [print]: JOFFE_CHANWONG_state_local_taxes](https://infogram-thumbs-1024.s3-eu-west-1.amazonaws.com/70a22f62-311a-442f-b5a7-5932682ea9e1.jpg)
Some state and local gas taxes are levied in percentage terms rather than as a fixed rate per gallon. As a result, the state and local taxes keep up with inflation to a greater extent. Moreover, many states have been increasing their fuel taxes. From 2007 to 2022, average state and local tax rates for gasoline increased by 9 cents per gallon for both gasoline and diesel.114
Motor Vehicle Sales Tax ($41.2 billion)
States and localities collect taxes on the sale of motor vehicles and parts. Some states, such as California, impose a uniform state sales tax of 7.25 percent on new and used cars, but California’s local governments can impose additional sales taxes of up to 1.25 percent on top of the state rate.115 The District of Columbia, on the other hand, imposes both a sales tax of 6 percent and an excise tax that is based on the miles per gallon of the vehicle.116
Unlike other driving-related receipts, sales taxes collected by the state and local governments are not broken out by type of product. As a result, we are unable to obtain official figures on how much states and local governments collect from sales taxes on autos and replacement parts.
Nevertheless, we were able to produce a rough estimate. First, we obtained personal motor vehicles and parts expenditure data from the Bureau of Economic Analysis.117 In 2022, consumers spent $730 billion on motor vehicles and parts. We then multiplied the personal expenditure with the average sales tax rates for each state.118 This yielded an estimate for sales taxes levied on motor vehicles and parts. In 2022, we estimate that $41.2 billion in taxes were collected from the sales of motor vehicles and parts.
There are some caveats. For one, our estimates assume that the purchases of cars in a state are uniformly distributed among the state’s counties. However, there might be instances where car sales are concentrated in a county with high taxes. This may lead us to underestimate the actual sales tax revenues, yet we see no effective way of fixing this issue.
Moreover, some counties and states have specific exemptions to the sales tax for some cars. New Jersey, for example, exempts electric vehicle purchases from sales taxes.119 However, electric vehicles made up less than 2 percent of New Jersey’s total vehicle registrations in 2022.120 This assumption may lead to overestimations of the sales tax.
Finally, we note that our estimate is more conservative than the Alliance for Automotive Innovation’s estimate for 2021 of $63.1 billion, based on a third-party econometric model.121
Registration Fees ($53.9 billion)
States and localities impose a variety of annual fees on motor vehicles. In California, for example, new-car owners need to pay a base registration fee and a “Transportation Improvement Fee.” Owners of zero-emission vehicles built after 2020 in California also have to pay an additional “Road Improvement Fee” of $118.122 Some counties also impose registration fees: Fairfax County in Virginia, for example, imposes a fee of $33 for vehicles under 4,000 pounds and $38 for other vehicles.123 As of 2022, states and localities collected approximately $53.9 billion in fees, according to the Federal Highway Administration.124
Toll Receipts ($18.4 billion)
Government toll authorities operate many highways, bridges, and managed lanes. In some cases, these authorities levy very substantial tolls. For example, drivers using Port Authority crossings to enter Manhattan from Northern New Jersey pay up to $15.38 if they have a toll transponder, and $17.63 if they pay by mail.125 Automobiles traversing the full length of the Pennsylvania Turnpike incur a $54.40 toll with a transponder and a $109.80 toll without one.126 In New York, Pennsylvania, and elsewhere, drivers of vehicles with more than two axles pay even higher tolls.
In 2021, state and local toll authorities collected approximately $17.1 billion in receipts.127 For our 2022 figures, we calculate the growth in toll revenues from the nation’s five largest toll authorities. Assuming that the aggregate growth of toll revenues follows the change in toll revenues from the nation’s five largest toll authorities, we estimated that, in 2022, toll receipts grew by 8 percent, from $17.1 billion to $18.5 billion.128
Parking Revenues ($3 billion)
State and local governments also collect revenues for running parking facilities. According to the latest available census data, public sector parking collections totaled around $3 billion in 2022.129
Driving Expenditures
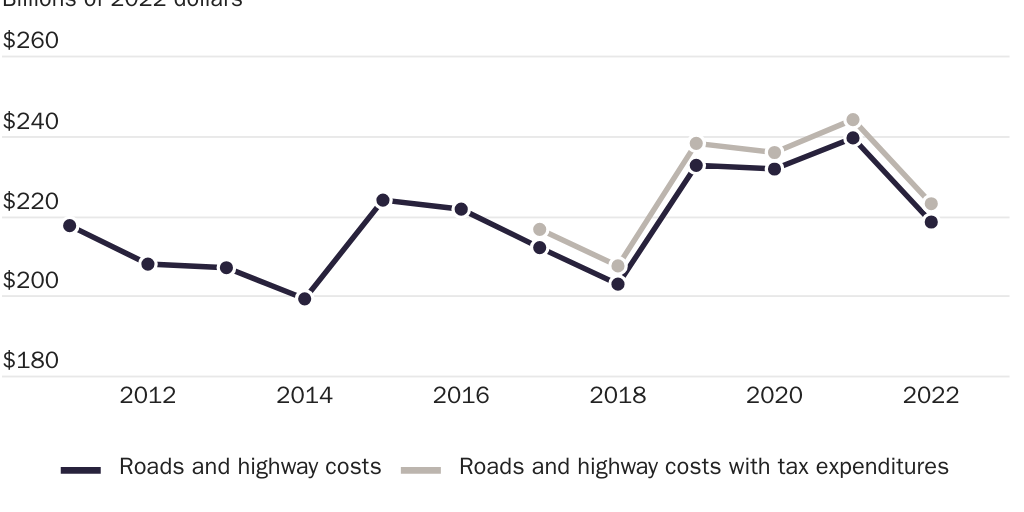
Driving expenditures include capital outlays, maintenance, administration and law enforcement, intergovernmental aid, and tax expenditures. Figure A6 shows government expenditures related to driving since 2010 (although data prior to 2015 exclude tax expenditures). In 2022, driving expenditures amounted to $223 billion—less than 4 percent above the $216 billion that governments collected in driving-related revenues.
Capital Outlays ($128.7 billion)
Capital outlays refer to expenditures relating to the purchase of land, acquisition of equipment, and the construction of new highways. States and local governments spent approximately $128.1 billion on capital outlays in 2022. This was not a significant deviation from previous years’ spending.130
In 2022, state governments spent $83.8 billion on capital outlays. Local governments spent around $44.3 billion. The federal government spent a relatively small amount of money on building roads on federal lands.131
Maintenance ($62.1 billion)
States and local governments spent approximately $62.1 billion maintaining and operating roads and highways in 2022. Local governments provided approximately $35.6 billion of these expenditures.132
Some states have passed major pieces of legislation to help fund maintenance. California’s 2018 Senate Bill 1 is an example. The bill raised state gas taxes to invest $5.4 billion annually to maintain California’s many roads and highways, with some of the proceeds going to subsidize transit.133
Administration and Law Enforcement ($42.7 billion)
State and local government spent around $22.2 billion on street and highway law enforcement. A similar amount, $20.5 billion, was used to pay Department of Motor Vehicle employees and other administrative personnel.134
Law enforcement costs are partially offset by fines that governments collect in connection with moving violations. Unfortunately, we were unable to find a data source that totals these receipts on the national level. Although a Reason Foundation analysis of census data identified $9 billion in local government fine and fee revenue in 2020, we do not know what proportion of these receipts is associated with moving violations.135
Intergovernmental Aid ($17.3 billion net)
The federal and state governments provide aid to lower levels of government in support of their road programs.
In 2022, the federal government spent $44.1 billion providing aid to states and local governments. Most federal highway aid takes the form of formula funding, which is a complex set of rules by which Congress apportions its local highway aid budget. Typical projects receive 80 percent of their funding from the federal government and 20 percent of their funding from state and local authorities.136 Interstate projects, however, receive a federal matching percentage of 90 percent.137 In 2022, the Congressional Budget Office reported that 96 percent of federal aid went to capital outlays.138
Formula funding received a massive overhaul in the 2021 Infrastructure, Investment, and Jobs Act. The act appropriated $273 billion in federal highway aid from 2022 to 2026, a 32 percent increase from the appropriations authorized from 2016 to 2020.139
State governments also provide grants to local governments. In 2022, state governments provided $21.7 billion to local governments.140
Local governments also sometimes transfer funds into state coffers. This can occur on projects with federal funding, whereby the state administers the project but funding is provided from local revenue receipts. In these instances, local governments effectively pay the state for administration.141
In calculating expenditures, we take net aid, defined as the total amount of federal aid after subtracting the difference between state aid and local government transfers. We do this to avoid overcounting. In 2022, the federal government and state governments provided $17.3 billion in net aid.
Tax Incentives ($4.8 billion in 2022)
The federal government, along with some state and county authorities, makes tax expenditures to support alternative fuels, alternative fuel vehicles, and parking benefits.
The federal government provides three main driving incentives.
First, the federal government provides an electric vehicle tax credit, which gives purchasers of electric vehicles a tax credit worth up to $7,500. There are two ways of qualifying for the electric vehicle tax credit. Individuals can qualify for the tax credit by purchasing an electric vehicle that uses domestic parts and is domestically manufactured. Apart from this purchase, the individual also needs to earn less than $150,000 annually. Another way to qualify for the electric vehicle tax credit is through business purchasing. Unlike individual purchasing, business purchases of electric vehicles are not subjected to domestic content restrictions. Moreover, businesses can claim the $7,500 tax credit even if they lease the electric vehicle to other parties. Car dealerships have taken advantage of this policy by purchasing foreign-made electric vehicles and then leasing them to customers. This allows both car dealerships and lessees to enjoy the advantages of the tax credit while skirting domestic manufacturing and income requirements.142
Second, the federal government provides various alternate fuel tax credits, which include tax credits for the use and production of ethanol and biodiesel. Third, the federal government provides a tax exemption for employer-paid parking expenses (discussed in the Policy Recommendations section). The tax expenditures arising from these incentives are reported by the Department of the Treasury.143
States and localities also offer tax credits for electric vehicles and alternate fuels. For example, Rhode Island offers a maximum $1,500 tax rebate for the purchase of a hybrid or electric vehicle. Unfortunately, states do not produce uniform estimates of tax expenditures. For this paper’s purposes, we assume every new electric vehicle purchased receives the full state tax credit available. We thus multiply the number of new electric vehicle or hybrid registrations in that year by the maximum credit available.144
The Department of Energy reports electric vehicle registrations since 2016, so data for state tax incentives only go back to 2016. We estimate that, for alternative fuels and alternative fuel vehicles, the cost of both state and federal tax incentives is $3.1 billion ($2.5 billion for states and $620 million for the federal government) in 2022. The parking-related federal tax expenditure added another $1.7 billion.
Parking Costs ($2.1 billion)
State and local governments also incur expenses in running parking facilities, and spent around $2.1 billion in 2022. Most parking expenditures were from local government sources, with state governments spending only $16.7 million on parking facilities.145
These costs do not include the costs of parking requirements, which require new developments to provide at least one parking spot per plot. In a 2014 paper, urban planning professor Donald Shoup notes that, in suburban Seattle, the “parking requirements force developers to spend between $10,000 and $14,000 per dwelling to provide unused parking spaces.”146 Unfortunately, we cannot find a systematic way for estimating these costs, and so we omit them from our subsidy calculations.
Driving Expenditures Usually Exceed Driving Revenues
In 2022, driving expenditures exceeded driving revenues by $7.3 billion. The 2022 balance was not an aberration: from 2012 to 2022, driving expenditures usually exceeded driving revenues by $2 to $20 billion. Driving revenues exceeded driving expenditures in only three of the 10 years examined.
Driving subsidies are significantly lower than subsidies for other forms of transportation. In 2022, driving revenues covered 96 percent of all driving expenditures. As Figure A7 shows, net driving subsidies have occurred during most recent years, but they have been relatively modest. From 2012 to 2022, driving revenues covered between 85 and 107 percent of all driving expenditures. This user fee coverage is much greater than for transit, whose operating revenues covered only 11 percent of expenditures in 2022.
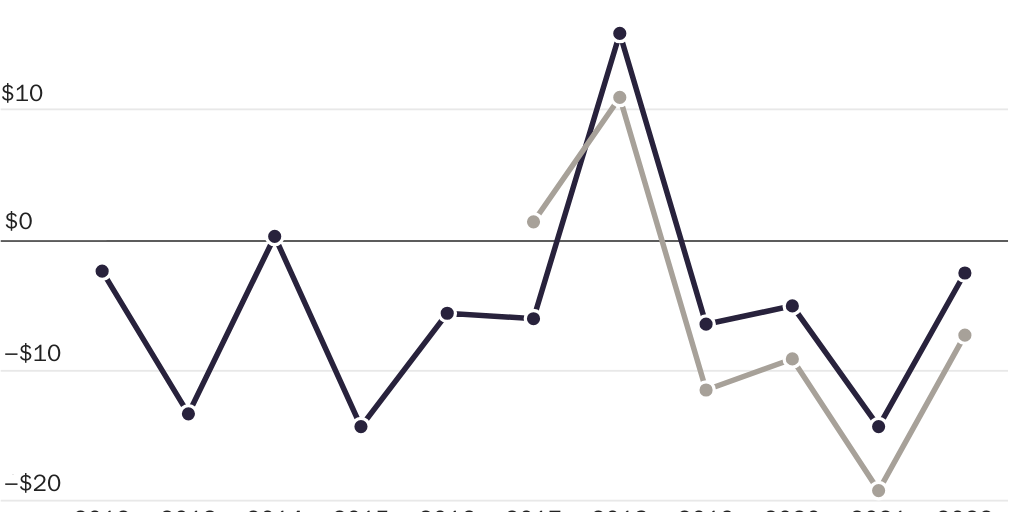
Air Travel
At a casual glance, public spending on air travel seems to be largely offset by taxes and fees borne by airlines and passengers, but there are some complexities. In federal fiscal year 2023, the federal government collected $22.5 billion in excise taxes related to air travel, while the FAA spent $24 billion, with air traffic control being the single largest expenditure.147 Although airports are generally owned by state and local governments, federal grant guidelines require them to be self-sustaining where possible, paying for operations with revenue from passenger facility charges, parking, and tenants’ rents and fees.148 In 2023, airports reporting their financial results to the FAA showed aggregate operating revenues of $28.3 billion and operating expenditures (including depreciation) of $27.5 billion, yielding net operating income of $0.8 billion.149 As Figure A8 shows, airport revenues exceeded expenses in most years since 2010, with the pandemic era being a notable exception.
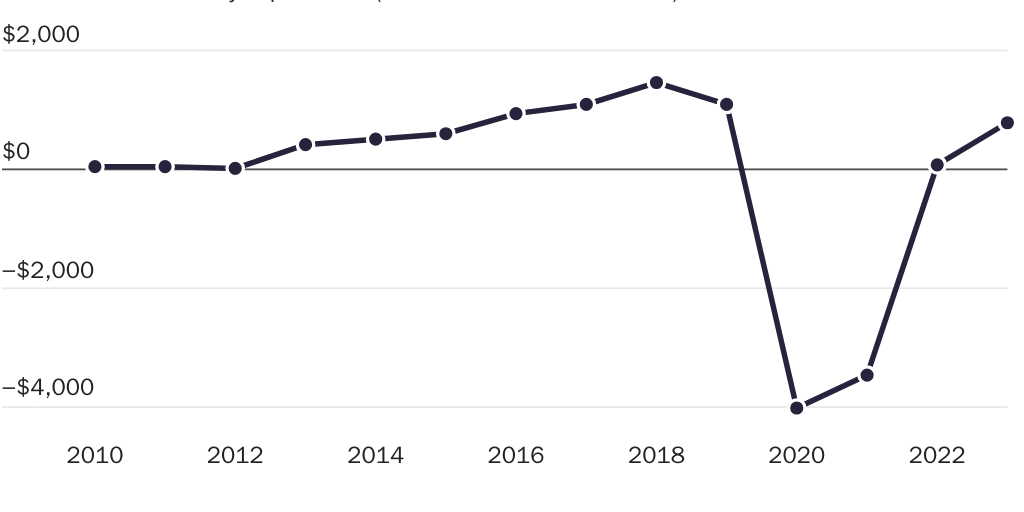
But the Transportation Security Administration’s budget comes primarily from federal appropriations. In federal FY 2023, the administration spent $6.5 billion on aviation screening, of which only $0.3 billion was offset by user fees, such as those charged for the Pre-Check program.150
US airlines are privately owned and did not receive federal funds in fiscal FY 2023. But that fiscal year was a period of high travel demand and airline profitability. As Figure A9 shows, airline profitability has been highly variable during the 21st century.
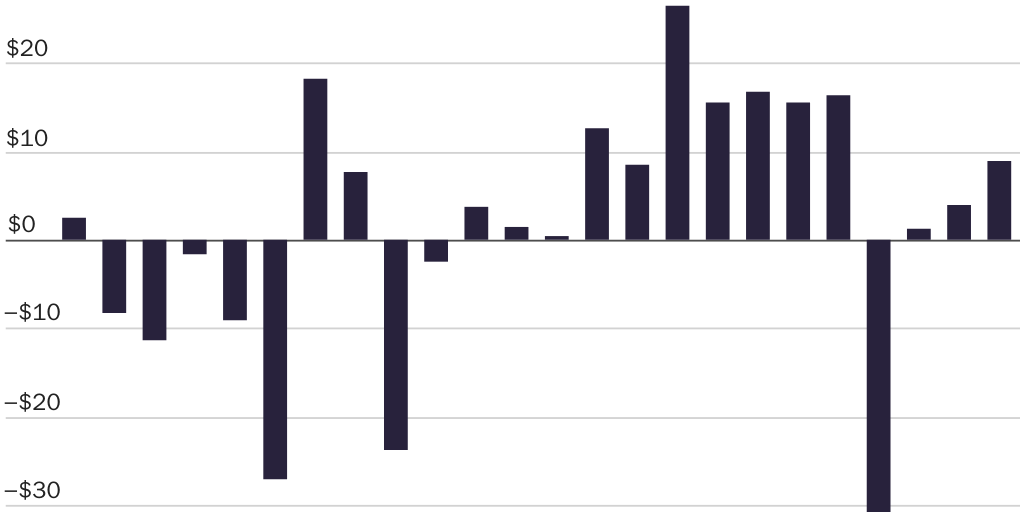
Airlines faced major headwinds after the 9/11 terrorist attacks, when energy prices spiked in 2008, and in the wake of the COVID-19 pandemic. Congress provided large bailouts to the aviation industry after 9/11 and during the pandemic.
The 2001 Air Transportation Safety and System Stabilization Act provided $5 billion in cash and $10 billion of loan guarantees to airlines. During the pandemic, airlines received $54 billion in direct federal payments as well as subsidized loans and a temporary suspension of the excise tax.151
Figure A10 shows estimates of overall government subsidies to air travel since 2007, in constant 2022 dollars. Although they were below $10 billion in most years, the large spike during COVID-19 (primarily because of emergency federal support) elevated the 17-year average to just above $10 billion.
Although these subsidies are relatively limited under normal conditions, federal lawmakers backstop the industry during difficult times, ballooning the amount of required taxpayer support.
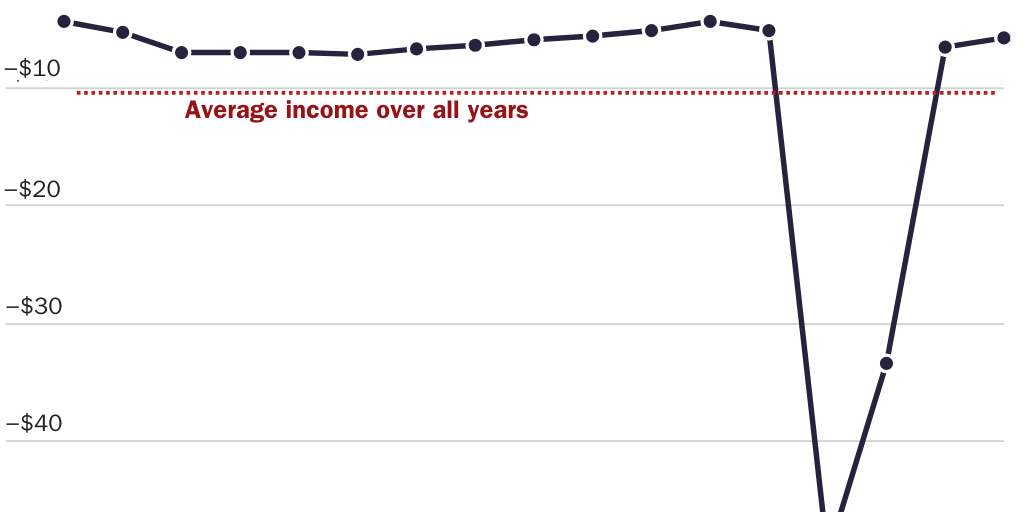
Citation
Joffe, Marc, and Krit Chanwong. “Subsidizing Transport: How Much Do Taxpayers Pay for Rail, Road, and Air Travel?,” Policy Analysis no. 988, Cato Institute, Washington, DC, January 30, 2025.

About the Authors


This work is licensed under a Creative Commons Attribution-NonCommercial-ShareAlike 4.0 International License.