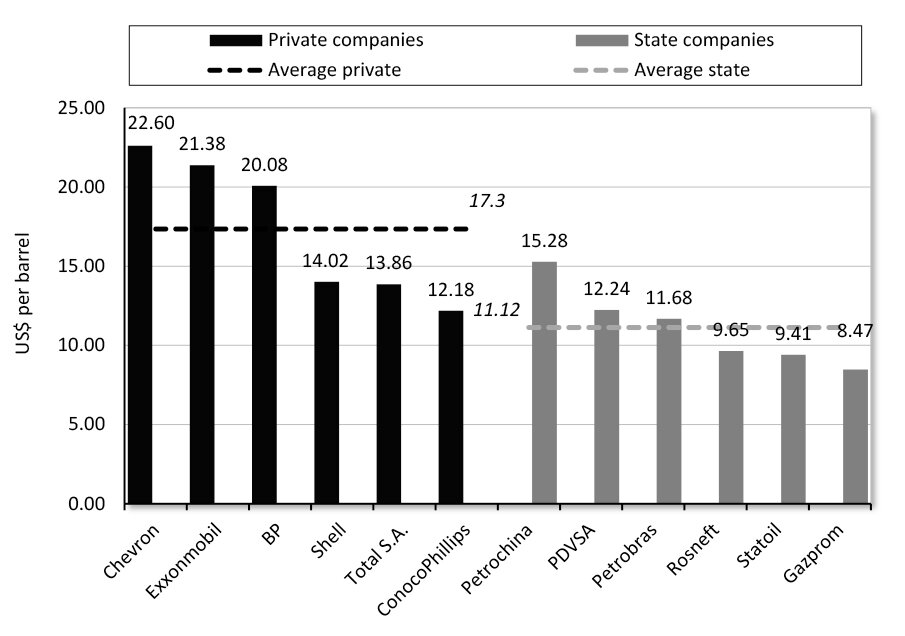
Figure 10. Net Income per Barrel of Leading Oil Companies in 2013
Source: Companies' annual reports, U.S. Energy Information Administration, author's calculations.
One way to evaluate the efficiency of various ownership models is to compare the world's largest oil companies by one key parameter that characterizes their performance: net income per barrel of oil equivalent produced (which includes combined production of both oil and gas). The average net income per barrel of the six leading privately owned oil companies in 2013 was 56 percent higher than that of the six leading state-owned oil companies ($17.35 and $11.12 per barrel, respectively, as shown in Figure 10). That number includes leading oil companies with production above 2 million barrels a day for which detailed financial reporting is available. It is worth noting that for many government-owned oil companies such reports are unavailable, specifically companies in Gulf countries.
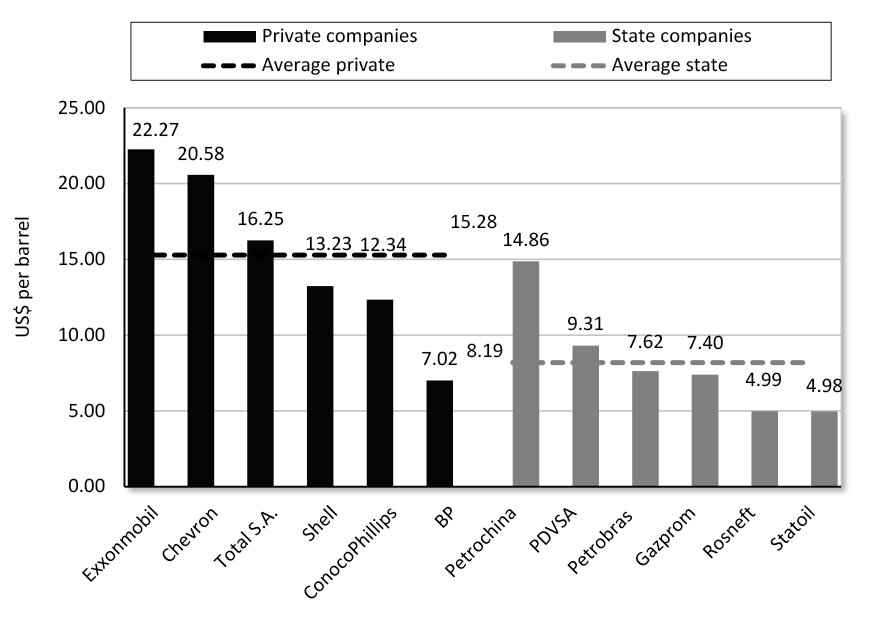
Moreover, most private international oil majors demonstrate more resilience during the collapse of oil prices (see Figure 11). Consider companies' performance in 2014, the year when Brent lost half its value — from a peak $115 per barrel to $58 per barrel by the end of the year. In 2014, the performance gap broadened even further: the net income per barrel of leading privately owned oil companies was as much as 87 percent higher than that of leading state-owned oil companies ($15.28 and $8.19 per barrel, respectively). Remarkably, three out of six of the private corporations had even higher incomes per barrel in 2014, the year of the oil price crash, than they did in 2013. These results demonstrate not simply the higher efficiency of privately owned companies but also their stronger resilience to oil price fluctuations, which is an important attribute in this industry, given significant commodity price volatility.
Figure 11. Net Income per Barrel of Leading Oil Companies in 2014
Source: Companies annual reports, U.S. Energy Information Administration, author's calculations.
Oil companies differ in various ways, including in their property structures and organizational models. Their portfolios have varying ratios between production and refining, their fields have distinct geological characteristics, and they operate under different regulatory regimes. The above-mentioned results are largely achieved in otherwise unequal circumstances as well. Most of the state-owned companies operate in their home territory, where they enjoy favorable conditions and access to more reserves with higher quality, which is not the case with most privately owned companies. The latter nonetheless manage to outperform government producers while normally facing tougher environments, which often include abrupt changes of contract terms, higher taxes, and occasional license revocations and expropriations.
Despite such telling evidence, the balance of ownership has even of late continued to shift in the direction of state oil companies. Although the peak of nationalizations of the 1960s and 1970s is long gone, the idea of resource nationalism is still going strong. The irony is that, from the available evidence, not only the income per barrel is significantly higher among private companies, but also the earnings that governments receive in taxes from the operations of private firms are often higher on a per-barrel basis than the earnings from the operations of government-owned enterprises. As demonstrated by the cases of Iran, Venezuela, and Mexico, a prolonged state monopoly of the oil industry results in its stagnation and an overall fall of government income. Mexico's Pemex is a very powerful example. Mexico's petroleum sector was nationalized in the 1930s, which makes Pemex one of the longest-surviving state oil monopolies. Overall results are telling: even under the high oil price of 2012, the company was on the verge of receiving a negative return on a barrel of oil produced (its net profit was only 10 U.S. cents per barrel). Before 2012 it had actually been operating at a loss.
At the same time, the shale revolution in the United States demonstrates the efficiency of private ownership in the energy sector. The examples of Australia and Canada also show how, on the back of a surge in hydrocarbon production, they enjoyed rapid economic growth even in the aftermath of the financial crisis of 2007–08, whereas many other member countries of the Organisation for Economic Co-operation and Development (OECD) have struggled with a recession.
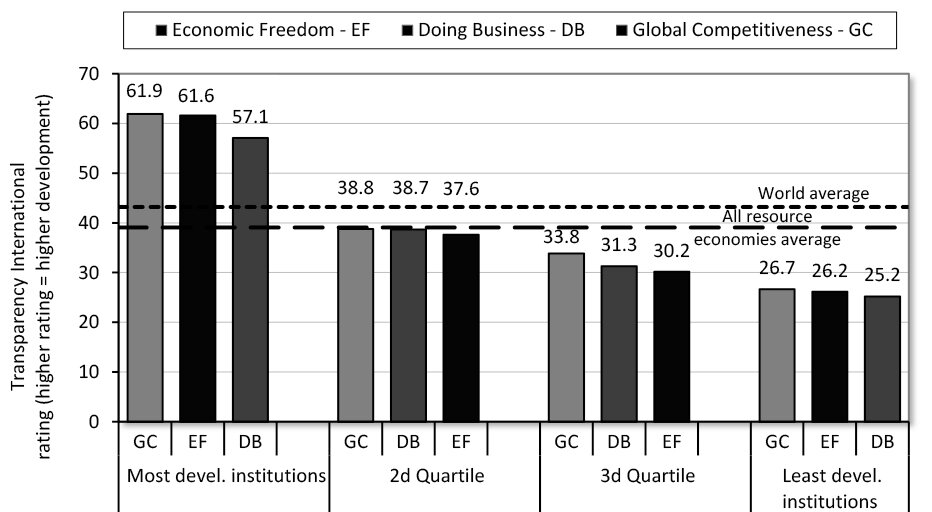
It is worth noting that although evidence argues strongly in favor of private resource production, privately owned companies are not a universal remedy. Without strong and transparent institutions, private companies are quickly corrupted through rent-seeking, as returns on grabbing outweigh returns on productive enterprise. The result is a structure that may look privately owned on the surface but is actually a system of state-affiliated interest groups and clans. That is the case in a number of petrostates with poor ratings on the corruption index.52
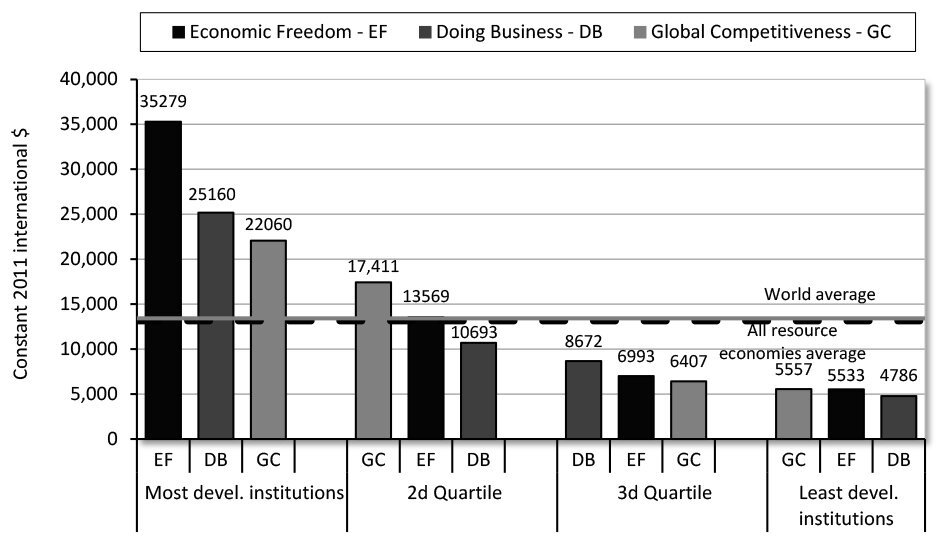
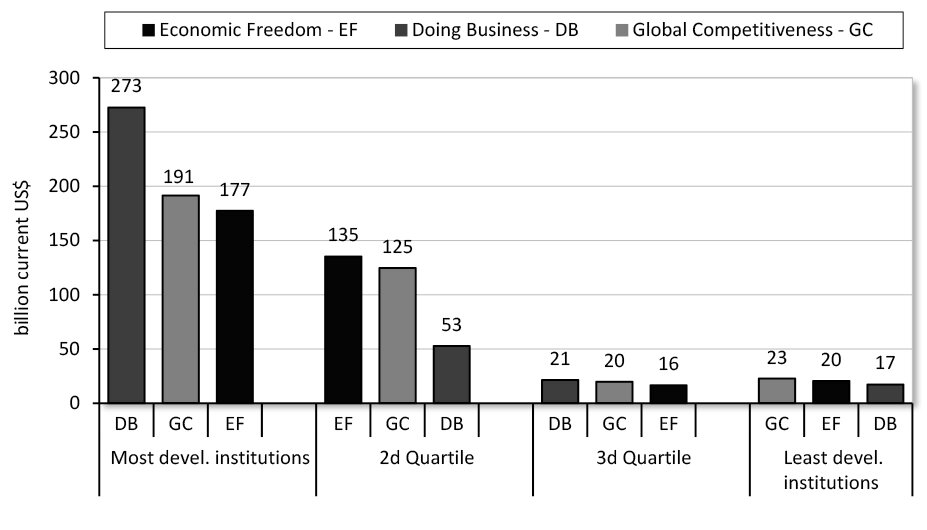
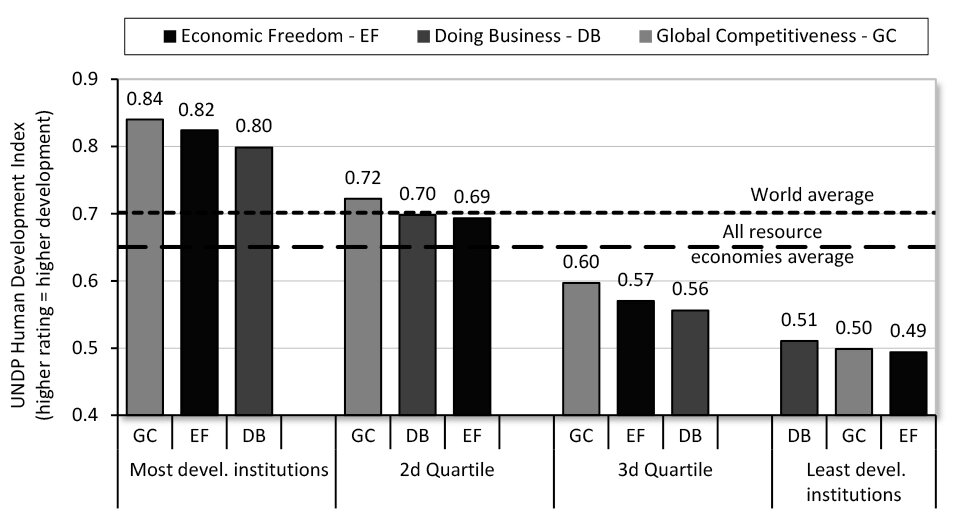
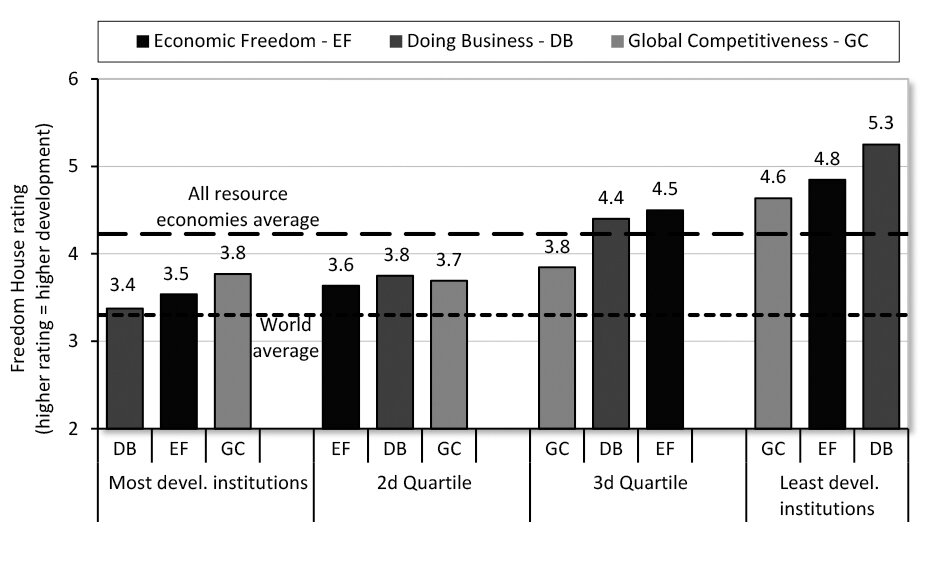
The importance of institutional quality is once again highlighted when we compare oil and gas production in resource economies grouped by their ratings in the World Bank's Doing Business report. Production volumes are only partially determined by reserves in a particular country; institutions play a crucial role. That factor is evident particularly when we recall that Iran and Venezuela are among the top three countries with hydrocarbon reserves. Both lag far behind several other countries in production because of low investment and industry mismanagement.
The superior results of private firms are not limited to oil economies; they are also evident from the experiences of countries with substantial mining industries.53 As a consequence of opening its mining sector to private investment, Indonesia was able to boost its production of gold, tin, nickel, and copper by about 50 percent in less than 10 years. The Indonesian government increased its revenues from the mining sector almost fivefold, from $700 million in 2000 to $3.4 billion in 2006, while (not coincidentally) actually reducing its overall tax and royalty rates on mining companies, from 60 percent to 45 percent.54 Armenia managed to become one of the main global producers of molybdenum after the government sold the country's largest processing complex to a private consortium of Armenian and German companies, which led to higher output. Today, 12 private companies operate functioning mines in Armenia, which account for 17 percent of industrial production and make a significant contribution to economic development.55
Finally, there is the difficult question of how to analyze the unique models that exist in the six Gulf Cooperation Council (GCC) countrie — Bahrain, Kuwait, Oman, Qatar, Saudi Arabia, and the United Arab Emirates. Their main characteristic is a combination of unmatched hydrocarbon reserves and production, and small (sometimes very small, as in Qatar or Bahrain) populations. The exception is Saudi Arabia, which has a population of 28.8 million. The overall reliance on expatriate labor is unparalleled: immigrants represent between 30 percent (in Oman and Saudi Arabia) and over 80 percent (in Qatar and the United Arab Emirates) of the population.56
Oil and gas production in GCC countries is predominantly state controlled, but it relies heavily on international service companies and highly skilled expat specialists working for Gulf national companies. GCC oil companies are arguably the most cosmopolitan in the world — even more so than international oil corporations. Although the hydrocarbon sector is state controlled, in many of the Gulf countries overall economic policies outside of the oil industry are very open and favorable to foreign investors. Gulf states generally rate highly on the Economic Freedom of the World index. At the same time, high levels of economic freedom coexist with very low ratings on civil liberties. Governments of all Gulf Arab countries are organized as traditional monarchies.
Given the proportion of foreign nationals, most of whom do not integrate into the social and cultural fabric of the host nation, it is possible to argue that GCC countries have, in fact, not one but two parallel societies that coexist and codepend on each other. Whatever one might think of the unusual economic and social arrangement that exists in the Gulf Arab states, one thing is certain: that particular system is largely an anomaly and is unlikely to be replicated elsewhere for a variety of economic, political, and cultural reasons. It would therefore be fair to look at Gulf Arab countries as outliers that need to be analyzed separately from most other resource economies.
Stabilization Funds and Alternative Solutions
The idea of stabilization funds has certainly gained popularity over the past several decades, as some countries have successfully developed such national entities. Comparing economies with and without them, the overall results moderately favor stabilization funds.
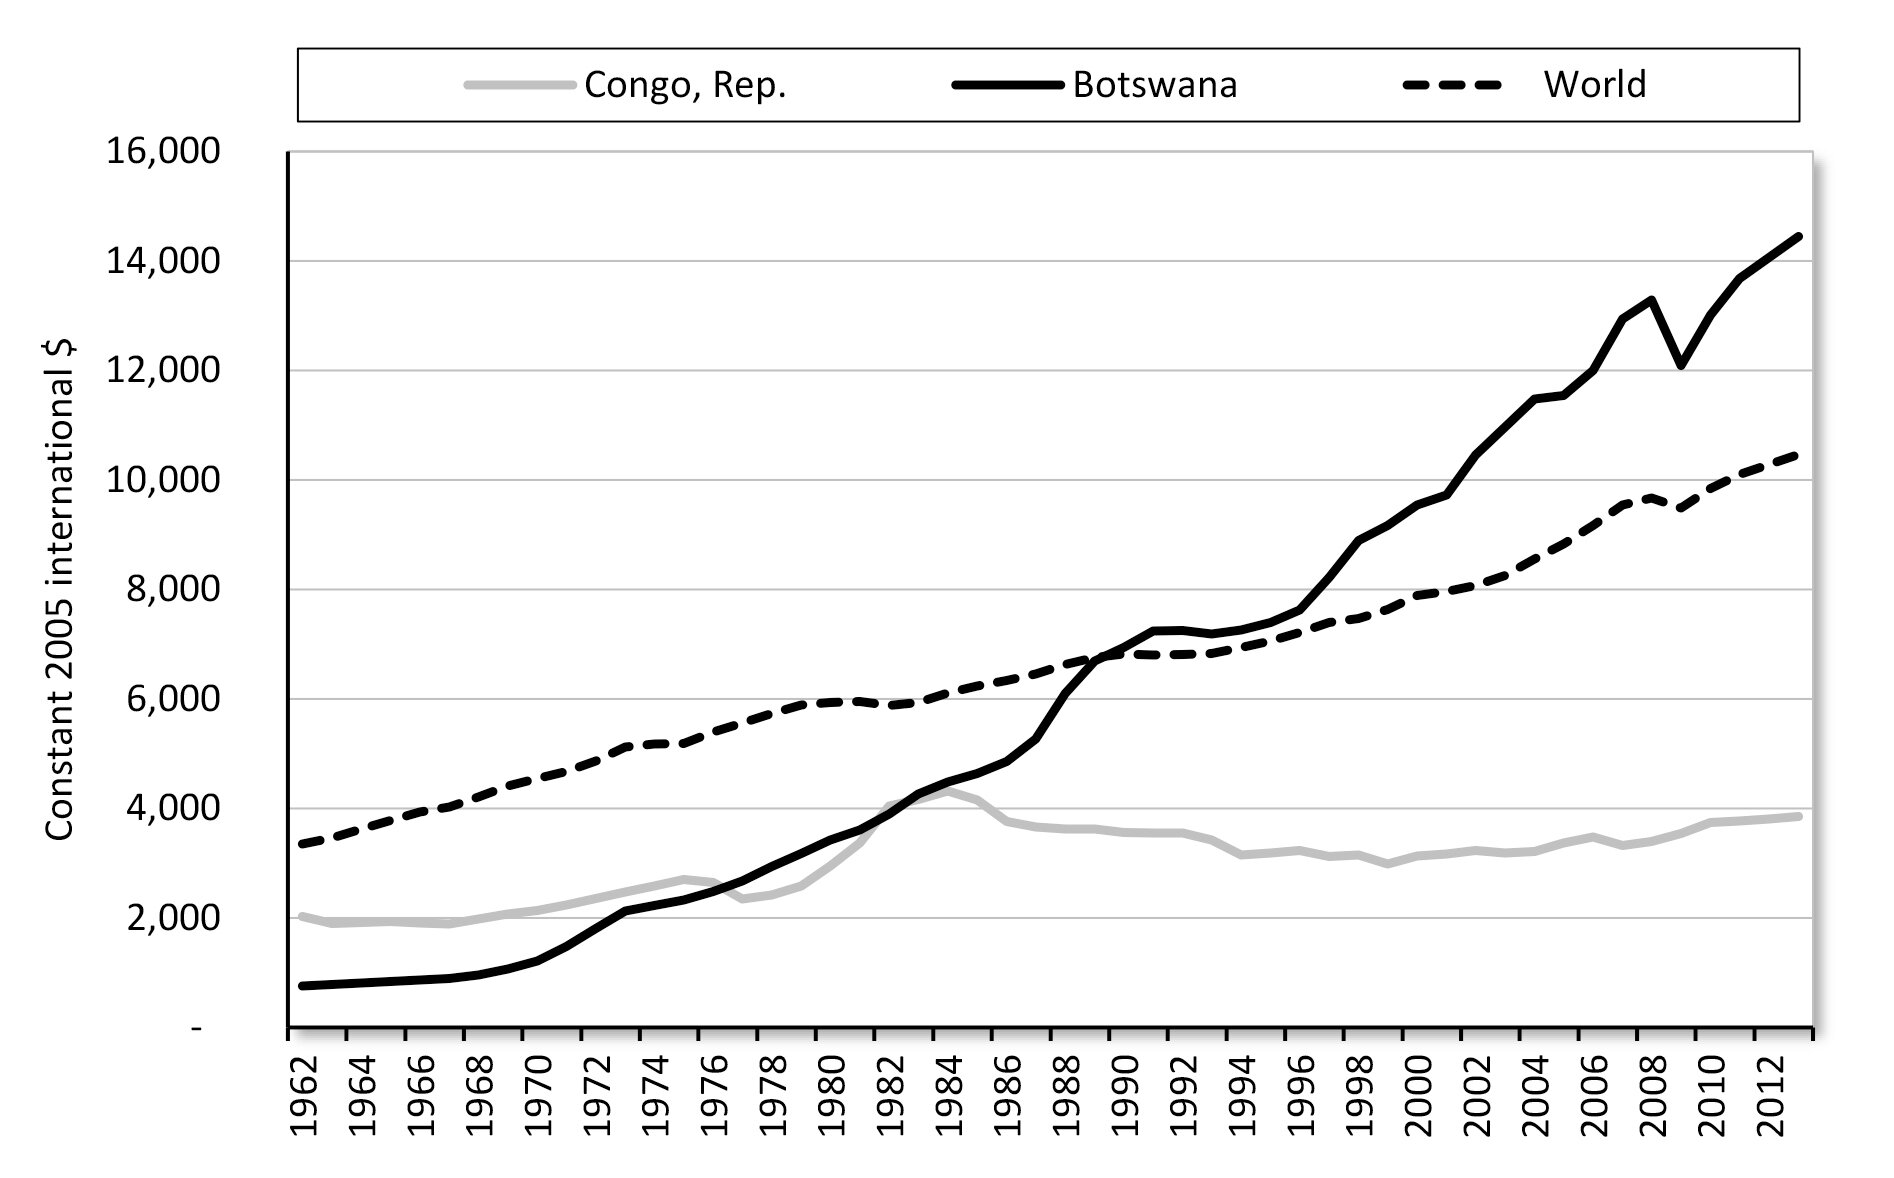
From 1966 to 1989, Botswana was the fastest-growing economy in the world, transforming itself over that period from one of the poorest states to an upper-middle-income country (its performance over half a century relative to another African mining economy, the Republic of the Congo, is shown in Figure 12). That success has largely been due to both strengthened institutions and prudent management of Botswana's diamond revenues (nearly a quarter of the world's diamond reserves are located in Botswana).
Botswana follows a strategy of fixed public spending, allowing the government to accumulate revenue surpluses during boom years. Recurrent revenue surpluses that are not spent are transferred into Botswana's Foreign Reserves Fund. By the mid-1990s, interest payments on those reserves became the largest source of Botswana's government revenue after diamond sales. Between 1976 and 2008, foreign exchange reserves grew from $75 million to $10 billion, which equaled 33 months of import cover. Those reserves mitigate the impact of price volatility, allowing the government to maintain public spending when commodity markets turn bearish.
In Norway, a large part of the state income from oil and gas exports is diverted into the Government Pension Fund of Norway. It is the second-largest sovereign fund in the world, only after the Abu Dhabi Investment Authority. The overall value of its assets is 1.5 times Norwegian GDP, and it controls over 1 percent of all publicly traded shares in the world. Stabilization and sovereign funds have significantly aided public administration in a diversity of countries, such as Malaysia and Oman. In Russia, the Stabilization Fund helped the country weather the storm of the financial crisis and the oil price drop in 2008–09 by providing an emergency reserve for the economy.
Figure 12. Real GDP per Capita (PPP) in Two African Resource Economies since 1962
Source: World Bank Open Data, author's calculations,
http://data.worldbank.org/topic/economy-and-growth.
In summary, governments usually allocate some part of receipts from mineral exports to a special fund in order to alleviate the Dutch disease and to save for a rainy day. Stabilization funds, if designed and run properly, can serve the following purposes:
- Sterilize revenue inflows57 when commodity prices are high, to mitigate upward pressure on the national currency exchange rate, which is one of the main effects of the Dutch disease;
- Manage price volatility risks and maintain public spending levels during downturns; and
- Introduce some budgetary discipline by capping government spending.
Whether a stabilization fund achieves those goals depends on whether it is sufficiently insulated from political pressures. With weak institutions, a stabilization fund will simply become another vehicle for redistributing mineral revenues into the hands of political cronies.
Assuming the fund operates independently of political pressures, what should be done with the accumulated reserves? The most common option for a stabilization fund is to invest in the global stock and bond market. That strategy is often politically inconvenient for the government, because it can be perceived as unpatriotic. Despite that, it does have some advantages. It can be a partial solution to the Dutch disease by sterilizing the inflow of foreign currency into the domestic economy during commodity price booms. Some people argue that such a strategy is also more detached from domestic interest groups and thus less prone to rent-seeking.
If implemented properly with the right level of self-discipline, stabilization funds may be a useful economic policy tool. But they are not a panacea. As outlined earlier, the Dutch disease and the negative impact of price volatility are essentially institutional rather than purely economic problems. Thus, both should have an institutional solution. A freer economic environment with equal opportunities stimulates private investment, entrepreneurial activity, and innovation in nonresource industries. As to price volatility, vulnerability to price fluctuations is reduced, because a freer economy relies less on redistribution and payouts by the government. Private-sector firms are better at dealing with the effects of commodity price volatility than state-run corporations.
Stabilization funds that invest in global market — assuming they attract qualified fund managers and stay as far from politics as possible — can be effective if implemented on a limited scale. Whether they are an optimal way to manage government income is still an open question. One might argue that, for economies that depend almost entirely on exports of a single mineral commodity, such as Oman or Botswana, it is important to maintain sizable reserves in order to manage public spending when prices are low. For those countries, having a limited emergency fund would be a good idea.
But where is the limit? What happens when reserves in the fund continue to grow on the back of high prices during commodity price booms? Should the government reduce (or even suspend) the amount of money diverted into the fund after it reaches a certain level? These are not rhetorical questions. If the government manages to maintain a balanced budget while more and more money flows into the sovereign fund, it simply means that the state extracts from the economy far more than is necessary to fulfill its obligations.
The question then is, should the government continue to take that much from the economy if it is not even sure what to do with the money? Would it not be fairer and more efficient if the surplus money was left in the economy when commodity prices are high? Some would argue that, in a resource-dependent economy, there would not be enough domestic businesses to invest in, and thus people and companies would choose to take their increased incomes abroad. But even if that were the case, it is no different from what the government is doing through its sovereign fund anyway. Put simply, do people really need the government to manage their money? As abstract as these questions might seem during a period of low oil prices, they expose some important dilemmas concerning the role and scope of government in a resource economy.
Several economists have suggested that resource economies should distribute part of their natural resource revenues directly to their citizens.58 In the U.S. state of Alaska, that takes the form of a special oil dividend, known as the Permanent Fund Dividend, which has been paid to all residents of Alaska since 1983. In 2015 each citizen received $2,072. The dividend is paid once a year from the Alaska Permanent Fund, a sovereign entity that accumulates a share of government revenues from the oil industry. The fund has grown from an initial $734,000 in 1977 to $54.5 billion in market value of its assets in 2016.59
The idea of a citizen's dividend can be traced back to the pamphlet Agrarian Justice written in 1795 by Thomas Paine, an influential political thinker during the American Revolution. Such an idea takes the common notion that natural resources in the ground "belong to the people" back to its actual meaning. If mineral wealth belongs to every citizen in the country, then one might argue that everyone has a claim to an equal share of that wealth. What share of export revenues the government should be allowed to retain is subject to a separate discussion, as is the way such a transfer would be administered. In practical terms, a special "oil account" could be opened for every citizen in an oil-producing country or perhaps merged with individual pension accounts. Although this idea may seem farfetched and has not yet gained broad support, it would be unfair to rule it out. In the future, with the increasing automation of even the intellectual workforce, a citizens' dividend might become more appealing.
The section looks at the institutional conditions for major innovations in extractive industries, such as the shale revolution and breakthroughs in the development of other unconventional resources. It then briefly summarizes the experience of four countrie — Australia, Canada, Chile, and Norway — and looks at particular policies that allowed them to achieve more rapid growth and higher levels of social development compared with peer countries with resource-based economies. Finally, this section looks at the experiences of oil-exporting countries that managed to maintain high growth rates during the crude price drop in the 1980s.
The Shale Revolution: Its Causes and Implications
Since July 2014 the rapid oil price decrease has prompted strong interest in the changing dynamics of the global hydrocarbon market, specifically how it is influenced by technological breakthroughs in developing unconventional hydrocarbons. Most observers believe that one of the main reasons for the drop in oil prices was the rapid increase of U.S. oil production, which in 2014 reached the level of the other two biggest producers, Russia and Saudi Arabia (and even surpassed it for several months). Greater reliance on domestic production decreases U.S. demand for imported oil and hence puts downward pressure on the oil price worldwide. In addition, the rapid increase in domestic shale gas production accompanied by a drop in domestic gas prices has increased the share of gas in the overall energy mix in the United States, thus further strengthening American energy independence.
All in all, the shale revolution in the United States is having a major effect on global energy markets. Consequently, many industry analysts have drawn their attention to the commercial, technological, institutional, and regulatory aspects of hydrocarbon production from shale deposits. As shale gas and oil technologies gradually spread worldwide, the likelihood of their having an even stronger effect on the global energy balance in the not so distant future increases.
One of the characteristics of shale deposits is the small size of their wells. Drilling expenses are significantly lower than those of big wells on traditional deposits. Simultaneously, the production cycle of shale wells is relatively short. When oil prices decrease below production costs, it is possible to quickly extract oil on the existing wells and stop drilling afterward until the prices rise again. The volume of production can then be increased just as quickly by drilling new wells. That increased rate of production is not accompanied by considerable capital expenses, which is a big advantage under conditions of price volatility.
That factor directly affects the structure of the shale industry. In one sense, what is happening with shale reserves is conceptually closer to the Silicon Valley model and venture capitalism than traditional oil and gas with its multibillion dollar projects, which only larger, vertically integrated companies can carry out. As a result, the shale revolution's main driving force comes from junior independent innovation companies, which fiercely compete with one another.
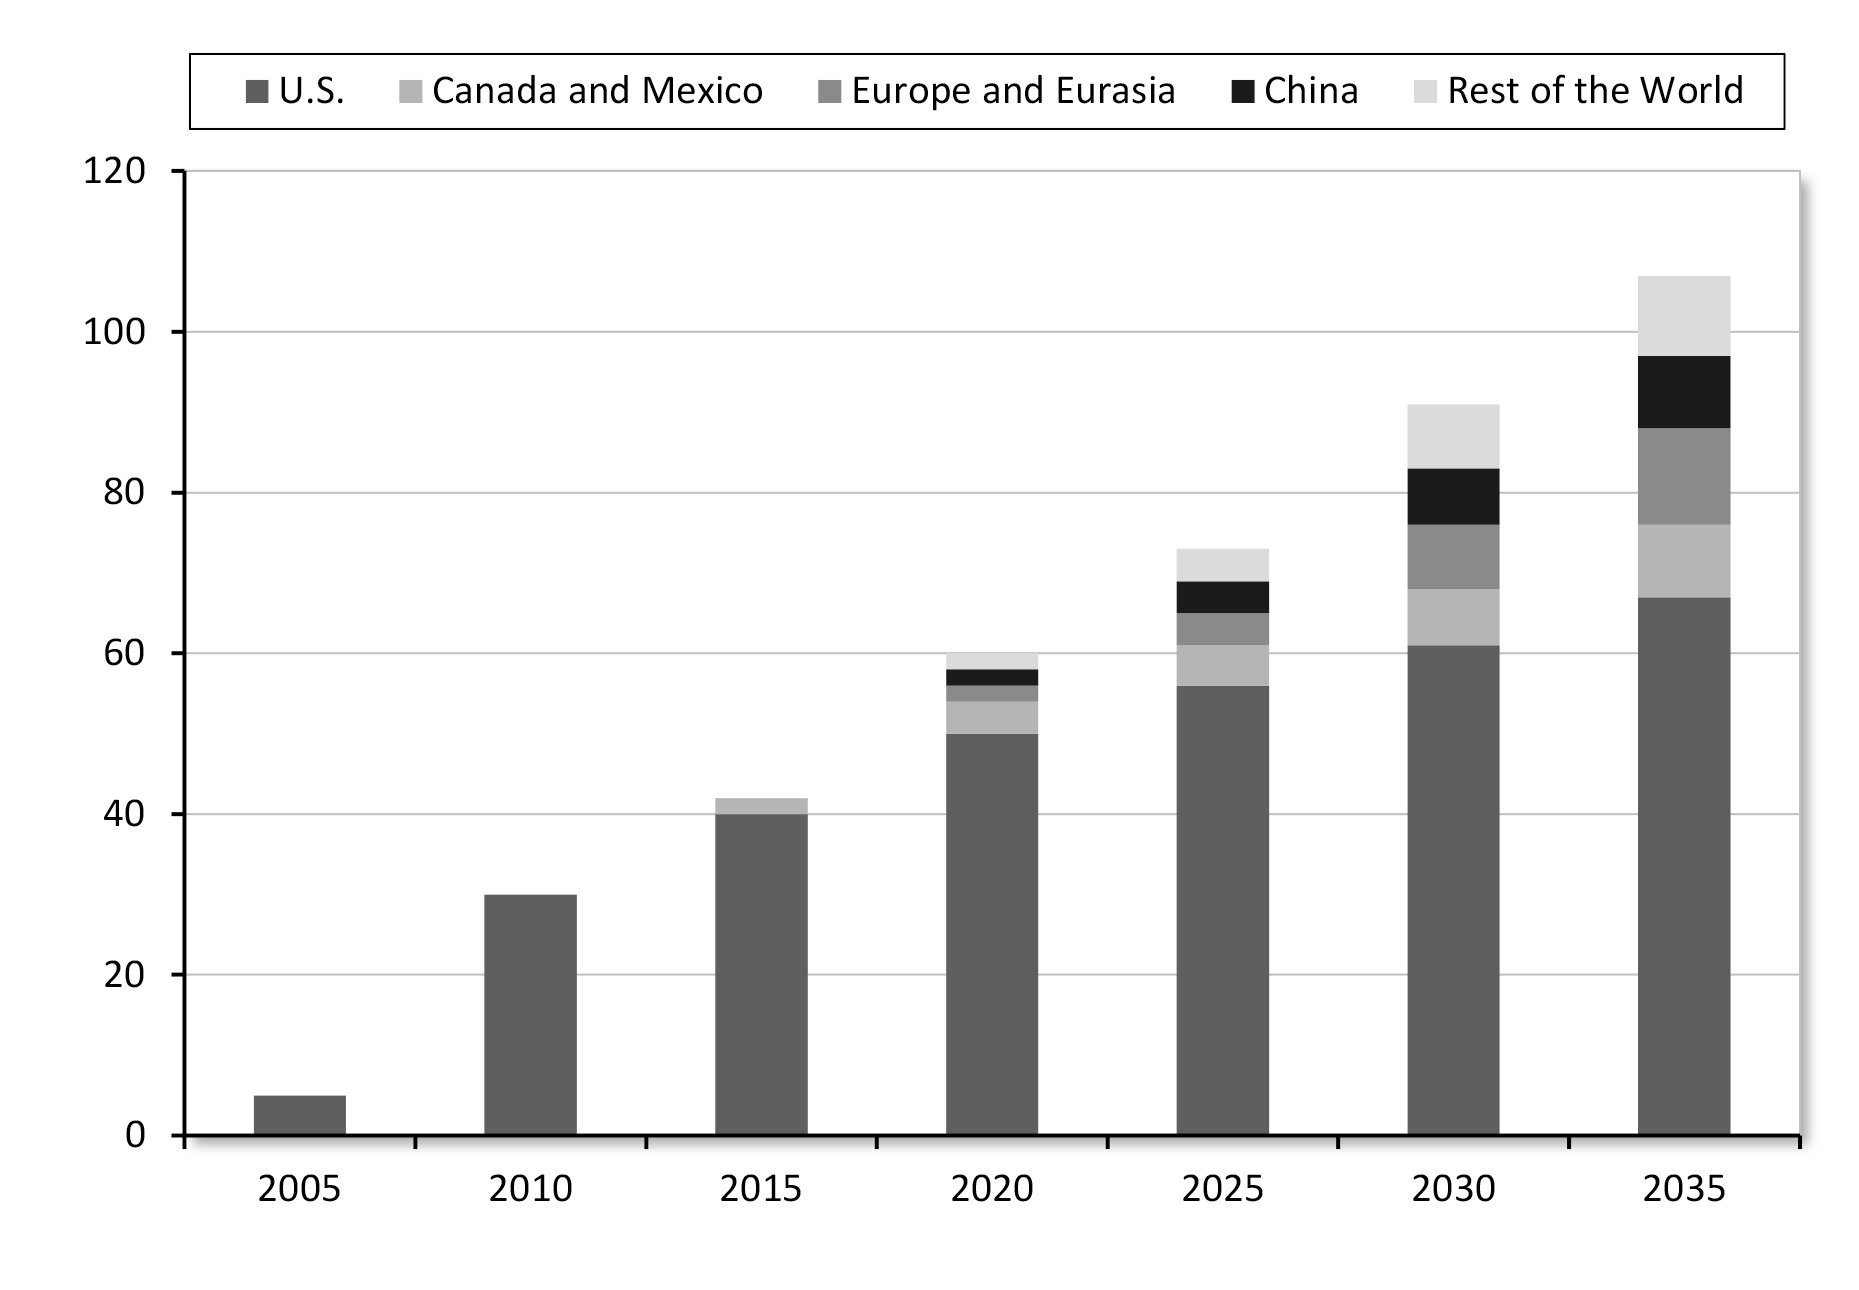
Extractive industries have seen growth and innovation in countries around the world, due in no small part to favorable economic policies. The shale revolution in the United States is one of the most powerful examples. It started with the economic success of the Barnett Shale play in Texas in 1997. In 2000 shale gas provided only 1 percent of U.S. natural gas production; by 2012, it reached over 25 percent. The U.S. Energy Information Administration forecasts that by 2035, 46 percent of the U.S. natural gas supply will come from shale gas. Furthermore, by 2017, the United States is expected to become a net exporter of natural gas because of growing shale gas production. The success of new hydrocarbon technology stretches beyond the United States. Innovation in shale oil and gas was accompanied by a breakthrough in heavy crude production from oil sands, specifically in Canada. As a result, in 2012, the United States and Canada accounted for 25 percent of global natural gas production and 14 percent of oil production.60
Figure 13. World Resources of Technically Recoverable Shale Gas, in Billions of Cubic Feet
Source: U.S. Energy Information Administration,
https://www.eia.gov/analysis/studies/worldshalegas/.
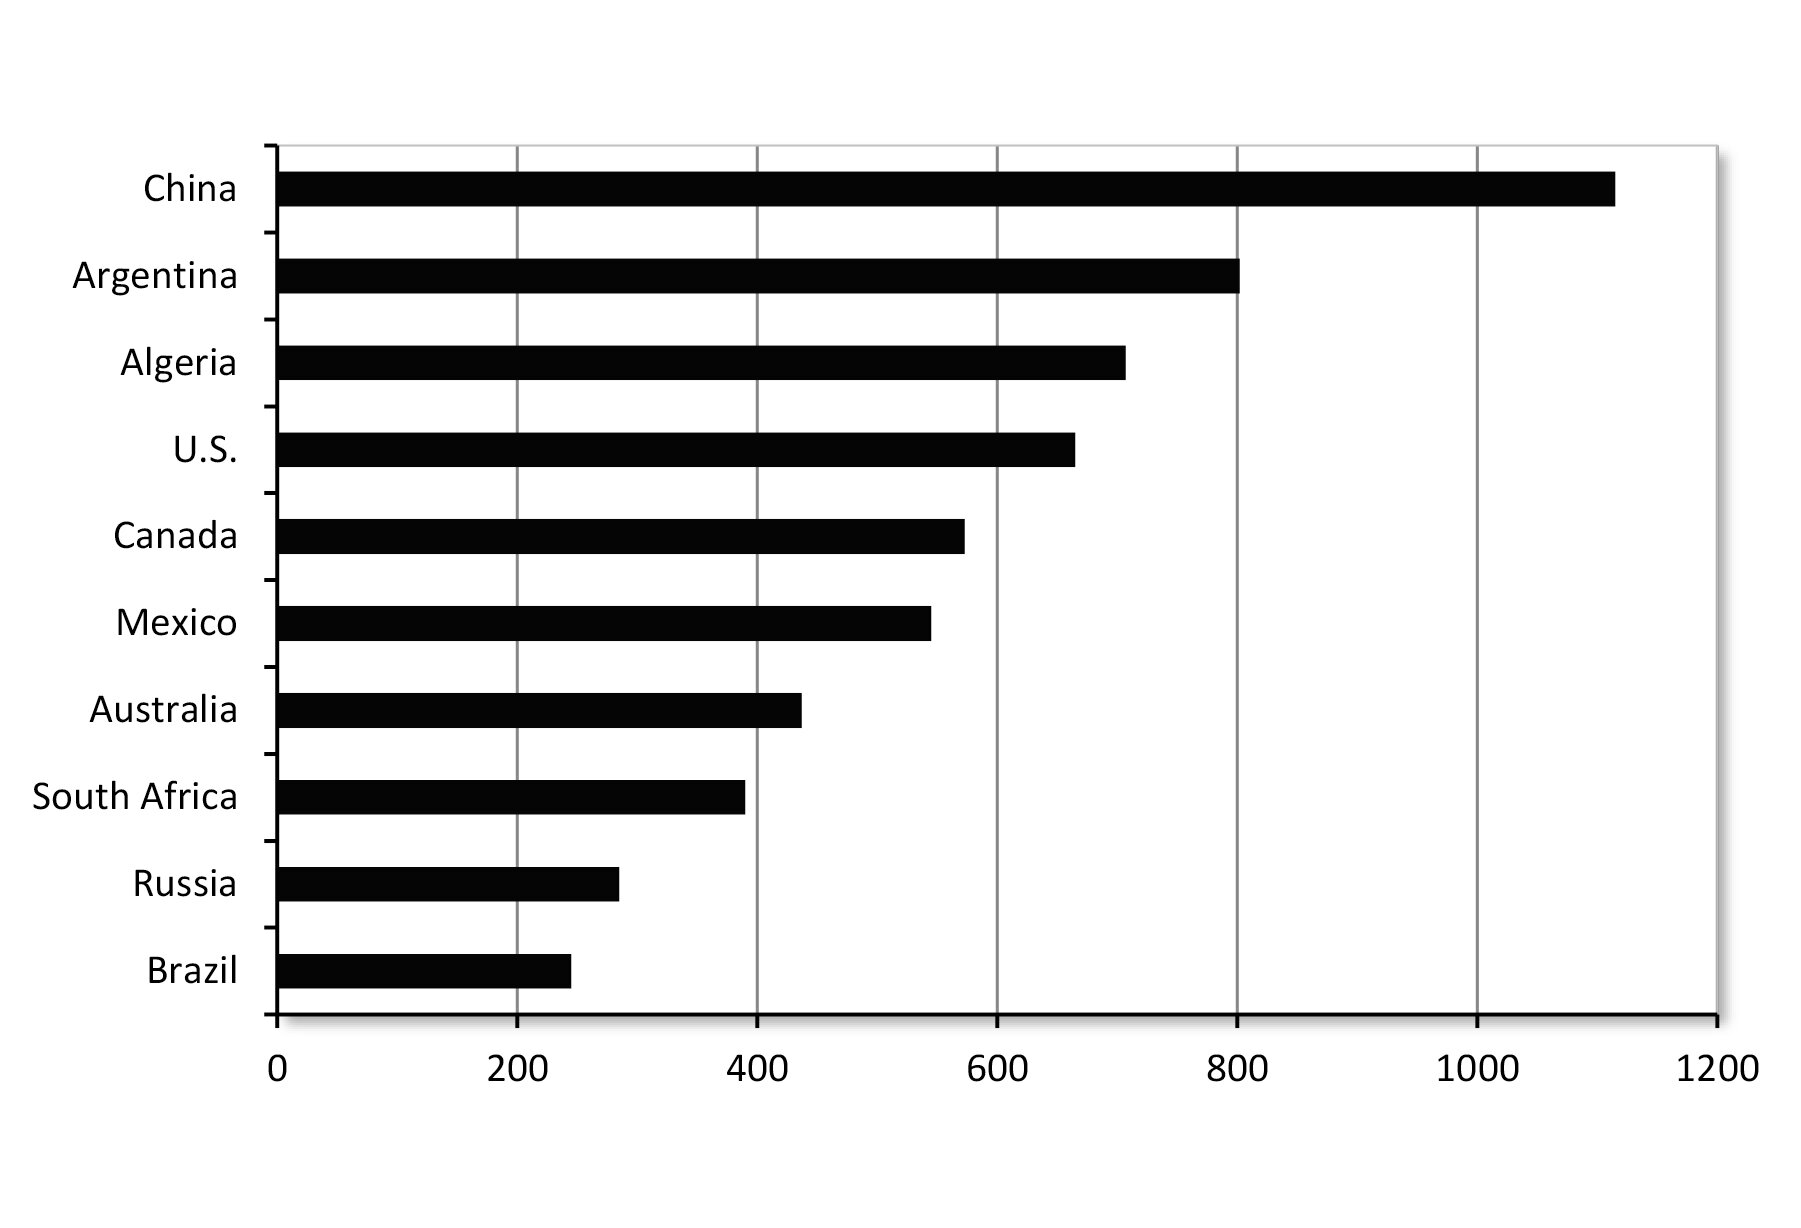
As shown in Figure 13, the United States ranks fourth in world shale gas resources. At the same time, according to the BP Energy Outlook,61 virtually all current shale gas comes from the United States. Other regions are expected to start producing shale gas in the future, but the United States will still produce the bulk of it for quite some time (Figure 14). The shale revolution supports the hypothesis that the development of a certain commodity depends more on institutions than on physical resources in the ground.
Figure 14. Forecast of World Shale Gas Production, in Billions of Cubic Feet per Day
Source: BP Energy Outlook 2035, January 2014,
http://www.bp.com/content/dam/bp/pdf/energy-economics/energy-outlook-2016/bp-energy-outlook-2014.pdf.
Other countries are catching up. China is estimated to have the largest shale gas reserves in the world and is expected to be the global center of shale gas development outside North America. By 2030, shale could account for 20 percent of total Chinese gas production. And visible progress is being made in developing other unconventional hydrocarbons, such as coalbed methane.
Breakthroughs in shale oil and shale gas technologies are having a strong influence on the broader global energy landscape. First, gas price formulas are increasingly delinked from oil prices. That is an important change in the gas market, reflecting the growing supply of unconventional gas. Second, such breakthroughs are having a strong influence on the geopolitics of global energy, as the balance of hydrocarbon production is shifting toward countries that were for a long time viewed as being dependent on foreign oil and gas.62
The emergence of new centers of production, such as the United States, Canada, Australia, and potentially China, is seriously undermining the influence of OPEC as a global oil cartel, whereas traditional importers are becoming more energy independent. OPEC's weight in global energy is further undermined by the growing significance of gas as a global fuel. The International Energy Agency predicts that by 2030, a quarter of global energy will be produced from ga — the same share as oil.63
The consequences of those developments go beyond the energy sector itself. The increasing share of gas in fuel consumption is already having a profound effect on the environmental debate. The burning of natural gas emits half the greenhouse gases that coal does, and 30 percent less than oil. For those politicians and nongovernmental organization activists who have argued in favor of curbing greenhouse gas emissions, natural gas may become a game changer. Tellingly, as gas has partially replaced other fuels in the United States (which did not sign the Kyoto Protocol, to the dismay of many eco-campaigners), in 2012 U.S. carbon dioxide emissions dropped to their lowest level in 20 years, whereas European countries that signed the Kyoto Protocol are failing to meet their emissions targets. As a result, a growing number of environmentalists are fine-tuning their position from anti–fossil fuel to "pro-gas."
The BP Energy Outlook64 estimates that 200 trillion cubic meters of technically recoverable shale gas and 240 billion barrels of shale oil exist worldwide. By 2030, their development will account for over 20 percent of the increase in the world's hydrocarbon supply. What brought about such a significant shift in the global energy landscape? On a technical level, a breakthrough in three key technologies made it possible: horizontal drilling, hydraulic fracturing, and advances in seismic data collection and its digital interpretation.
Shale oil and gas are different from conventional resources only in the way they are trapped in the ground: they are diffuse rather than concentrated in isolated wells. Horizontal drilling is required to identify concentrations of shale oil and gas, and then the rock needs to be fractured with water to release the crude or gas so that it can flow to the surface. Most shale deposits had been identified long before their development became economically feasible. Technological progress allowed companies to book those deposits as commercial reserves and start production.
An important externality of the shale boom is that it helped undermine a common prejudice against extractive industries as being insufficiently innovative. Politicians who are eager to be viewed as "cutting-edge" have often repeated the idea that to modernize and enter the postindustrial era, a country needs to shift away from mineral production. That outdated attitude is quickly becoming history. The shale revolution is in essence a technological breakthrough of the highest caliber.
The Role of Strong Institutions and Competition in Extending the Frontiers of Exploration
One aspect of the shale revolution and breakthroughs in other unconventional hydrocarbons gets much less attention in the media than geopolitical, technical, or environmental issues: What were the conditions that allowed the technological innovation to happen? It is no coincidence that advances in unconventional hydrocarbons took place in countries that are in the top of the Economic Freedom of the World rating. Those advances were also helped by other conditions, such as high gas prices in the 2000s. But the institutional component — the combination of secure property rights, a favorable tax regime, transparent and efficient regulation, and minimal red tape — was the decisive factor. The institutional conditions that allowed the shale revolution to happen should be carefully studied by policymakers in other countries, especially in resource economies.
It is also important to point out that the United States, Canada, and Australia have extractive sectors with multiple private companies, ranging from small exploration firms to vertically integrated multinationals. It was not one corporation alone, but several — including Chevron, Shell, Devon, Talisman Energy, Chesapeake, and Range Resource — that developed technologies for the commercial extraction of shale gas. They were all in tough competition for limited capital and human resources, which made them focus on the most efficient technologies. It is not surprising then that despite the world's largest shale gas reserves, the shale gas boom did not start in China, in which the sector is dominated by government oil and gas companies.
In December 2014, the Russian Academy of National Economy and Public Administration's Centre for Resource Economics published the findings of its research into the role of institutions and companies' property structure in the shale gas revolution in the United States.65 The results of the econometric modeling demonstrate the following: institutional parameters, such as competition and private ownership, had a positive effect on the production of unconventional hydrocarbons, including shale gas. Because of extensive innovative development and strong institutions, the United States transitioned from almost exclusively conventional gas production to unconventional production.
In 2012 the United States had about 13,000 small oil companies, which accounted for more than 54 percent of hydrocarbon production. Small companies are currently providing much of the increase in U.S. hydrocarbon production. Most of them produce deep in the continent from hard-to-recover and residual reserves of marginal wells or small deposits. A strong positive dependence exists between shale oil and gas production and independent companies' investment in research and development.
It is a well-known fact that the United States is a leader in shale oil production today, but few people know that it is also a leader in oil production on the Arctic Shelf. As with shale oil, the key determinants for success in developing the Beaufort Sea deposits in U.S. Arctic waters are an effective and stable tax system, guarantees of property rights, and the absence of a state monopoly. Like the shale revolution, the biggest breakthroughs in Arctic offshore production are not correlated with amounts of resources but with institutional quality. Tellingly, the United States and Norway (two major countries that operate on the shelf beyond the Arctic Circle) are significantly ahead of Russia in production volumes. At the same time, according to estimates, Russia has 41 percent of all technically extractable global resources of Arctic oil and 70 percent of the gas.66
Although multiple comparisons demonstrate that private oil companies largely outperform government-owned companies, the latter vary significantly in their performance. Within the right policy framework, some state corporations achieve impressive results. What matters are the way a particular company is organized and the overall institutional environment. State-owned firms that rely on strong and lasting partnerships with international companies tend to perform much better than those that develop in autarchy. The best example is Malaysia's Petronas. Petronas is state owned and for decades has relied on alliances with foreign companies to effectively run the Malaysian oil and gas sector and rapidly grow its business both domestically and overseas.
The Malaysian model of the extractive industries could be described as a symbiosis between state and private companies. Although the government maintains 100 percent ownership of Petronas, the overall government share in oil and gas production is about 60 percent. The remainder is divided among various international and national oil companies, such as Shell, ExxonMobil, Murphy Oil, and Nippon Oil, all of which operate through production-sharing agreements with Petronas.
International alliances have allowed Malaysia to keep an edge in the global market by, for example, becoming a leading exporter of liquefied natural gas (LNG). Malaysia's strategy could be viewed as "clever" diversification; instead of trying to run away from its resource base and its competitive advantage, the country fine-tuned its economy to developments in the global market. As oil reserves started to decline, Malaysia commercialized its natural gas resources by joining the LNG market and becoming one of the leading exporters of LNG.
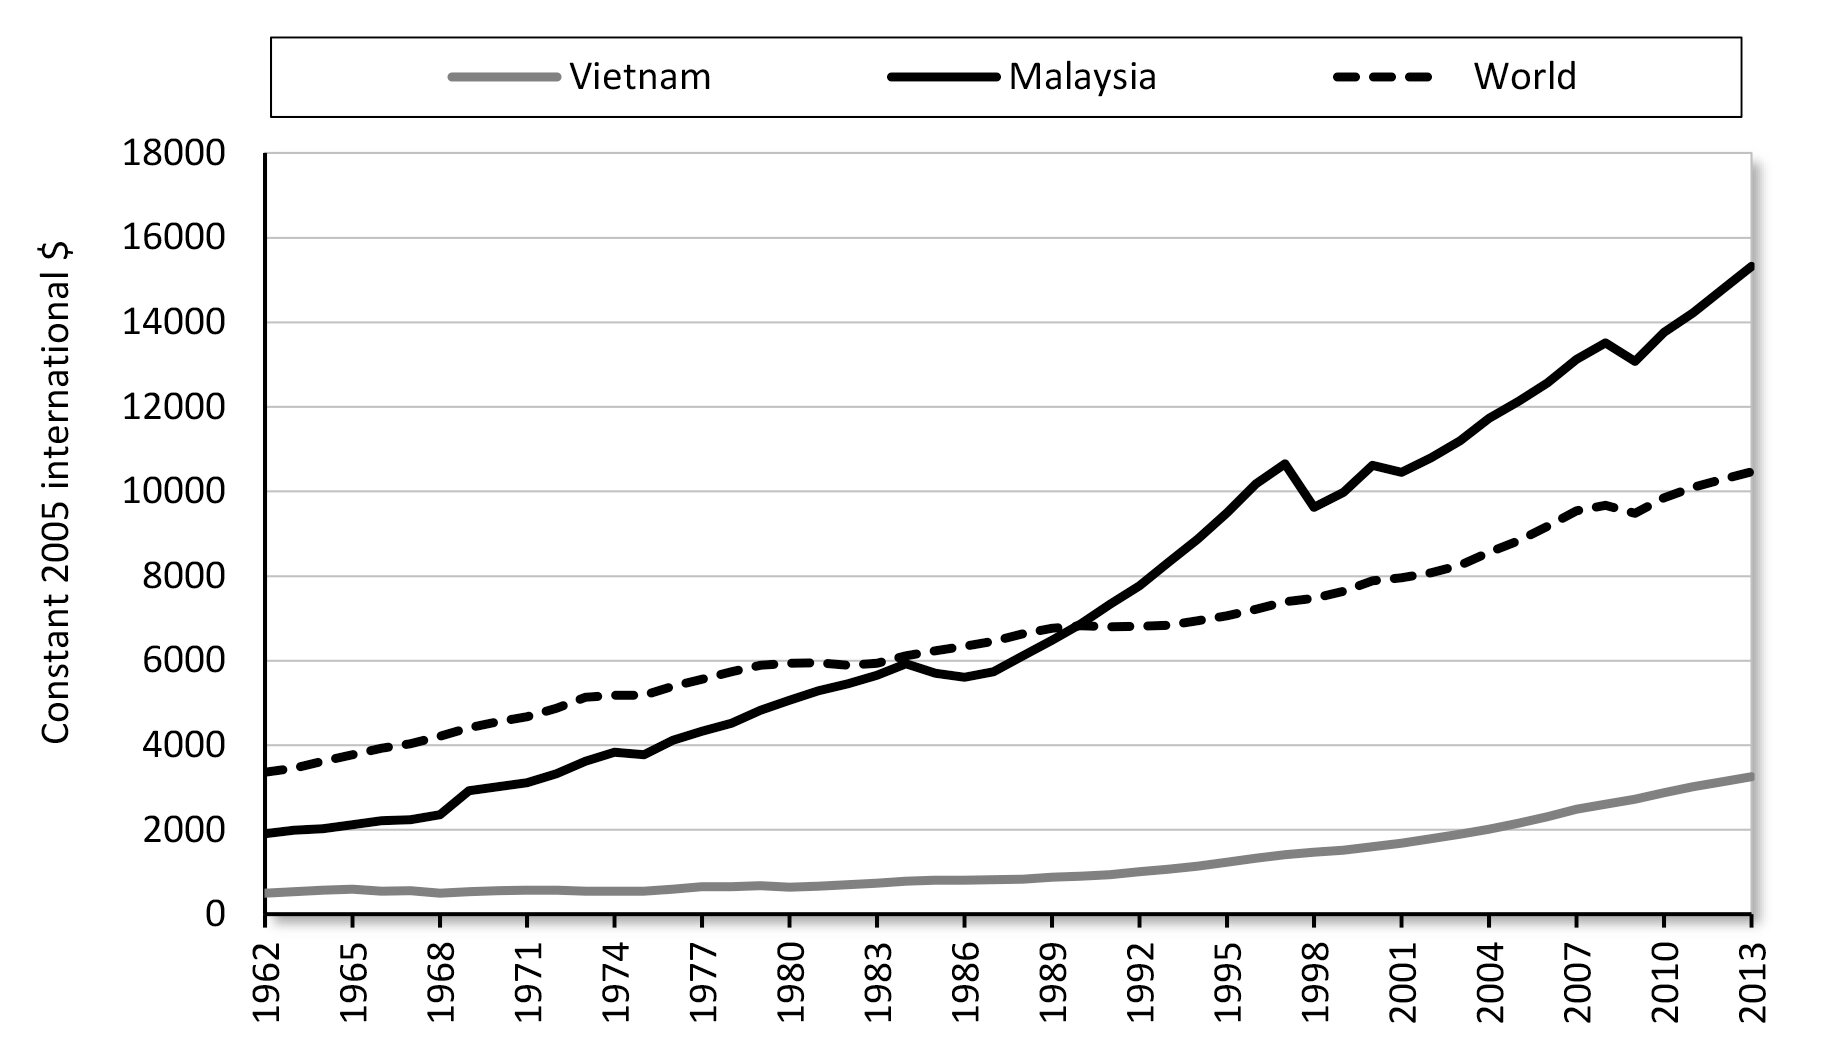
Another stage of diversification started when Petronas went global. Petronas's overseas projects account for 36 percent of its total hydrocarbon production. Petronas operates in over 30 countries, producing oil from about 50 projects in Asia, the Middle East, Africa, and Central Asia, more than half of which it operates. Bringing about strong international opportunities allowed Petronas to effectively manage the lowering of its production levels in mature areas of Malaysia. Today, industry experts agree that Petronas is the most efficient national oil company.67 Currently, Malaysia is already one of the most prosperous countries in Asia, and it qualifies as a so-called newly industrialized economy (its performance over half a century relative to another Asian oil exporting economy, Vietnam, is shown in Figure 15). Although in recent years a major corruption scandal cast a shadow on the Malaysian system, in previous years many had seen it as a role model for other Asian economies. It is a notable example of relative success in a non-OECD country without a preexisting set of Western-style institutions.
Figure 15. Real GDP per Capita (PPP) in Two Oil and Gas Exporting Economies since 1962
Source: World Bank Open Data, author's calculations,
http://data.worldbank.org/topic/economy-and-growth.
Four Resource-Exporting Countries with High Levels of Economic and Social Development
This section compares experiences of four resource economies: Australia, Canada, Chile, and Norway. It provides a brief overview of particular policies that allowed them to achieve high levels of social and economic development. These overviews are based on situations that preceded the metal and oil price drops in recent years. Lately these four countries, like most mineral exporters, are going through radical adjustments. It remains to be seen how they adapt to the new situation in global commodity markets.
Australia
Following a series of economic reforms that started in the mid-1980s, Australia began a period of rapid growth that exceeded its peers in the OECD club. Before Paul Keating, then Australia's treasurer, launched those reforms, the country was viewed by many as gradually moving toward the periphery of the global economy. Some of the key reforms undertaken in Australia included new regulation of the labor market to increase its flexibility and lower taxes, as well as reform of the financial system to enable it to meet the financing needs of the economy and to make it more attractive to investors, both domestic and foreign. Importantly, the government liberalized the system of mineral licensing and permits, which boosted investment in greenfield mineral exploration.
Minerals account for 70 percent of the value of Australia's exports and about 12 percent of its GDP. An additional 9 percent of the economy consists of services that are linked to energy and mining.68 By our metrics, that qualifies Australia as a resource economy. Furthermore, until recently, the share of extractive industries had been growing. Before the drop in oil prices, industry analysts had expected Australia to triple its gas production by 2020 and to overtake Qatar as the world's largest LNG producer, as Australia's conventional and unconventional gas projects came to the production stage. Hydrocarbons aside, Australia is the world's second-largest producer of gold, nickel, and zinc, the third-largest producer of iron ore and uranium, and the world's fourth-largest producer and leading exporter of coal.
Contrary to the predictions one might make from the resource curse hypothesis, the 1997 Asian financial crisis did not drag Australia down. Neither did it go into a recession like most other industrialized nations during the financial meltdown of 2008–09. Consistent reforms, strong property rights, immigration-friendly policies, and low barriers to doing business allowed Australia to become one of the world's leaders in economic growth and social development.
Australia is also one of the world leaders in economic freedom. It ranks 12th in the Economic Freedom of the World rating69 and 13th in World Bank's Doing Business rating.70 It also has the 18th-highest GDP per capita (PPP) in the world.71 The country has a highly developed framework of economic, social, and political institutions, which has allowed it to maintain a highly diversified economy and avoid the pitfalls of the Dutch disease.
Its extractive industries are diverse and consist of various players from world supermajors like BHP Billiton to independent exploration companies. Australian companies have also established themselves as active global explorers, especially in the mining industry. The sector is fully competitive and completely private, with no state companies in either energy or mining. The property rights of mineral license holders are secure, and access to new exploration and production licenses is relatively transparent, uncomplicated, and free of red tape.
Australia has been a pioneer in many areas, including the world's first floating LNG facility (Prelude FLNG), which is under development in the North West Shelf area. It also became a leader in the production of coalbed methane. Australia's innovation is helped not least by a pragmatic immigration policy, which attracts talented and entrepreneurial people from all over the world. Australia's and Canada's immigration policies are often considered to be role models for other countries. Curiously, their immigration levels, around 20 percent of the general population, are higher than the OECD average and are also higher than in many countries where immigration causes much greater controversy and hostility than in either Canada or Australia.
Canada
Canada is often mentioned as a role model of economic growth and social development for other resource economies. Canada's resource reliance is somewhat less than that of Australia, but nonetheless Canada's economic growth has been to a large degree driven by its mineral sector, especially since the shale oil breakthrough. Canada's overall mineral exports account for 34 percent of the value of its overall exports and about 9 percent of its GDP.72 It's also one of the world leaders in economic freedom: Canada ranks 9th in the Economic Freedom of the World rating73 and 14th in the World Bank's Doing Business rating.74 Additionally, it has the 17th-highest GDP per capita (PPP) in the world.75 The country has a highly developed framework of economic, social, and political institutions.
According to the Canadian government, before the drop in oil prices, the energy sector was the greatest contributor to Canada's balance of trade and a major job creator, employing more than 550,000 people. In 2012 alone, domestic and international businesses invested $55 billion in Canadian hydrocarbon projects.76 Sufficient technological advances also enabled the commercial production of Canadian oil sands. Many of the oil sand deposits had been identified long before their development became economically feasible. Technological progress allowed companies to book those deposits as commercial reserves and to start production.
Canada's mining sector also served as a source of economic growth. Foreign direct investment into mining was between $50 billion and $70 billion annually in the second half of the 2000s.77 Mining output was not only growing domestically but also spilling over internationally through multiple Canadian firms' investments in mining projects in emerging markets. Remarkably, Canadian companies account for between 30 percent and 45 percent of total global exploration activity in the mining sector worldwide.
Canada's hydrocarbons are developed by a range of companies both domestic (e.g., Athabasca Oil Corporation and Canadian Natural Resources) and international (e.g., Shell and ConocoPhilips). Extractive industries are completely private, with no state companies in either energy or mining. The property rights of mineral license holders are secure, and access to new exploration and production licenses is transparent, uncomplicated, and free of red tape. Canada's mineral tax regime is profit based and is generally lower than in many other jurisdictions.
The country possesses the third-largest proven reserves of crude after Saudi Arabia and Venezuela. Canada benefits from its proximity to its biggest trading partner, the United States. Canada is currently the world's largest producer of heavy oil from oil sands and is at the forefront of technological innovation in unconventional hydrocarbons.
In addition, Canada is using sovereign funds to hedge government finances against commodity price volatility. The largest sovereign fund in Canada is the Alberta Heritage Savings Trust Fund. Also, the Toronto Stock Exchange is the world's leader in extractive industries: more mining and oil companies are listed there than on any other exchange in the world. Canada's institutional strength has allowed it to become a worldwide financial hub for hundreds of mining companies, which list their shares on the Toronto Stock Exchange.
Chile
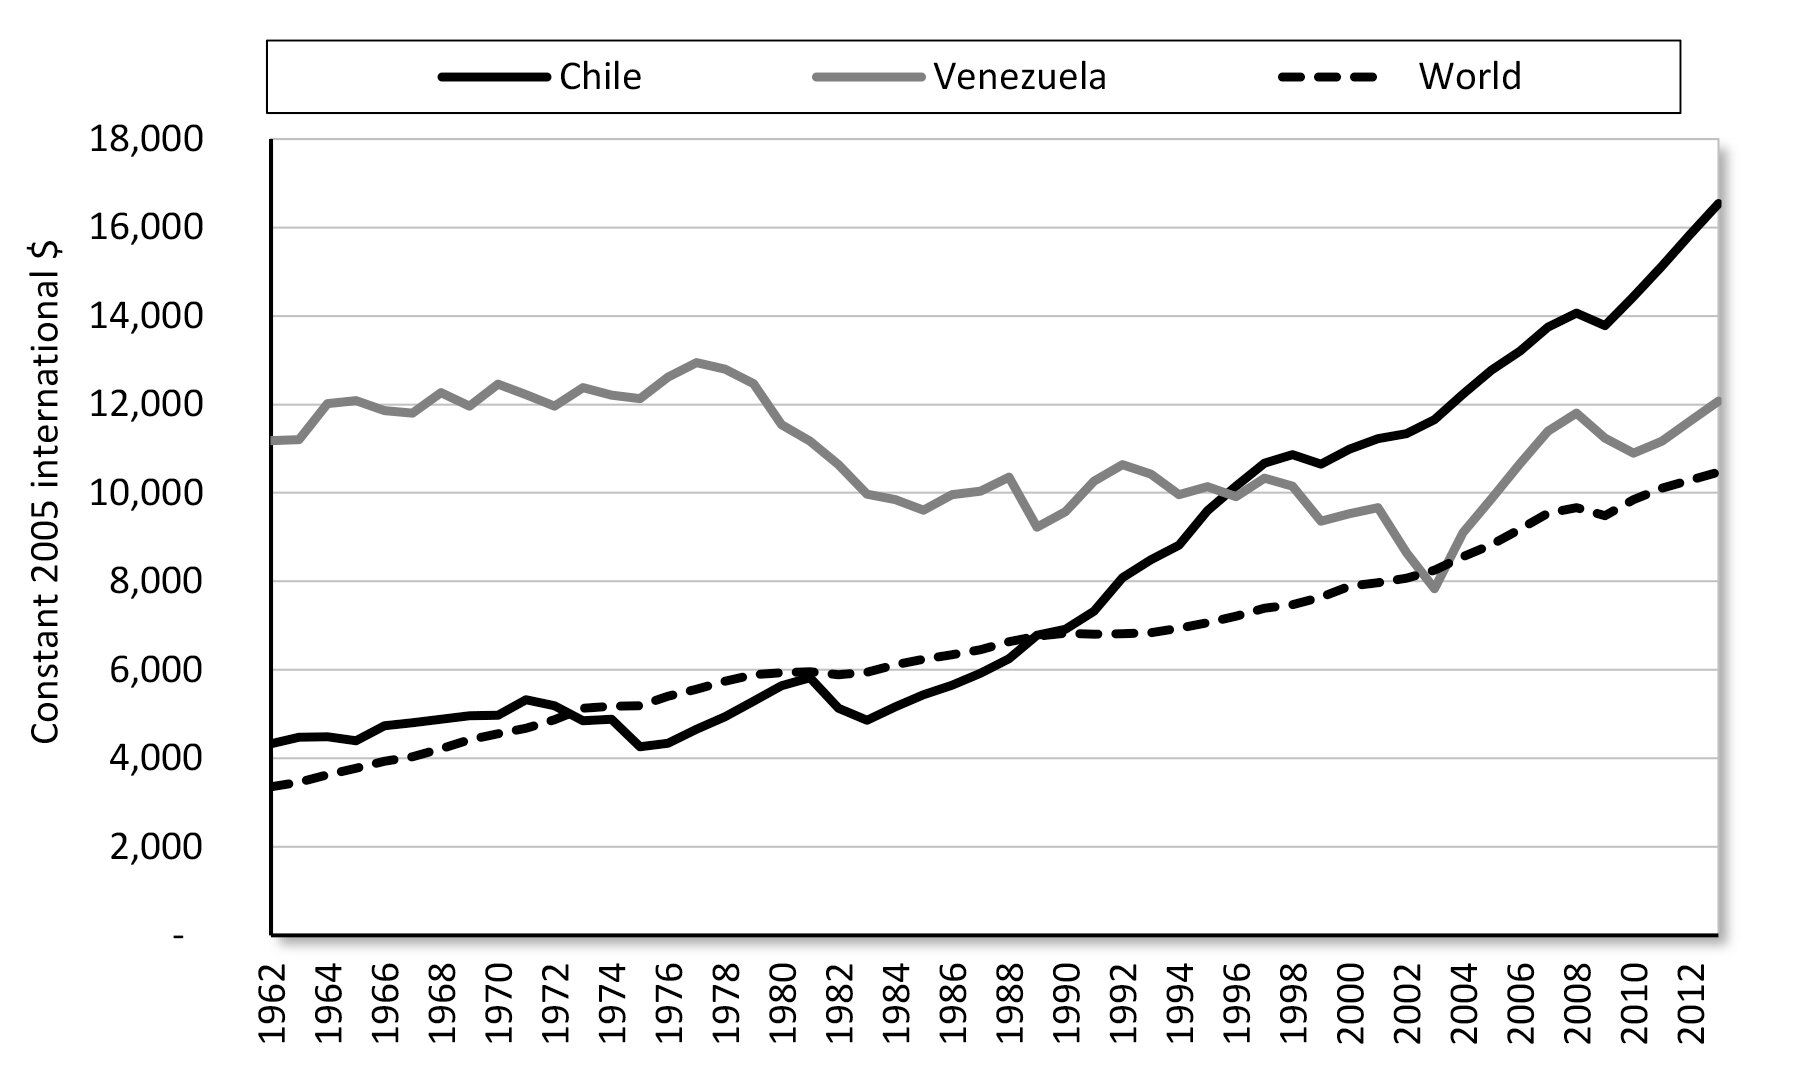
Chile today is the largest producer of copper, natural nitrates, iodine, and lithium, as well as the 2nd-largest producer of molybdenum, the 5th-largest supplier of silver, and 13th-largest producer of gold. Chile ranks 10th in the Economic Freedom of the World rating.78 It is the only country in South America that is a member of the OECD. The strength of Chile's institutions and its favorable investment climate have made it the most successful Latin American economy. Figure 16 shows Chile's performance over half a century relative to Venezuela, another South American country that relies on natural resources exports.
Figure 16. Real GDP per Capita (PPP) in Two South American Resource Economies Since 1962
Source: World Bank Open Data, author's calculations,
http://data.worldbank.org/topic/economy-and-growth.
It is remarkable how Chile's economy and public policy have reacted to global copper prices. In 1971 the government of Salvador Allende nationalized all copper mines in Chile, along with banks and various companies in the manufacturing sector. That change caused an exodus of foreign capital and a suppression of domestic investment. Despite a strong increase in copper prices in the early 1970s, real GDP declined during the Allende regime, and inflation was at 100 percent a year.79
A period of severe economic and political instability led to the overthrow of the Allende government in 1973. The military government instituted a decisive anti-inflation program and devalued the real exchange rate. Unlike Chile's first copper export boom, Chile's second, which occurred in 1979–80, was accompanied by substantial growth in real GDP. Even after the decline of copper prices in 1981, GDP grew by about 5 percent annually during the remainder of the 1980s, and the real exchange rate appreciated only modestly. Moreover, Chile's stable institutional and regulatory framework kept investors on board during Latin America's turbulent economic conditions in the 1990s, allowing the country to outperform its regional peers. The government retained export windfalls in a stabilization fund and prevented the nonmining tradable sector from being suppressed by the effects of the Dutch disease.
The mining sector reforms were crystallized in Chile's 1981 Constitutional Mining Law (note that the term "constitutional" makes the law as immutable as the constitution). The law is a one-stop legislative shop for potential investors, outlining the rights and obligations of concession holders. The Constitutional Mining Law treats a concession as private property and allows concession holders to develop a mine in accordance with their strategy and market conditions. It also provides strong protection against expropriations. Importantly, the existence and termination of the concession are in the hands of the judicial branch, not the legislative branch or the executive. The law was drafted by José Piñera, then Chile's secretary of mining.80
It is worth noting that Chile's mining sector has a mixed property structure. Because of political pressures, during mining sector reforms in the early 1980s, it was decided that the biggest copper mining company, Codelco, would remain majority state owned. But copper production, which rose fivefold in the 1980s and 1990s, grew fastest among private companies. As a result, government-owned Codelco controls less than a third of overall copper production in Chile today.81
Following the success of mining reforms in the 1990s, the private concession system was extended to the Chilean infrastructure sector (highways, airports, and ports), which had traditionally been deemed "public works" to be carried out by the state.
Norway
Norway's GDP per capita (PPP) is the sixth-highest in the world.82 Norway ranks 27th in the Economic Freedom of the World rating,83 9th in World Bank's Doing Business rating,84 and 1st on the UNDP Human Development Index.85 Its institutional system is considered to be one of the most reliable and developed in the world. Up to a quarter of national income is generated by oil and gas production — the largest in Europe. Despite its reliance on mineral exports, Norway managed to avoid economic overheating and successfully mitigated the effects of oil price volatility thanks to disciplined and efficient policies. Norway's policy framework for managing revenues from hydrocarbon exports, especially the Government Pension Fund, is used as a model by several resource economies. These policies are relatively new. Although oil was discovered in Norway in 1969, it was not until the early 1980s that crude production started to generate a positive income.
Until 1981, when a Conservative government replaced the Labor Party, Norway's economic policies had been predominantly state led and included subsidized industrialization, rationing, and price controls. Inflation was high and real income growth low. The new government introduced a degree of deregulation and limited economic liberalization, which played an important role in attracting investment into the hydrocarbon industry. Today, Norway continues to maintain a large welfare state, but the current model differs from the pre-1981 one in one critical aspect: it is based on fiscal responsibility and financial discipline. In short, Norway chose a model with a large government that it can actually afford. Such a welfare state model differs from many other Western countries, where welfare obligations are financed though government borrowing and the central bank's printing press.
Through the national companies Statoil and Petoro, the government controls about 60 percent of oil and gas production and about the same share of reserves in Norway. The remaining share is divided among various international companies, such as ExxonMobil, Total, Shell, and ConocoPhilips.
An important feature of Norway's model is prudent and strategic management of its natural resources. Following a decline in oil production due to depletion of mature fields, natural gas production has risen to reach 10 billion cubic feet a day, more than five times what it was 20 years ago. Furthermore, international operations of Statoil, Norway's majority state-owned oil company, allow Norway to leverage its operational expertise in other regions, while compensating for the decline in domestic oil production. All in all, Statoil participates in oil and gas projects in 15 countries.
Strong Institutions and Economic Growth during Periods of Low Oil Prices: The 1980s Experience
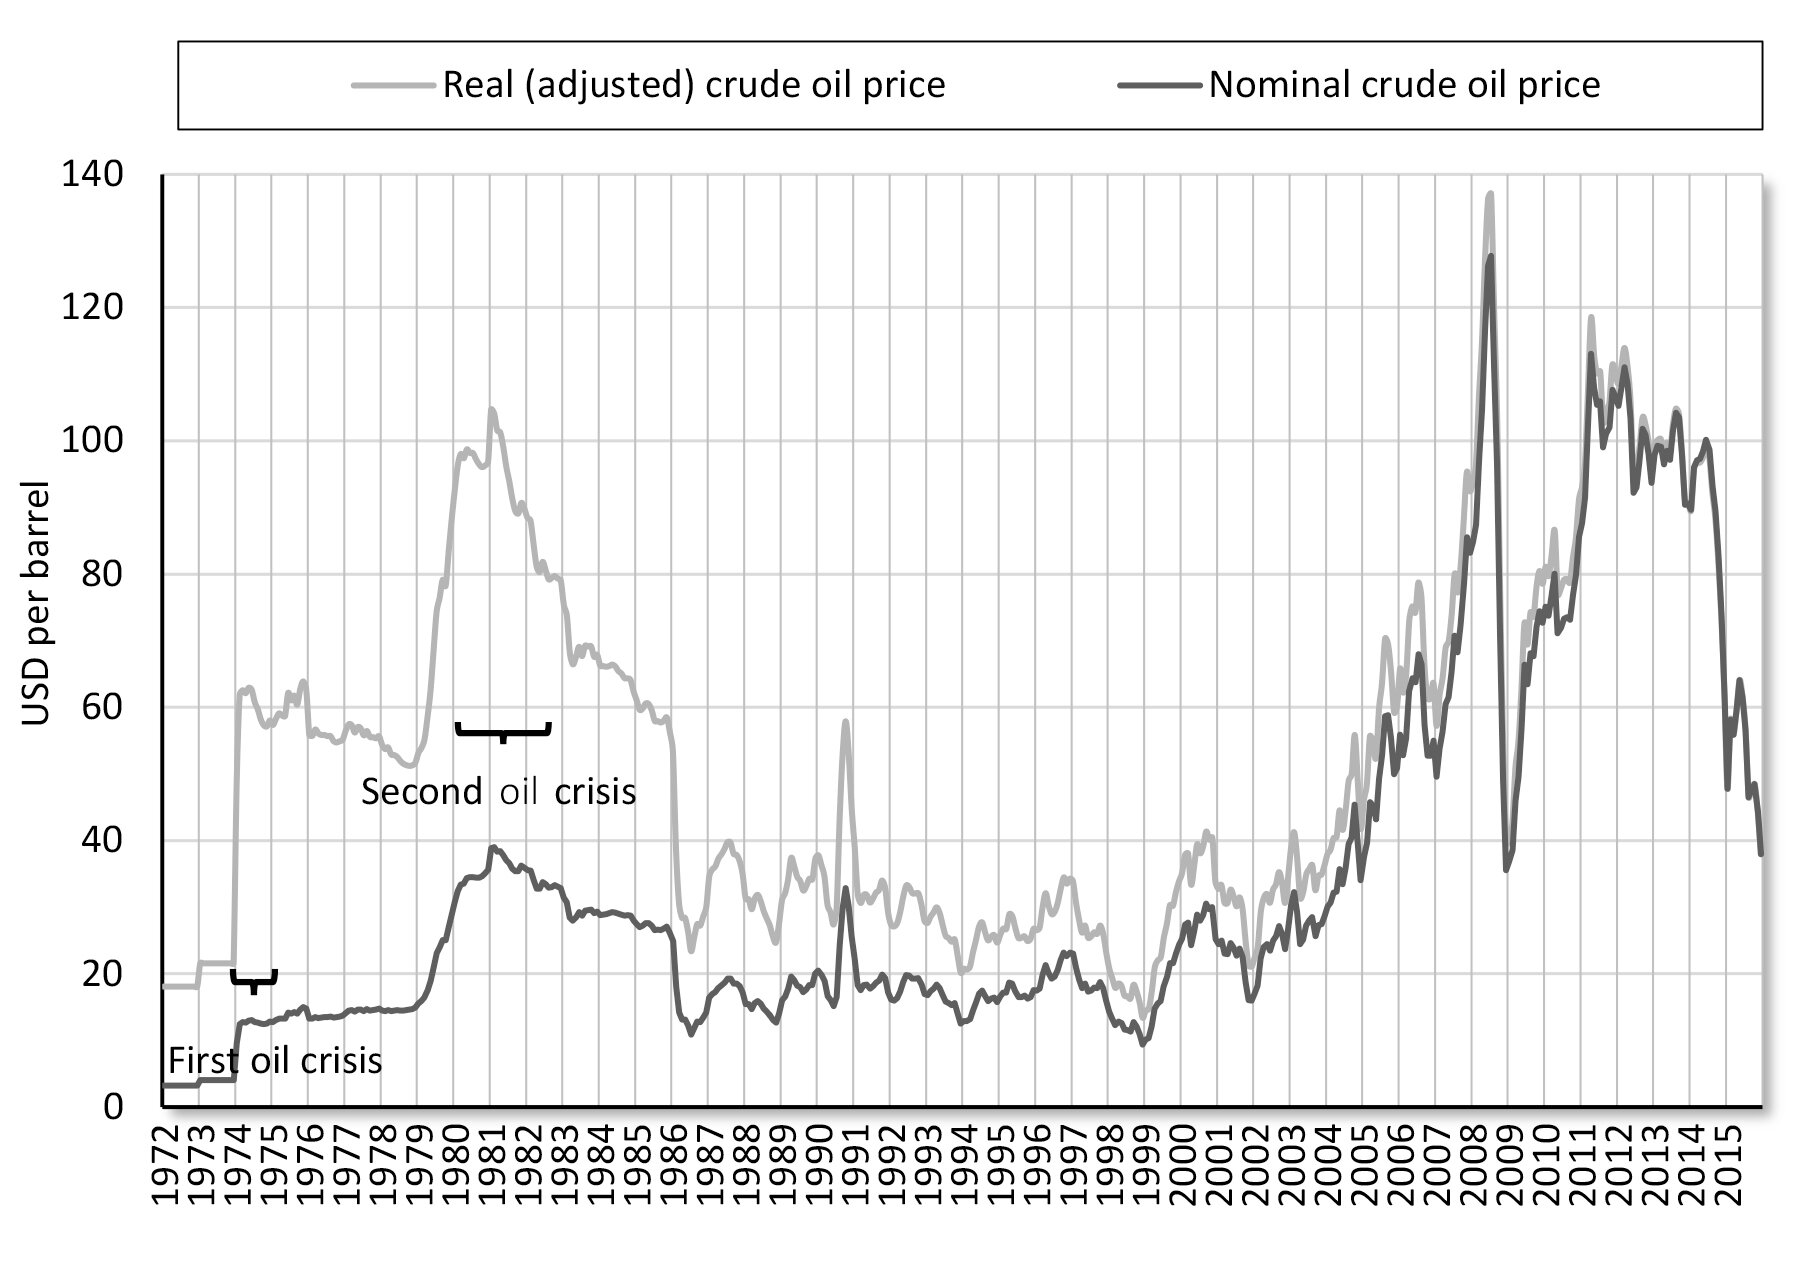
Soon after the Islamic Revolution of 1979, Iran started the second wave of nationalization of its oil industry, which led to a slump in production. That outcome caused panic in the oil market, which worsened with the beginning of the Iran–Iraq War in 1980 — Iran's oil production even came to a halt for some time. Those events led to a sharp rise in oil prices, a period that became known as the second oil crisis. The first oil crisis of 1973 was triggered by the Yom Kippur War and the oil embargo of the Arab countries against the West. All in all, those developments from 1973 through 1981 led to a twelvefold increase of the oil price (in nominal terms) from $3.22 to $38.85 per barrel. Real prices adjusted for inflation climbed 5.8 times from $18.09 per barrel to $105.48 per barrel.
By January 1981, it was evident that various conflicts in the Middle East would not greatly suppress global oil production: the fall in production in Iran and Iraq was compensated for by other exporters who managed to increase supply swiftly and consequently satisfied global demand. That realization resulted in the greatest price collapse in history: in nominal terms, prices declined 3.6 times 1981–86.86 In real term — adjusted for inflation — prices returned to the exact same level from which they started to skyrocket back in 1973. The oil cycle was thus complete.
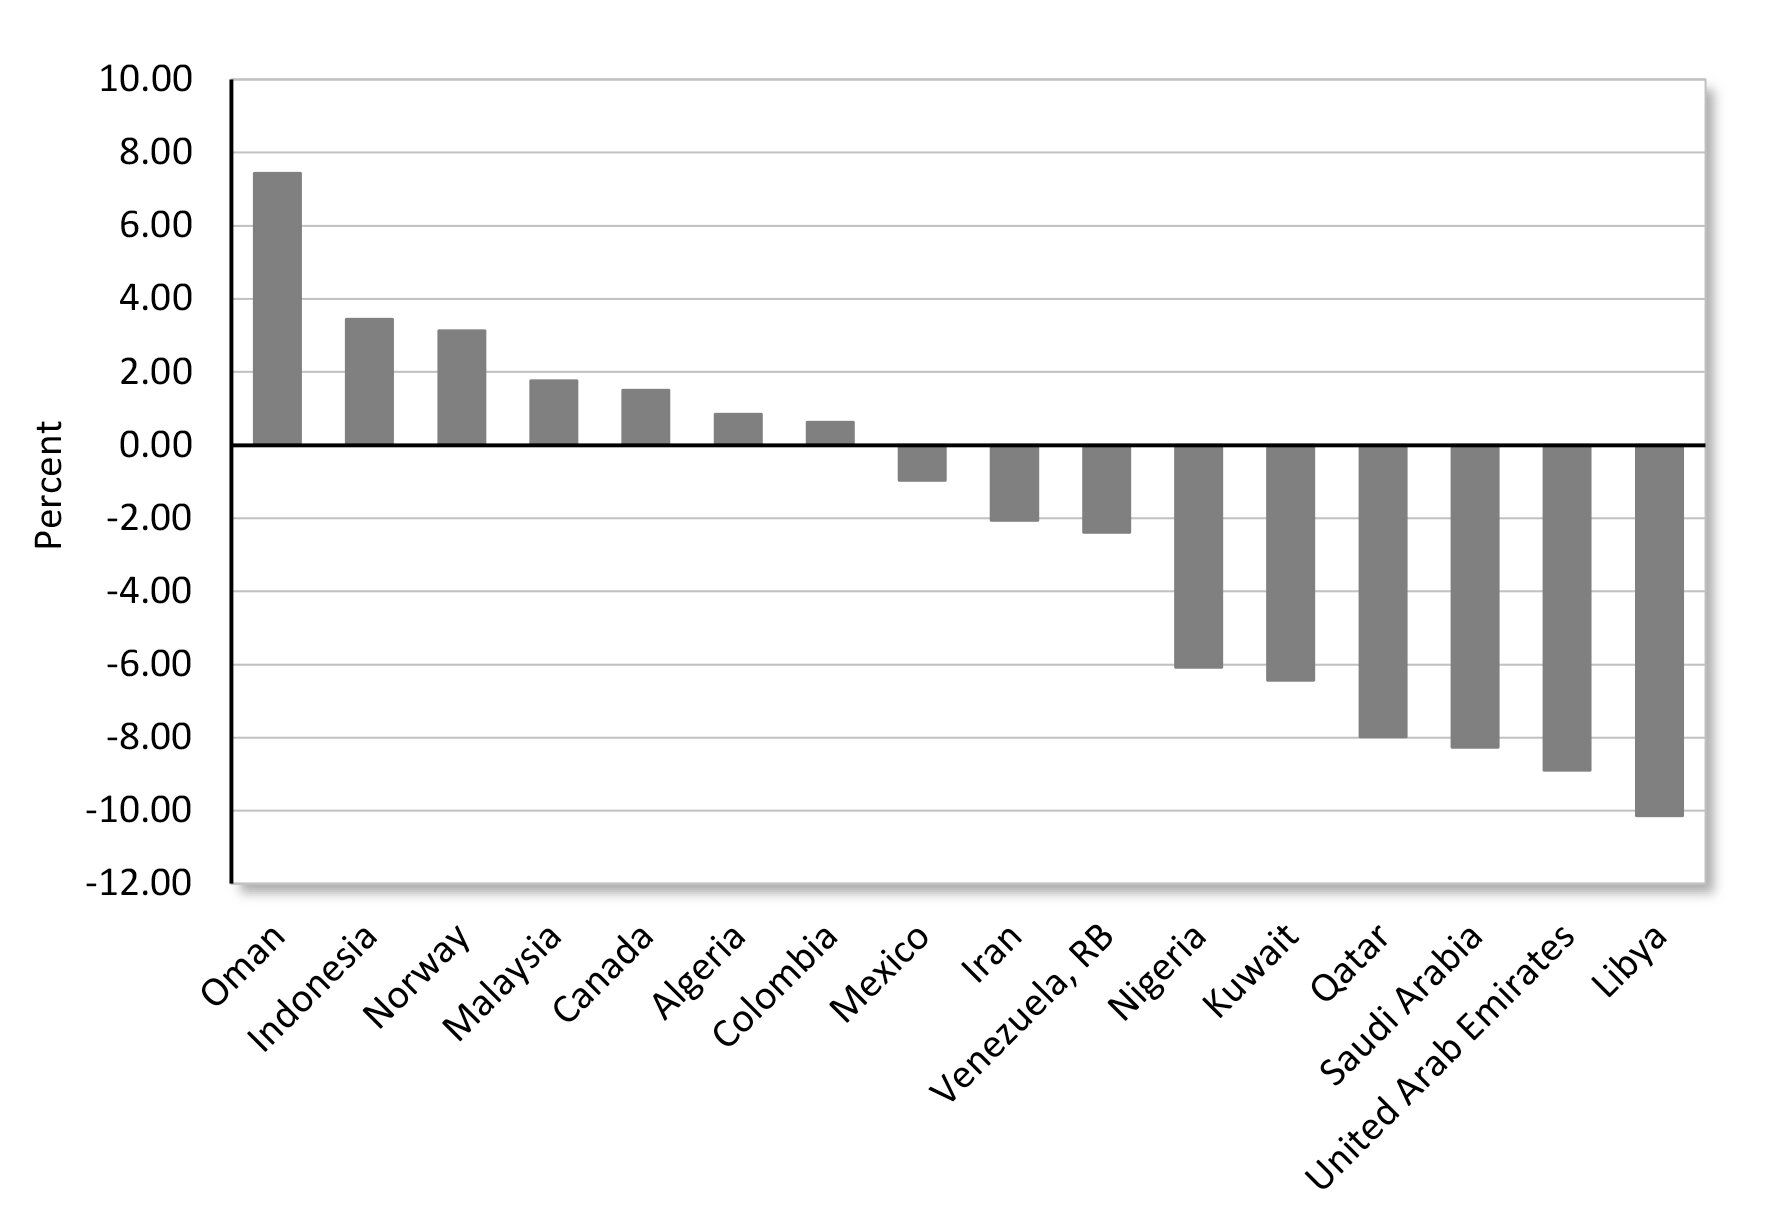
From 1980 to 1986, the world saw one of the deepest and longest declines in oil price — they dropped by 72 percent throughout that period. Price movements of then and now have much in common. Hence, the economic lessons of the 1980s are quite relevant today, because they demonstrate possible scenarios for oil economies under the pressure of low oil prices. In the 1980s, many oil-exporting countries experienced a severe economic shock, from which some have not fully recovered to this day. Such an outcome seems logical. In this group of countries, a sharp fall in prices causes a drop in budget revenues and a suppressed inflow of money into the overall economy. As a consequence, the majority of oil-exporting countries were hit by an economic crisi — the rate of GDP per capita growth was negative. However, there were exceptions. In particular, five oil exporters witnessed positive growth exceeding 1 percent of GDP during the oil price collapse (see Figure 17). Those countries were Oman, Indonesia, Norway, Malaysia, and Canada.
Figure 17. Average GDP per Capita Annual Growth in Oil Economies for the Period 1981–86
Source: World Bank Open Data, author's calculations,
http://data.worldbank.org/topic/economy-and-growth.
The political systems of those five countries were vastly different from one another. For instance, only Canada and Norway were democracies. What made their cases similar were their high rankings or increases in their positions on the Economic Freedom of the World index. Canada was continuously ranked among the top leaders of the index (it was fifth in 1980 and sixth in 1990). By rejecting the policy of import substitution and liberalizing its economy in the 1980s and 1990s, Malaysia also reached leading positions in the rankings, 13th and 15th, respectively. In 1981, the Norwegian Social Democrats were succeeded by a market-oriented government. As a result, Norway improved its position from 36th place in 1980 to 21st in 1990.
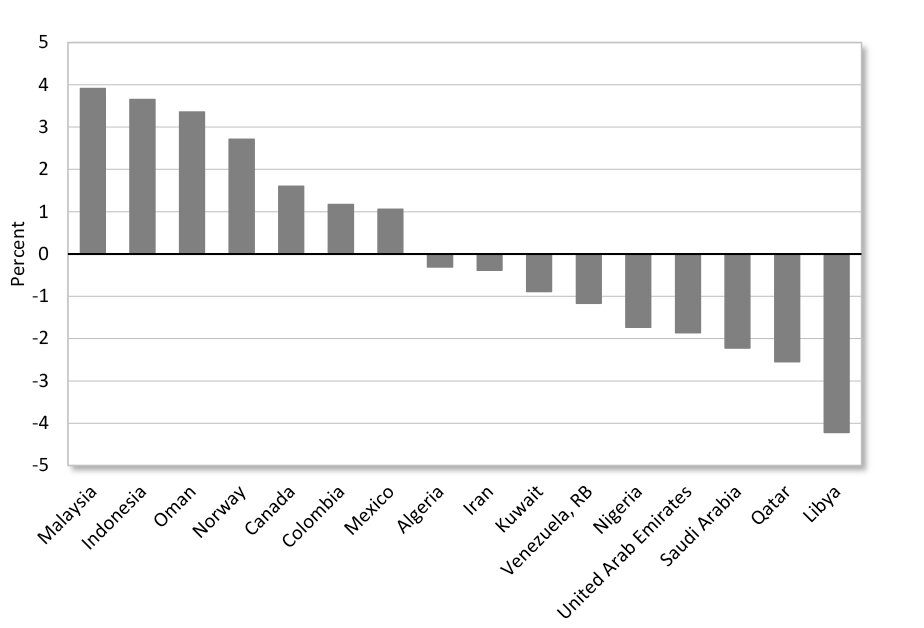
Figure 18. Average GDP per Capita Annual Growth in Oil Economies for the Period 1980–2000
Source: World Bank Open Data, author's calculations,
http://data.worldbank.org/topic/economy-and-growth.
Unlike those three countries (Norway, Canada, and Malaysia), Indonesia is not used as a case study of economic success in this paper. Indeed, Indonesia's experience has been mixed. Its development deteriorated significantly following the Asian financial crisis of 1997. Nonetheless, in the 1980s, Indonesia was one of the regional leaders in economic growth. Following a partial economic liberalization under the "New Order" of President Suharto, Indonesia rose from 62nd to 37th place within a decade.
Because of the relatively small size of its economy, Oman also does not appear as a case study in this paper. Oman's achievements as an oil-exporting country are nevertheless quite significant. Because of economic reforms undertaken by Sultan Qaboos bin Said, who rose to the throne in 1970, Oman rapidly increased its income per capita and accompanied that growth with a leap in institutional improvements. In 1980 Oman was not listed on the Economic Freedom of the World index, but by 1990 it was ranked 34th — above the majority of its neighbors from the Arab world.
An important condition for positive growth rates in an oil-exporting economy under low commodity prices is its ability to increase production. Such an increase may partially or fully compensate for the decline in revenues from lower unit prices for a barrel of oil. Four of the five examined countrie — Oman, Canada, Norway, and Malaysia — increased oil production in 1981–86. Oman, Norway, and Malaysia almost doubled it. Indonesia could not follow their example because it was the only country in this group that at that time was a member of OPEC and thus was forced to comply with the cartel's quotas (Indonesia subsequently left the organization). However, Indonesia managed to partially compensate for those losses by doubling its gas production. Malaysia and Oman also significantly increased their gas production in the covered period. In Norway, a gas boom began a bit later and became a locomotive of growth during low oil prices in the 1980s and 1990s.
Not all oil exporters have the ability to quickly increase their production. That requires advanced management and strategic production planning. In particular, companies need to invest in exploration ahead of time — before the period of low prices. They also need to boost efficiency by increasing oil recovery rates.
If we look at the longer period from 1980 to 2000, which was characterized by suppressed oil prices (see Figure 18), one thing stands out in the group of oil-exporting countries. The same five countries with stronger economic institutions are again among the growth leaders. The main conclusion is that strong institutions allow economies to achieve long-term growth despite unfavorable economic conditions, such as low oil prices. An institutional solution is essential for long-term growth. Strong institutions can allow increases in production and can prop up efficiency. Furthermore, they can also diversify the economy when investments in oil, gas, and metals generate a smaller return because of falling prices.
This paper argues that resource economies with better economic and political institutions manage their resource revenues better and can achieve superior results in economic growth and social development. Evidence presented here is at odds with the resource curse hypothesis and with the idea that mineral-exporting countries are doomed to stagnation. Instead of battling with various "curses" and "diseases," governments might do a better job by looking inward and analyzing their own performance, along with the institutional conditions in the economies that they govern. It is the quality of institutions that essentially determines whether natural resource abundance is a blessing or a curse.
This paper reaches the following main conclusions:
- Natural resources themselves are not the root of the problems facing many mineral-exporting economies. It is possible to build a modern and prosperous economy that derives a significant share of income from the sale of minerals.
- In resource-exporting countries with better institutions and higher levels of economic freedom, both real per capita income and human development scores are higher, people live longer, and more investment and more civil rights exist. Higher economic freedom correlates with lower levels of crime, corruption, and illiteracy.
- One of the main obstacles to economic growth and social development in many resource economies is rent-seeking. It is not a unique feature of resource economies, but it does appear to have a particularly strong effect on them and to produce institutional weaknesses.
- Both the Dutch disease and the effect of commodity price volatility are first and foremost institutional rather than purely economic problems. Both become problems under specific circumstances, which are usually associated with the lack of strong and transparent institutions.
- If implemented properly with the right level of self-discipline, stabilization funds may be a useful economic policy tool for resource economies. Whether they are an optimal way to manage government income is still an open question.
- Innovation is one of the key drivers of growth and social development. The shale revolution is in essence a technological breakthrough of the highest caliber that helped undermine a common prejudice against extractive industries as being insufficiently innovative.
- It is no coincidence that a breakthrough in unconventional hydrocarbons (i.e., shale oil, shale gas, oil sands, and coalbed methane) should have taken place in some of the most economically free countries of the world, such as the United States, Canada, and Australia. The combination of secure property rights, transparent and efficient regulation, a favorable tax regime, and minimal red tape made it possible.
- Private oil companies generally perform more efficiently than state-owned firms: the average net income per barrel of the six largest privately owned oil companies is roughly 60 percent to 85 percent higher (depending on the year) than that of the six leading state-owned oil companies.
- Under certain conditions, and within the right policy framework, some state corporations manage to achieve impressive results (examples include Norway's Statoil and Malaysia's Petronas). What matters is the way a particular company is organized, and, even more important, the overall institutional environment in which it operates.
- Five oil exporters witnessed positive GDP growth during the oil price collapse in the 1980s. Those countries are Oman, Indonesia, Norway, Malaysia, and Canada. Their examples demonstrate that strong economic institutions can help weather the storm of low commodity prices.
- More government participation in resource economies does not increase growth. On balance, it generates a negative return by crowding out private investment, fueling rent-seeking and corruption, and decreasing overall productivity.
- A mineral-exporting country can catch up in its economic development if it strengthens its institutions. Even with relatively small improvements, the results are positive and quite significant.
For the purposes of this paper, a country is a resource economy if over 25 percent of its exports consist of natural resources and the ratio of resource exports to GDP exceeds or is close to 10 percent (I also add some countries whose share is slightly below 10 percent of GDP but that nonetheless have a very high share of natural resources in their exports). The former criterion is used by a number of authors and is consistent with the IMF definition of resource-dependent countries. The latter is added to ensure that countries with very low volumes of overall exports do not fall into that category. Below is a full list of countries that qualify, based on IMF and UNCTAD data.
Altogether, this paper examines 68 resource economies and 39 oil and gas economies. Below is a list of resource economies as well as groups of countries according to their scores in the following three indexes:
- The Fraser Institute Economic Freedom of the World report
- The World Bank's Doing Business report
- The Global Competitiveness Report of the World Economic Forum
- The groups include only those countries that actually receive a score in those indexes.
Table 1. Resource Economies

Table 2. Resource Economies Grouped According to Their Score in the World Fraser Institute Economic Freedom of the Word Report

Table 3. Resource Economies Grouped According to Their Score in the World Bank's Doing Business Report

Table 4. Resource Economies Grouped According to Their Score in the Global Competitiveness Report of the World Economic Forum

1. This paper is based on an earlier study published by the Russian Academy of National Economy and Public Administration titled "Resource Rents and Economic Growth: Economic and Institutional Development in Countries with a High Share of Income from the Sale of Natural Resource — Analysis and Recommendations Based on International Experience," December 2013, http://cre.ranepa.ru/wp-content/uploads/2014/06/1_131201_Resource-rents-and-economic-growth-report.pdf. The author would like to thank Nikola Kjurchiski and Regina Samoilova at RANEPA for their assistance in this research. OPEC was established in 1960 and currently comprises 12 countries: Algeria, Angola, Ecuador, Iran, Iraq, Kuwait, Libya, Nigeria, Qatar, Saudi Arabia, the United Arab Emirates, and Venezuela. In most OPEC member countries, governments dominate oil and gas production and control hydrocarbon reserves.
2. Shale gas is natural gas that is trapped within fine-grained sedimentary rocks.
3. The term "natural resources" here refers to what are known as "point resources" — essentially, raw and refined mineral commodities. A broader definition might include land, water basins, and other such natural resources that are not considered here. This paper's definition, however, is consistent with most studies on the subject and includes two broad categories of minerals: mineral nonfuels and fuels. The former comprises nonferrous metals, metalliferous ores, crude fertilizers, and other minerals, including precious and semiprecious stones. The latter category includes oil and oil products, natural gas, and coal. The precise list of commodities included in the definition is based on the Standard International Trade Classification and the database of merchandise exports developed by the United Nations Conference on Trade and Development, which has the most detailed statistical database on global merchandise trade.
4. See Raymond Mikesell, "Explaining the Resource Curse, with Special Reference to Mineral-Exporting Countries," Resources Policy 23 (1997): 191–99, http://www.sciencedirect.com/science/article/pii/S0301420797000366; and Tobias Kronenberg, "The Curse of Natural Resources in the Transition Economies," Economics of Transition 12 (2004): 399–426. http://www.econstor.eu/bitstream/10419/83802/1/wp241.pdf.
5. Terry Lynn Karl, The Paradox of Plenty: Oil Booms and Petro-States (Berkeley: University of California Press, 1997).
6. See William C. Gruben, "The ‘Curse' of Venezuela," Southwest Economy (May–June 2004): 17–18, http://www.dallasfed.org/assets/documents/research/swe/2004/swe0403d.pdf.
7. See BP Statistical Review of World Energy: June 2015, http://www.bp.com/content/dam/bp/pdf/energy-economics/statistical-review-2015/bp-statistical-review-of-world-energy-2015-full-report.pdf.
8. Ibid.
9. Jeffery D. Sachs and Andrew M. Warner, "Natural Resource Abundance and Economic Growth," NBER Working Paper no. 5398, National Bureau of Economic Research, Cambridge, MA, 1995, https://www.google.ru/url?sa=t&rct=j&q=&esrc=s&source=web&cd=3&ved=0CC4QFjAC&url=https%3A%2F%2Facademiccommons.columbia.edu%2Fdownload%2Ffedora_content%2Fdownload%2Fac%3A138843%2FCONTENT%2FNaturalResourceAbundanceWarner.pdf&ei=4hj_U4bzOuOm4gSl1YDQAQ&usg=AFQjCNHFfHUj64F2QfGCeWA58zDn5h44Bw&sig2=zGIgVQ6pSJkGOa8_PRS99A&bvm=bv.74035653,d.bGE&cad=rjt.
10. Xavier Sala-I-Martin, "I Just Ran Two Million Regressions," American Economic Review 87 (1997): 178–83, https://www.jstor.org/stable/pdf/2950909.pdf.pdf.
11. The Financial Times Lexicon defines it in the following way: "Dutch disease is the negative impact on an economy of anything that gives rise to a sharp inflow of foreign currency, such as the discovery of large oil reserves. The currency inflows lead to currency appreciation, making the country's other products less price competitive on the export market. It also leads to higher levels of cheap imports and can lead to deindustrialization as industries apart from resource exploitation are moved to cheaper locations." http://lexicon.ft.com/Term?term=dutch-disease.
12. Economists such as Ronald McKinnon, "International Transfers and Non-Traded Commodities: The Adjustment Problem," The International Monetary System and the Developing Nations, ed. Danny M. Leipziger (Washington: Agency for International Development, 1976); and Warner Max Corden and Peter Neary, "Booming Sector and De-Industrialization in a Small Open Economy," Economic Journal 92 (1982): 825–48. See also Sweder van Wijnbergen, "The ‘Dutch Disease': A Disease After All?" Economic Journal 94 (1984): 41–55, http://www.aae.wisc.edu/coxhead/courses/731/PDF/vanWijnbergen-DutchDise…; Richard Auty, "Industrial Policy Reform in Six Large Newly Industrializing Countries: The Resource Curse Thesis," World Development 22 (1994): 1, 11–26, http://www.sciencedirect.com/science/article/pii/0305750X94901651; and Thorvaldur Gylfason, Tryggvi Thor Herbertsson, and Gylfi Zoega, "A Mixed Blessing: Natural Resources and Economic Growth," Discussion paper no. 1668, Centre for Economic Policy Research, London, 1999.
13. See Tiago V. de V. Cavalcanti, Kamiar Mohaddes, and Mehdi Raissi, "Growth, Development and Natural Resources: New Evidence Using a Heterogeneous Panel Analysis," Cambridge Working Paper in Economics no. 0946, University of Cambridge, 2009, http://www.caf.com/media/3119/CMR_04Nov09_CAF.PDF; and Tiago V. de V. Cavalcanti, Kamiar Mohaddes, and Mehdi Raissi, "Commodity Price Volatility and the Sources of Growth," IMF Working Paper no. WP/12/12, International Monetary Fund, Washington, 2011, http://www.imf.org/external/pubs/ft/wp/2012/wp1212.pdf. See also Frederik van der Ploeg and Steven Poelhekke, "Volatility and the Natural Resource Curse," Oxford Economic Papers 61 (2009): 727–60; and Weishu Leong and Kamiar Mohaddes, "Institutions and the Volatility Curse," Cambridge Working Paper in Economics no. 1145, University of Cambridge 2011, http://www.econ.cam.ac.uk/research/repec/cam/pdf/cwpe1145.pdf.
14. Osmel Manzano and Roberto Rigobon, "Resource Curse or Debt Overhang?" NBER Working Paper no. 8390, National Bureau of Economic Research, Cambridge, MA, 2001, http://web.mit.edu/rigobon/www/Robertos_Web_Page/Research_files/resourc….
15. Daniel Lederman and William F. Maloney, eds., Natural Resources Neither Curse nor Destiny (Palo Alto, CA: Stanford University Press; Washington: World Bank, 2007), https://openknowledge.worldbank.org/bitstream/handle/10986/7183/378930LAC0Natu101OFFICIAL0USE0ONLY1.pdf?sequence=1; Daniel Lederman and William F. Maloney, "In Search of the Missing Resource Curse," Policy Research Working Paper no. 4766, World Bank, Washington, 2008, https://openknowledge.worldbank.org/bitstream/handle/10986/6901/WPS4766.pdf?sequence=1.
16. Ibid. After accounting for fixed effects in their analysis, the negative impact of resources disappeared, suggesting that it is not their particular proxy but rather the natural resources proxy's correlation with certain unobserved national characteristics that is influencing the result.
17. See Jean-Philippe C. Stijns, "Natural Resource Abundance and Economic Growth Revisited," Resources Policy 30 (2005): 107–30, http://ageconsearch.umn.edu/bitstream/25127/1/dp01st01.pdf.
18. Andrew Rosser, "The Political Economy of the Resource Curse: A Literature Survey," IDS Working Paper no. 268, Institute of Development Studies, Brighton, UK, 2006, p. 9, https://www.ids.ac.uk/publication/the-political-economy-of-the-resource-curse-a-literature-survey.
19. Sachs and Warner, "Natural Resource Abundance," Auty, "Industrial Policy Reform"; Rosser, "Political Economy"; Cavalcanti, Mohaddes, and Raissi, "Growth, Development and Natural Resources."
20. Stijns, "Natural Resource Abundance Revisited."
21. See Nathan Nunn, "Long-Term Effects of Africa's Slave Trades," Quarterly Journal of Economics 123 (2008): 139–76, http://scholar.harvard.edu/files/nunn/files/the_long_term_effects.pdf; and Christa N. Brunnschweiler, "Cursing the Blessings? Natural Resource Abundance, Institutions, and Economic Growth," World Development 36 (2006): 399–419.
22. "The Dutch Disease," The Economist, November 26, 1977, pp. 82–83.
23. See Corden and Neary, "Booming Sector," Warner Max Corden, "Booming Sector and Dutch Disease Economics: Survey and Consolidation," Oxford Economic Papers 36 (1984): 359–80, http://oep.oxfordjournals.org/content/36/3/359.full.pdf; and Thorvaldur Gylfason, "Nature, Power, and Growth," Scottish Journal of Political Economy 48 (2001): 558–88. Also see Paul Stevens, "Resource Impact: Curse or Blessing? A Literature Survey," Centre for Energy, Petroleum and Mineral Law and Policy, University of Dundee, Dundee, UK, 2003. For a critical analysis of the "Dutch disease" hypothesis based on a case study of Great Britain, see Jürg Niehans, The Appreciation of Sterling: Causes, Effects, Policies (Rochester, NY: Center for Research in Government Policy and Business, 1981).
24. See Corden and Neary, "Booming Sector."
25. Mikesell, "Explaining the Resource Curse."
26. Gary McMahon, "The Natural Resource Curse: Myth or Reality?" Economic Development Institute, World Bank, Washington, 1997, http://www.scribd.com/doc/90191398/McMahon-Natural-Resource-Curse-Myth-or-Reality.
27. Ragnar Torvik, "Learning by Doing and the Dutch Disease," European Economic Review 45 (1999): 285–306, http://www.sv.ntnu.no/iso/Ragnar.Torvik/science.pdf.
28. Mikesell, "Explaining the Resource Curse."
29. See ibid.; and Richard M. Auty, "Resource Abundance and Economic Development," United Nations University, Helsinki, 1998, https://www.wider.unu.edu/publication/resource-abundance-and-economic-development.
30. Cavalcanti, Mohaddes, and Raissi, "Commodity Price Volatility"; van der Ploeg and Poelhekke, "Volatility and the Natural Resource Curse"; Christa Brunnschweiler and Erwin Bulte, "The Resource Curse Revisited and Revised: A Tale of Paradoxes and Red Herrings," Journal of Environmental Economics and Management 55 (2006): 248–64; Rabah Arezki and Mustapha Nabli, "Natural Resources, Volatility, and Inclusive Growth: Perspectives from the Middle East and North Africa," IMF Working Paper no. 12/111, International Monetary Fund, Washington, 2012, https://www.imf.org/external/pubs/ft/wp/2012/wp12111.pdf.
31. Cavalcanti, Mohaddes, and Raissi, "Growth, Development and Natural Resources," Quarterly Review of Economics and Finance 51 (2011): 305–18, http://faculty.smu.edu/millimet/classes/eco6375/papers/cavalcanti%20et%20al%202011.pdf.
32. See Eric Martin, "Mexico Hedges 2016 Oil Exports at Average of $49 Per Barrel," Bloomberg, August 19, 2015, http://www.bloomberg.com/news/articles/2015-08-20/mexico-hedges-2016-oil-exports-at-average-of-49-per-barrel.
33. Mikesell, "Explaining the Resource Curse."
34. For a discussion on this issue, see Erika Weinthal and Pauline Jones Luong, "Combating the Resource Curse: An Alternative Solution to Managing Mineral Wealth," Perspectives on Politics 4 (2006): 35–53.
35. See Aaron Tornell and Philip R. Lane, "The Voracity Effect," American Economic Review 89 (1999): 22–46, http://lib.cufe.edu.cn/upload_files/other/4_20140530024219_[56]Aaron%20Tornell%20and%20P.%20Lane,%201999.%20The%20Voracity%20Effect.%20American%20Economic%20Review%2089,%2022-46.pdf; Michael Ross, "The Political Economy of the Resource Curse," World Politics 51 (1999): 297–322; Richard M. Auty, "The Political Economy of Resource-Driven Growth," European Economic Review 45 (2001): 839–46, http://www.sciencedirect.com/science/article/pii/S001429210100126X; Thorvaldur Gylfason, "Natural Resources, Education, and Economic Development," European Economic Review 45 (2001): 847–59, http://www.sciencedirect.com/science/article/pii/S0014292101001271; William Easterly and Ross Levine, "Tropics, Germs, and Crops: How Endowments Influence Economic Development," NBER Working Paper no. 15, National Bureau for Economic Research, Cambridge, MA, 2002, http://www.nber.org/papers/w9106.pdf; and Ragnar Torvik, "Natural Resources, Rent-Seeking and Welfare," Journal of Development Economics 67 (2001): 455–70, http://www.svt.ntnu.no/iso/ragnar.torvik/jde.pdf.
36. Halvor Mehlum, Karl Moene, and Ragnar Torvik, "Cursed by Resources or Institutions?" World Economy 29 (2006): 1117–31, http://onlinelibrary.wiley.com/doi/10.1111/j.1467-9701.2006.00808.x/abstract.
37. Ibid., p. 1121.
38. Ibid., p. 1125.
39. James Gwartney and Robert Lawson, Economic Freedom of the World: 1996 Annual Report (Vancouver, BC: Fraser Institute, 1996), http://www.freetheworld.com/index.php.
40. The Economic Freedom of the World (EFW) report is published under the auspices of the Canadian Fraser Institute. Since the 1990s, the annual EFW report has provided data representing the various factors that make countries economically free. Today, the report covers 159 economies (95 percent of the world's population) for which relevant data are available. In its data, Fraser relies on a network of associated institutes from 85 countries that contribute to its research. The EFW index is one of the most broadly acknowledged measurements of the quality of institutions. A number of economists and organizations have used the EFW index as a benchmark of institutional development; the IMF's World Economic Outlook, for instance. The EFW is possibly the most comprehensive of the indexes, as it incorporates some of the data from the other two ratings (the World Bank's Doing Business and the Global Competitiveness Report of the World Economic Forum) among dozens of other sources. The Appendix to the EFW publication contains explanatory notes and a full list of data sources. The Fraser Institute also publishes an annual Survey of Mining Companies, which examines the investment climate in mining economies, and a Global Petroleum Survey, an annual survey of petroleum executives regarding barriers to investment in oil- and gas-producing regions around the world.
41. See Fred McMahon, "Economic Freedom of the World: 2011 Annual Report," presentation at the "Competition: Engine for Prosperity" conference, Kuala Lumpur, October 10–13, 2011.
42. Ibid.
43. See, for example, Anne Krueger, Maurice Schiff, and Alberto Valdés, eds., Latin America: The Political Economy of Agricultural Pricing Policy — Volume 1 (Baltimore: Johns Hopkins University Press, 1991), http://documents.worldbank.org/curated/en/1991/06/439571/latin-america-political-economy-agricultural-pricing-policy-volume-1; The Political Economy of Agricultural Pricing Policy: Asia — Volume 2, http://siteresources.worldbank.org/INTTRADERESEARCH/Resources/544824-1146153362267/ThePoliticalEconomyofAg_Pricing_Policy_vol2_ASIA.pdf; and Africa and the Mediterranean: The Political Economy of Agricultural Pricing Policy — Volume 3, http://econ.worldbank.org/external/default/main? pagePK=64165259&theSitePK=477872&piPK=64165421&menuPK=64166093&entityID=000178830_98101911014528. See also Deepak Lal and Hla Myint, The Political Economy of Poverty, Equity and Growth: A Comprehensive Study (Oxford: Clarendon Press, 1999), http://global.oup.com/academic/product/the-political-economy-of-poverty-equity-and-growth-9780198294320;jsessionid=A14205CDF68FE89B4E34F9E9B6081CF5? cc=ru&lang=en&; William Easterly and Ross Levine, "Africa's Growth Tragedy: Policies and Ethnic Divisions," Quarterly Journal of Economics 112 (1997): 1203–50, http://williameasterly.files.wordpress.com/2010/08/17 _easterly_levine_africasgrowthtragedy _prp.pdf; Gary McMahon, "Natural Resource Curse: Myth or Reality?" Economic Development Institute, World Bank, 1997; Mikesell, "Explaining the Resource Curse"; and Auty, "Industrial Policy Reform." Also take a look at Michael L. Ross, "Does Oil Hinder Democracy?" World Politics 53 (2001): 325–61, http://www.maxwell.syr.edu/uploadedFiles/exed/sites/ldf/Academic/Ross%20-%20Does%20Oil%20Hinder%20Democracy.pdf; Giles Atkinson and Kirk Hamilton, "Savings, Growth and the Resource Curse Hypothesis," World Development 31 (2003): 1793–1807, http://www.sciencedirect.com/science/article/pii/S0305750X03001529; and Andrei Illarionov, "Freedom around the Globe (since 1776): March? Crawl? Retreat? Zig Zag?" presentation at Cato University, San Diego, 2008.
44. Erik Gartzke, "Chapter 2: Economic Freedom and Peace," Economic Freedom of the World: 2005 Annual Report (Vancouver, BC: Fraser Institute, 2005), http://www.cato.org/pubs/efw/efw2005/efw2005-2.pdf.
45. Louis-Philippe Béland and Raaj Tiagi, "Economic Freedom and the ‘Resource Curse': An Empirical Analysis," Studies in Mining Policy, Fraser Institute, Vancouver, BC, 2009, https://www.google.ru/url?sa=t&rct=j&q=&esrc=s&source=web&cd=1&ved=0CBwQFjAA&url=http%3A%2F%2Fwww.fraserinstitute.org%2FWorkArea%2FDownloadAsset.aspx%3Fid%3D2574&ei=tqkDVMngLaHl4QSQx4GQBw&usg=AFQjCNH_xME5PwJC81j_xJilk9CaEE9ocA&bvm=bv.74115972,d.bGE&cad=rjt.
46. Ibid.
47. Mehlum. Moene, and Torvik," Cursed by Resources?"
48. Andrei Illarionov, "What Is to Be Blamed for Economic Stagnation in the Arab World?" presentation at the Second Economic Freedom of the Arab World Conference, Amman, Jordan, November 23, 2007, http://www.iea.ru/article/econom_svoboda/22_11_2007.ppt.
49. Daniel J. Mitchell, "The Impact of Government Spending on Economic Growth," Heritage Foundation, Washington, 2005, http://www.heritage.org/research/reports/2005/03/the-impact-of-government-spending-on-economic-growth.
50. Maria Sarraf and Moortaza Jiwanji, "Beating the Resource Curse: The Case of Botswana," Environmental Economics Series, Paper no. 83, World Bank, Washington, 2001, p. 11.
51. See Gylfason, "Nature, Power and Growth," p. 558.
52. See Weinthal and Jones Luong, "Combating the Resource Curse."
53. For a detailed discussion of economic development in mining economies, see "Treasure or Trouble? Mining in Developing Countries," World Bank, Washington, 2002, http://siteresources.worldbank.org/INTOGMC/Resources/treasureortrouble.pdf.
54. PricewaterhouseCoopers, MineIndonesia 2007: Review of Trends in the Indonesian Mining Industry (Jakarta: PWC, 2008).
55. "Mining Sector Attracting Major Investments," Armenia (London: European Times, 2010), p. 39, http://www.european-times.com/publications/armenia.pdf.
56. See Philippe Fargues, "Immigration without Inclusion: Non-Nationals in Nation-Building in the Gulf States," Asian and Pacific Migration Journal 20 (2011): 273–92, http://www.smc.org.ph/administrator/uploads/apmj_pdf/APMJ2011N3-4.pdf.
57. Sterilization of revenue inflows in oil- and gas-exporting countries has been most commonly associated with actions taken by a country's central bank to neutralize the harmful effects of capital inflows causing domestic currency appreciation and inflation and the consequent possible decrease of export competitiveness.
58. See Benn Eifert, Alan Gelb, and Nils Borje Tallroth, "The Political Economy of Fiscal Policy and Economic Management in Oil-Exporting Countries," in Fiscal Policy Formulation and Implementation in Oil-Producing Countries, ed. J. M. Davis, R. Ossowski, and A. Fedelino (Washington: International Monetary Fund, 2003), pp. 82–122; and Xavier Sala-i-Martin and Arvind Subramanian, "Addressing the Natural Resource Curse: An Illustration from Nigeria," IMF Working Paper no. 03/139, International Monetary Fund, Washington, 2003, http://www.imf.org/external/pubs/ft/wp/2003/wp03139.pdf.
59. See Fund market value estimates by the Alaska Permanent Fund Corporation, http://www.apfc.org/home/Content/home/index.cfm.
60. See BP Statistical Review of World Energy: June 2015 for oil and gas production data by energy source and by country.
61. BP Energy Outlook 2013, Slide 45, http://www.bp.com/content/dam/bp/pdf/energy-economics/energy-outlook-2015/bp-energy-outlook-booklet_2013.pdf.
62. See Bruce Jones, David Steven, and Emily O'Brien, "Fueling a New Order? The New Geopolitical and Security Consequences of Energy," Brookings Institution, Washington, 2014, http://www.brookings.edu/research/papers/2014/04/14-geopolitical-security-energy-jones-steven.
63. Robert Priddle, ed., EIA World Energy Outlook 2011: Are We Entering a Golden Age of Gas? (Paris: International Energy Agency, 2011), http://www.worldenergyoutlook.org/media/weowebsite/2011/WEO2011_GoldenAgeofGasReport.pdf.
64. See BP Energy Outlook 2013, Slides 22–24, http://www.bp.com/content/dam/bp/pdf/energy-economics/energy-outlook-2015/bp-energy-outlook-booklet_2013.pdf.
65. See Peter Kaznacheev and Irina Grinets, "The Role of Innovative Development in Unconventional Hydrocarbon Exploitation in the Context of the Shale Gas Revolution in the USA," Journal of Social, Political, and Economic Studies 39 (2014): 436–66, http://papers.ssrn.com/sol3/papers.cfm?abstract_id=2553720.
66. See Lars Lindholt and Solveig Glomsrød, The Role of the Arctic in Future Global Petroleum Supply, Discussion Papers No. 645, February 2011 , p. 8, Statistics Norway, Research Department, https://www.ssb.no/a/publikasjoner/pdf/DP/dp645.pdf.
67. Fred R. von der Mehden and Al Troner, "Petronas: A National Oil Company with an International Vision," Baker Institute for Public Policy, Rice University, Houston, 2007, http://bakerinstitute.org/media/files/page/9dd51576/noc_petronas_tronervdm.pdf. Also see Valérie Marcel, Oil Titans: National Oil Companies in the Middle East (London: Chatham House; Washington: Brookings Institution Press, 2006), http://books.google.ru/books?id=jUU0mkUyuNQC&pg=PA69&lpg=PA69&dq=petronas+is+the+most+efficient+national+oil+company&source=bl&ots=4g-tOeoseA&sig=73JkBxa8lUP2T22dZuG-iGaWUVU&hl=en&sa=X&ei=FUcEVM3uCuHXyQPmrYHgAw&ved=0CE0Q6AEwBw#v=onepage&q=Petronas&f=false.
68. The share of natural resources in overall exports and in a country's GDP is calculated using data from the UNCTAD Statistics Data Center website, http://unctadstat.unctad.org/wds/ReportFolders/reportFolders.aspx?sCS_ChosenLang=en.
69. James Gwartney, Robert Lawson, and Joshua Hall, Economic Freedom of the World: 2015 Annual Report (Vancouver, BC: Fraser Institute, 2015).
70. Doing Business 2016: Measuring Regulatory Quality and Efficiency (Washington: World Bank, 2016), http://www.doingbusiness.org/~/media/GIAWB/Doing%20Business/Documents/Annual-Reports/English/DB16-Full-Report.pdf.
71. World Bank, "GDP per Capita, PPP" web page, http://data.worldbank.org/indicator/NY.GDP.PCAP.PP.CD?order=wbapi_data_value_2014+wbapi_data_value+wbapi_data_value-last&sort=desc.
72. UNCTAD Statistics Data Center website.
73. Gwartney, Lawson, and Hall, 2015 Annual Report.
74. See Doing Business 2016.
75. World Bank, "GDP per Capita, PPP" web page.
76. Natural Resources Canada, "Key Facts and Figures on the Natural Resources Sector" web page, https://www.nrcan.gc.ca/publications/key-facts/16013.
77. See Chapter 3 on Canada in "Fostering Foreign Investment in Mineral Exploration and Development in Russia," Kinross Gold Corporation, Moscow, 2011.
78. Gwartney, Lawson, and Hall, 2015 Annual Report.
79. See Inflation.eu website, http://www.inflation.eu for the worldwide inflation data. For the historic data for Chile, see "Inflation Chile — 1971," Inflation.eu, http://www.inflation.eu/inflation-rates/chile/historic-inflation/cpi-in….
80. See José Piñera, "Wealth through Ownership: Creating Property Rights in Chilean Mining," Cato Journal 24 (2004): 295–301, http://object.cato.org/sites/cato.org/files/serials/files/cato-journal/….
81. Overall, Chile's copper production in 2014 was 5.8 million tons, of which Codelco produced 1.8 million tons or 32 percent of overall Chilean copper production. For details, see "Codelco Update," Codelco, Santiago, April 2015, https://www.codelco.com/prontus_codelco/site/artic/20110803/asocfile/20110803155044/codelco_update_april2015.pdf. Also see statistical information about Chilean copper mining, Statista website, http://www.statista.com/statistics/254845/copper-production-of-chile/.
82. World Bank, "GDP per capita, PPP" web page.
83. See Gwartney, Lawson, and Hall, 2015 Annual Report.
84. See Doing Business 2016.
85. United Nations Development Programme, Human Development Report 2014: Sustaining Human Progres — Reducing Vulnerabilities and Building Resilience (New York: UNDP, 2014), http://hdr.undp.org/sites/default/files/hdr14-report-en-1.pdf.
86. For details on the historical movement of the oil price, see data from the archives of the U.S. Energy Information Administration "Petroleum & Other Liquids" website, https://www.eia.gov/dnav/pet/pet_pri_spt_s1_d.htm.
