
Medicaid is among the top two expenditure categories in all 50 states. Because of flaws in the program’s structure that date back to its initial implementation in the 1960s, it has proven to be an inefficient way to care for the needy and has suffered from rapid cost escalation. In this policy analysis, we provide evidence that increased Medicaid spending does not improve health outcomes and then evaluate the ways in which states can achieve cost savings on their Medicaid programs while remaining within federal constraints. We question whether Medicaid managed care organizations, a popular cost-saving policy, actually reduce spending. We also find that new beneficiary work requirements, while theoretically attractive, are not possible under the current administration.
Among the reforms we recommend are for states to:
- use alternatives to in-state nursing homes
- restrict supplemental hospital payments to those hospitals that are in financial need
- implement all federally approved cost-sharing options
- provide incentives to reduce emergency room visits
- cut optional benefits
- expand use of telehealth services
- use more mid-level providers for primary care
- adopt a managed fee-for-service payment system for providers
These strategies will allow states to achieve greater cost efficiency while still adhering to federal regulations.
Introduction
Medicaid is consistently among the top two expenditure categories in every state budget, but Medicaid spending levels vary greatly among states.1 This paper questions the assumption that high-spending states achieve better health outcomes compared to those that limit their Medicaid costs. It then explores state policies that lower, or at least restrain, the growth of Medicaid costs.
Medicaid is a poorly designed program that creates bad incentives, both for states administering the program and for potential Medicaid beneficiaries. Ideally, the program should be phased out, or at least radically reformed at the federal level. But now that the program has been in place for almost six decades, it has become so deeply embedded in the nation’s health care system that any attempts to significantly alter it will face stiff resistance from patients and providers who have come to depend on its current structure.
Program History
In 1945, President Harry Truman first proposed a national health insurance program.2 Truman’s attempts ended in failure. However, as part of the 1950 Social Security Amendments, Congress ultimately included “federal matching funds … for direct payments made by the States to doctors, hospitals, or other persons furnishing medical care.”3 These matching grants were expanded by additional Social Security Amendments in 1956 and 1958. In 1960, Congress passed the Kerr-Mills Act, which established the Federal Medical Percentage, later renamed the Federal Medical Assistance Percentage (FMAP), as a function of state per capita income and added matching grants for elderly individuals who were not eligible for Social Security.4
In 1965, drawing on the institutional framework provided by Kerr-Mills, Congress passed the 1965 Medicare and Medicaid Act, also known as the Social Security Amendments of 1965. In drafting the 1965 act, Congress spent more time considering the design of Medicare than that of Medicaid.5 As a result, Medicaid program costs rapidly exceeded initial expectations. One example of Congress’s carelessness with respect to Medicaid’s design can be seen in Section 1901 of the Medicare and Medicaid Act:
For the purpose of enabling each State, as far as practicable under the conditions in such State, to furnish (1) medical assistance on behalf of families with dependent children and of aged, blind, or permanently and totally disabled individuals, whose income and resources are insufficient to meet the costs of necessary medical services, and (2) rehabilitation and other services to help such families and individuals attain or retain capability for independence or self-care, there is hereby authorized to be appropriated for each fiscal year a sum sufficient to carry out the purposes of this title. The sums made available under this section shall be used for making payments to States which have submitted, and had approved by the Secretary of Health, Education, and Welfare, State plans for medical assistance.6
This language contained two flaws that resulted in rapid cost escalation. First, no specific appropriation was included, so there was no limit to the overall size of the program. Second, qualification criteria were not rigorously defined: the definition of those “whose income and resources are insufficient to meet the costs of necessary medical services” was left to each state.
New York State responded by creating a state Medicaid program with liberal eligibility requirements. It set an income ceiling of $6,000 (approximately $58,000 in 2023), which at the time meant that 45 percent of Empire State residents could qualify. California enacted much lower income thresholds but did not try to limit provider payment rates, allowing doctors and other health care providers to bill the state based on a “usual and customary” standard, in the sense that there were no discounts in the price each physician would charge patients who were on Medicaid.7
In 1965, Medicaid was expected to cost the federal government $950 million annually. But by 1967 it had become apparent that New York alone was going to propel federal Medicaid costs to unacceptable levels. After New York implemented its eligibility cap, federal actuaries at the Social Security Administration expected costs to reach $3 billion annually. A new set of Social Security Amendments adopted by Congress at the end of 1967 phased in a Medicaid income eligibility cap of 133.33 percent of the highest amount of cash assistance for a similar-sized family on Assistance to Families with Dependent Children. Despite federal limits and cost trimming in California, federal program costs still reached $2.8 billion in 1970.8
In 1982, Arizona became the last state to join Medicaid with its Arizona Health Care Cost Containment System (AHCCCS). The implementation of the AHCCCS required a demonstration waiver from the federal Centers for Medicare and Medicaid Services (CMS). This was because the AHCCCS was the first statewide plan to require all beneficiaries to participate in a managed care program, rather than obtain medical services on a fee-for-service (FFS) basis.9 Fee-for-service elements were added to the AHCCCS program later.
Prior to the AHCCCS, some states had experimented with small managed care programs, such as California’s pilot program in 1968. However, in the latter part of the 1990s, several states followed the AHCCCS’s example and obtained waivers from the Centers for Medicare and Medicaid Services that allowed them to transition a large proportion of their Medicaid population to managed care.10
The biggest change to Medicaid at the federal level was the implementation of the 2010 Patient Protection and Affordable Care Act (ACA), which expanded Medicaid to include anyone with an income of less than 138 percent of the federal poverty level (FPL). It limited the fiscal impact on states by implementing a higher federal cost share for the expansion population. The federal share started at 100 percent in 2014, then was gradually phased down to 90 percent by 2020, where it remained as of late 2023.11
The ACA Medicaid expansion was intended to apply nationwide. However, in 2012, the Supreme Court held in National Federation of Independent Business (NFIB) v. Sebelius that individual states could decide whether to participate in the expansion.12 Most states ultimately accepted the expansion, but as of late 2023, 10 states—including Florida and Texas, the second- and third-most populous states, respectively—have not implemented Medicaid expansion.13
Program Costs
Medicaid expenditures have grown steadily for decades and escalated even more rapidly during the pandemic. As seen in Figure 1, total state and federal Medicaid benefit costs grew an average of 6.43 percent between federal fiscal years (FY) 1995 and 2019, which was 3.62 percent above the rate of inflation. In federal FY 2020, costs grew 9.3 percent (7.99 percent in real terms). In FY 2021, these costs increased by a further 9.83 percent (4.89 percent in real terms). The federal share of Medicaid expenditures grew from 57 percent in 1995 to 65 percent in 2019 and rose further during the pandemic.
For FY 2021, Medicaid medical assistance program costs totaled $717 billion, of which $498 billion were covered by the federal government.14 In addition, Medicaid also incurred $31 billion in administrative costs and $21 billion in Children’s Health Insurance Program (CHIP) costs.15 This yields a final FY 2021 total cost of $769 billion.
With the ending of the pandemic health emergency and the forthcoming cycle of eligibility redeterminations, it is likely that Medicaid cost growth will slow or reverse in FY 2023 and FY 2024. After that, cost growth should resume. Between 2025 and 2032, the Congressional Budget Office expects federal Medicaid spending to grow faster than GDP.16
Medicaid Eligibility
Prior to the implementation of the Affordable Care Act, Medicaid-eligible groups included low-income families with dependent children, low-income pregnant women, blind and disabled adults, and senior citizens with limited income and assets even if they also qualified for Medicare.17 In states that expanded Medicaid, all individuals under age 65 with income below 138 percent of the federal poverty line became eligible irrespective of whether they have dependent children. The Children’s Health Insurance Program provides expanded eligibility to children in families with higher incomes and varied by state and age of the child. The District of Columbia had the highest CHIP eligibility caps, allowing children up to 18 years old with family incomes up to 324 percent of the FPL.18
Figure 2 shows the percentages of Medicaid-eligible individuals by group, based on 2019 data calculated by the Kaiser Family Foundation.19 Just over 21 percent of the eligible population is senior or disabled: groups that would be expected to have high ongoing health care costs. Remaining enrollees should be expected to use health care services less than average, although this larger group includes pregnant women and an unknown proportion of nonelderly adults and children with chronic conditions.
For dual-eligible individuals, Medicare provides the primary coverage, with Medicaid handling reimbursable charges not covered by Medicare.20 Medicare typically covers no more than 100 days of care in a skilled nursing facility, so any dual-eligible individual requiring an extended nursing home stay must seek coverage from Medicaid.21 To be eligible for Medicaid Skilled Nursing Facility coverage, an individual must be blind, disabled, or elderly, and must be below state-specific income and asset thresholds. In many states, the income limit was $2,523 monthly in 2022, and for most states the asset limit was $2,000.22
Medicaid’s Role in the Overall US Health System
According to CMS’s National Health Expenditure Data, Medicaid accounted for 18.1 percent of total US health consumption expenditures in 2021.23 The CMS projects that Medicaid’s share of total spending will decline between 2023 and 2026 as eligibility redeterminations trim the system’s case load, and then rebound later in the decade. By 2030, the Medicaid share is expected to return to roughly the 2021 level.24
On a per capita basis, Medicaid is considerably less expensive than Medicare largely because its enrollees are generally younger. In 2019, the average cost per Medicare beneficiary was $14,359 (excluding any out-of-pocket expenses) compared to just $6,556 per Medicaid beneficiary. There was substantial variation by beneficiary category: children cost $2,837 per capita while disabled individuals cost $19,588.25 Private health insurance costs per capita were lower than Medicaid, at $5,129, but this figure is not strictly comparable because it does not include out-of-pocket spending (out-of-pocket spending is very limited in Medicaid for deductibles and copayments).26
Medicaid provider reimbursement rates vary greatly by state. On average, these rates are generally below those offered by Medicare, which in turn are lower than private insurance rates. On average, Medicaid fee-for-service physician reimbursement rates in 2019 were 30 percent lower than Medicare rates.27 No reliable public data appear to be available for Medicaid managed-care reimbursement rates.
Low Medicaid reimbursement rates have been correlated with less willingness by physicians to accept new Medicaid patients rather than those with other types of coverage, but other research attributes the acceptance gap, at least in part, to physicians’ difficulty in obtaining reimbursement from state Medicaid programs.28 Another factor potentially impacting physician acceptance of Medicaid patients is that they are less compliant, that is, they are less likely to follow a doctor’s instructions and/or are less likely to attend appointments. This variable does not appear to have been tested in academic literature.
There are also large differences in hospital reimbursement rates by type of coverage. According to a 2020 Kaiser Family Foundation review, private insurers, on average, paid 199 percent of the Medicare rate for all hospital services.29 A 2017 Medicaid and CHIP Payment and Access Commission (MACPAC) analysis found that, nationwide, Medicaid hospital reimbursements were slightly higher than Medicare rates when supplementary payments were included, but MACPAC also found wide variation across states.30
Hospitals have claimed that Medicare and Medicaid reimbursement rates are insufficient to cover their operations, and academic research has identified an association between a hospital’s proportion of Medicaid patients and its risk of bankruptcy.31 The implication is that patients with private insurance are subsidizing Medicaid and Medicare patients. If that is the case, continued crowding out of private coverage by government programs could trigger widespread hospital financial distress unless reimbursement rates are increased or hospital spending is reined in.
Variation between State Medicaid Programs
Comparisons of state Medicaid program effectiveness and costs are complicated by differences in program eligibility and structure. While expansion states provide Medicaid benefits to all adults with incomes below 138 percent of the FPL—as determined by the Department of Health and Human Services—Florida, Texas, and other non-expansion states limit coverage to those who are in specific eligibility categories. To receive Medicaid coverage in these states, low-income adults must be pregnant, responsible for a minor, blind, disabled, in a household with a disabled individual, or over age 65.
Featured Media
Georgia, a non-expansion state, offers Medicaid coverage to adults outside the enumerated eligibility categories with income below 100 percent of the FPL if they work, volunteer, or receive training for at least 80 hours per month.
States also vary in the degree of coverage that they provide to immigrants. Under federal law, full coverage under both Medicaid and the Children’s Health Insurance Program is limited to immigrants who have been legal permanent residents of the United States for at least five years.32 Other immigrants, including those without legal status, are eligible for Emergency Medicaid coverage, which only covers treatment for conditions requiring immediate medical attention.33
Ten states and the District of Columbia have extended coverage to children and pregnant women that meet Medicaid eligibility requirements regardless of their immigration status. California, New York, Oregon, and the District of Columbia have further extended Medicaid coverage to some or all nonpregnant adults regardless of their immigration status.34 In 2022, California announced that it was providing Medi-Cal coverage to 286,000 undocumented immigrants.35 The state is solely responsible for the costs of this coverage aside from any services covered by the federal government under Emergency Medicaid.36
Although adult dental benefits are not a core element of the federal Medicaid program, many states offer them to varying degrees. According to the National Academy for State Health Policy, all but three states offer some level of Medicaid dental benefits to adults. Eight states offer adults only emergency dental care. The remaining states provide either limited or extensive coverage.37
All states provide dental benefits to pregnant women, but five offer them only on an emergency basis. Children receive dental coverage in all states due to a federal requirement.38
Hearing and vision benefits also vary. According to the Kaiser Family Foundation, 33 states provide coverage for eyeglasses and other visual aids, while 28 states provide coverage for hearing aids and other hearing devices.39 States generally cover eye exams but at varying frequencies, ranging from annually to once every three years.40
Although all state Medicaid programs offer certain behavioral health services, some states provide optional services, such as targeted case management, rehabilitative therapies, and stays at mental health institutions, among other services.41
States often receive federal permission to provide expanded services or implement other programmatic changes by obtaining federal waivers from the Centers for Medicare and Medicaid Services. As of April 2023, more than 600 state waivers were in effect or under consideration by the CMS.42 Most waivers are governed under Section 1115 of the Social Security Act, which “gives the Secretary of Health and Human Services authority to approve experimental, pilot, or demonstration projects that are found by the Secretary to be likely to assist in promoting the objectives of the Medicaid program.”43 Section 1915 of the act also provides waiver authorities related to managed care programs and for the provision of Medicaid services at home and in community-based settings, rather than at medical facilities.44
Spending Variability and Outcomes
Although Medicaid spending varies widely by state because of different enrollment rates and different costs per beneficiary, the evidence that additional spending translates into better health outcomes is lacking.
Figure 3 shows that, in 2021, the Medicaid enrollment rate ranged from 12.1 percent in Wyoming to 40.5 percent in the District of Columbia.
Many states should see lower enrollment rates in 2023 and 2024 due to post-pandemic Medicaid redetermination, which allows states to remove ineligible beneficiaries. All states paused redeterminations during the COVID-19 pandemic.
As shown in Figure 4, DC had the highest per beneficiary cost in FY 2021 at $14,261 per beneficiary. This spending represented a 10 percent increase from its 2019 spending per beneficiary figure of $13,071. Some states, however, have seen their cost per beneficiary drop. For example, Oklahoma saw a two-year 22 percent drop of nominal Medicaid per beneficiary spending, falling from $8,110 in 2019 to $6,275 in 2021.
For beneficiaries added to Medicaid by virtue of its expansion under the Affordable Care Act, the federal reimbursement rate is 90 percent. For other beneficiaries, the reimbursement rate, known as the Federal Medical Assistance Percentage, is determined by a formula as given in Section 1905(b) of the Social Security Act:
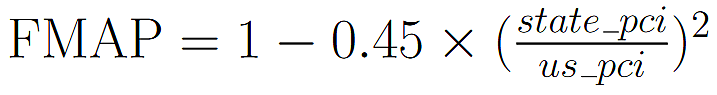
where pci is per capita income.45 This formula allows for states with a lower per capita income to receive increased Medicaid funding from the federal government. The FMAP’s share of the payment cannot be lower than 50 percent (or 56.2 percent with the Families First Coronavirus Response Act) nor higher than 83 percent. As Figure 5 demonstrates, in early 2023 (when the full FFCRA premium of 6.2 percent was still in force), Mississippi, West Virginia, and New Mexico had the highest FMAPs, at 84.22 percent, 80.33 percent, and 79.46 percent, respectively. On the other hand, a dozen states had the lowest allowable FMAPs of 56.2 percent.
Impact of Medicaid Spending on Health Outcomes
The descriptive statistics presented above show wide disparities in Medicaid spending. However, it is unclear whether higher Medicaid spending improves health outcomes.
The data that could be used to correlate spending and outcomes are sparse. The CMS has collected Medicaid quality data for several years, but most of the data series include only a subset of states and/or involve health system outputs rather than outcomes. The number of practitioner visits in which a beneficiary participated is an example of an output, whereas death and incapacity are examples of outcomes. The quantity of health care outputs may not determine a patient’s health. This situation can occur if particular services are ineffective or if the total quantity of services provided has reached the “flat of the curve,” a term coined by health care economist Alain Enthoven to refer to a point at which the marginal utility of additional services converges to zero.
Previous Research
In 2008, Oregon initiated a limited expansion of Medicaid, inviting residents who earned up to 138 percent of the federal poverty level to apply for Medicaid. Out of the approximately 90,000 applications received, 30,000 people were chosen to receive Medicaid. This provided researchers with an opportunity to conduct a small-scale randomized controlled trial on the effects of Medicaid on health outcomes.
As part of the trials, researchers interviewed 20,745 people who had participated in a lottery to receive Medicaid: 10,405 had been selected to receive Medicaid and 10,340 were used as the control group. The researchers tracked this sample group over a period of two years, conducting final interviews from September 2009 to December 2010. The researchers “found no effect of Medicaid coverage on diagnoses after the lottery or on the use of medication for blood-pressure and high cholesterol levels.” The only health outcome that the increased Medicaid coverage seemed to positively affect was the diagnosis and treatment of diabetes and depression. What was more worrying was the fact that Medicaid coverage increased annual medical spending by $1,172 per person and led to an “increase in the number of prescription drugs received and office visits made in the previous year.”46
The results found from Oregon are consistent with what is considered the gold standard of studies in the social sciences. In 1967, the RAND Corporation conducted a multiyear experiment to measure the effects of copayments on hospital utilization and health outcomes. The RAND researchers recruited 7,700 individuals and placed them into four groups. Individuals in one group received free health insurance. Individuals in the other three groups had to pay 25 percent, 50 percent, or 95 percent of their medical costs. RAND found that participants in the free plan visited physicians one to two more times than participants in the cost-sharing plans. Participants in the free plan also spent significantly more on health care. What was most significant about this study, however, was that participants in cost sharing did not experience any drop in the quality of the care they received.47
Both the Oregon and RAND studies show that an insurance plan that imposes no cost-sharing arrangements, like most Medicaid programs, may incentivize overutilization of medical resources without any corresponding improvements in health outcomes.
Medicaid and Health Outcomes: Current Empirical Trends
A well-designed health policy should reduce adverse health outcomes. From the above experiments, we see that a non-cost-sharing medical plan, like Medicaid, does not fulfill this objective. Such experimental results could also be triangulated with an examination of real-world data. Consider, for example, the relationship between state Medicaid spending per beneficiary and crude death rates.
Figure 6 shows the relationship between adult Medicaid spending per beneficiary and crude death rates (the number of deaths per 100,000 people) for individuals up to 64 years old. The trend line suggests that there is a slight inverse linear relationship between adult Medicaid spending and crude death rates. However, this trend line is by no means a good fit, and there are multiple exceptions. For example, in 2019 the per capita Medicaid spending in Utah was $5,794, while its crude death rate was 123 per 100,000 people. That same year, adult per capita Medicaid spending in Kentucky was $6,081, while the state’s crude death rate was 300 per 100,000 people. Comparing Utah and Kentucky shows that states with similar adult Medicaid per beneficiary spending still have large variations in health outcomes. Again, if Medicaid were an effective program, we should expect the relationship between Medicaid spending and crude death rates to be clearer and stronger.
One weakness of Figure 6 is that we analyze crude death rates for all individuals in a state, not only for Medicaid beneficiaries. Although we do not have Medicaid beneficiary death rates, the CMS does collect data on some Medicaid-specific health outcomes. One health outcome the agency measures is the prevalence of low birth weight, defined as the percentage of infants whose weight is under 2,500 g (about 5.51 lb.) at birth. Low birth weight increases the chances of health complications and is thus considered an adverse health outcome for the family.
We lack data for Medicaid-specific spending on obstetric care. In lieu of this, we use the Medicaid-Medicare obstetric fee ratio. This ratio, which has been published by Steven Zuckerman and colleagues at the Urban Institute since the late 1990s, takes the average of all reimbursement rates for Medicaid obstetric care. This value is then compared with the weighted average of obstetric fees for Medicare (which does cover births among its pool of beneficiaries who are below retirement age).48
Figure 7 shows the Medicaid-Medicare obstetric fee ratio and low birth weight percentage for infants born to Medicaid beneficiaries. There seems to be almost no relationship between increases in the obstetric care fee ratio and the prevalence of Medicaid low birth weight. Rhode Island, for example, has an obstetric care fee ratio of 0.4, the lowest in the nation, but it also has a Medicaid low birth weight rate of 7.9 percent. On the other hand, South Carolina has an obstetric care fee ratio of 1.36, the highest in the nation, yet South Carolina’s low birth weight rate is 10.9 percent, which places it relatively close to the national median.
Given all this, Medicaid does not seem to be an effective policy at improving a state’s health outcomes.
Medicaid Managed Care and Costs
Although Medicaid started as a fee-for-service program, it is now dominated by managed care. While relying on third parties to manage care costs is intuitively attractive, the case for using managed care for Medicaid is mixed at best. Indeed, states may benefit by replacing managed care with traditional fee-for-service arrangements.
There are multiple definitions of managed care. The Medicaid and CHIP Payment and Access Commission, for example, categorizes primary care case management (PCCM) schemes as a form of managed care.49 In contrast, the health policy think tank Kaiser Family Foundation excludes PCCM from its definition of managed care because PCCM does not fully replace fee-for-service.50
This section focuses on health care plans run by managed care organizations (MCOs), and thus excludes PCCM schemes. A further clarification must be made. Generally, MCO-managed plans are categorized as being partial or comprehensive. Partial managed care plans typically cover specific services, such as nonemergency medical transportation, behavioral care, and dental health. Comprehensive plans, on the other hand, cover a large variety of Medicaid services. This section only considers comprehensive managed care plans.
In July 2020, 72 percent of Medicaid beneficiaries were enrolled in comprehensive managed care, although the proportion varied widely by state. In Hawaii, for example, all Medicaid beneficiaries were enrolled in an MCO. Similarly, the comprehensive managed care plan enrollment rate in Nebraska was 99.5 percent. By contrast, Alabama, Alaska, Connecticut, Maine, Montana, South Dakota, and Wyoming made no use of comprehensive Medicaid MCOs.51
The heterogeneity of Medicaid beneficiaries and state policies makes it difficult to come to a firm conclusion as to whether managed care provides cost savings. Consider the differences between the comprehensive managed care plans in Arizona and Wisconsin. Wisconsin enrolls all its Medicaid beneficiaries in a comprehensive managed care plan called Badger Care Plus. However, beneficiaries who require managed long-term services and support are enrolled in another, more specialized plan.52 Meanwhile, Arizona’s main comprehensive plan covers managed long-term services and support.53 Notwithstanding these difficulties, researchers have attempted to analyze the interstate performance of comprehensive managed care plans in terms of cost savings. For example, a 2012 meta-analysis by Columbia University health policy professor Michael Sparer found a “paucity of evidence on cost savings from Medicaid managed care.” Sparer provided seven reasons for why managed care cost savings were less than expected. Some of these reasons include the already low Medicaid FFS rate, the lack of cost sharing, the costliness of developing an administrative infrastructure to handle managed care, and the federal “actuarially fair” requirement that allows MCOs to charge states with a higher capitation rate (the per member/per month fee that states pay to MCOs).54
Related to the issue of administrative infrastructure is the issue of administrative complexity. If MCOs and states have low-quality utilization data, they are not able to accurately calculate capitation rates. One common way to measure the appropriateness of the capitation rate is through the Affordable Care Act’s definition of the medical loss ratio (see Figure 8).55
The federal threshold for the ACA medical loss ratio is 0.85. In other words, all comprehensive MCO plans must spend at least 85 percent of their capitation rate revenue on claims and quality improvement. Capitation rates are usually set by one of three methods: using data of actual services provided by MCO plans; using equivalent fee-for-service data; or using an examination of an MCO’s financial statements.56 Of these three methods, most states rely on records of actual services provided to beneficiaries for setting and adjusting capitation rates.57 This data is called encounter data.
Unfortunately, MCOs have a historical problem with accurately reporting encounter data. This was first observed in 1996, when health care expert E. M. Howell noted the difficulties “with how best to replace FFS billing data with other comparable information on Medicaid enrollees in capitated managed care plans.”58
It was not until 2011 that the CMS created the Transformed Medicaid Statistical Information System (T‑MSIS), which acted as a central repository of encounter data. However, a 2017 Government Accountability Office report showed that only 18 states had submitted T‑MSIS data. Moreover, states that submitted T‑MSIS data had substantial issues with timely reporting, resulting in the inability to identify inappropriate billing and ensure accessibility to services.59 The CMS responded by identifying 12 focus aspects of T‑MSIS data quality, called the T‑MSIS Priority Initiatives. As of 2021, most states had only one to two priority initiatives that still did not meet the CMS’s requirements. These improvements were made, in part, only after the CMS tied FMAP reductions with failure to conform to priority initiatives requirements.60 Nevertheless, in the same year, the Government Accountability Office found that 23 percent of states submitted compliant data for inpatient encounters, and only 21 percent of states had submitted compliant data for other encounters.61 Without high-quality encounter data it becomes difficult for MCOs to calculate market-competitive capitation rates. Capitation rates may thus vary significantly from year to year, which makes it hard for states to project and control costs.
One example of the incorrect setting of capitation rates due to inadequate encounter data can be found in Idaho’s comprehensive managed care program for dual eligibles. An audit released in 2022 showed that one of Idaho’s MCOs was underreporting encounters by almost 73 percent during fiscal years 2019 and 2020.62 Subsequently, in FY 2021, the capitation rate for the MCO increased by 27 percent—from $1,453 in FY 2020 to $1,880 in FY 2021.63
Related Media
Apart from the above failures in reporting encounter data, there are also instances of MCOs paying for beneficiaries who are no longer on the Medicaid program. Many MCOs continue to receive capitation payments between the time that beneficiaries stop using the program and the time they are determined by the state to be no longer eligible for the program. For example, a beneficiary may move to another state or secure employment that includes a superior health plan. In these cases, the beneficiary will stop using the state’s Medicaid plan but will remain officially enrolled until the state performs a benefit redetermination.
MCOs have even collected capitation payments after covered beneficiaries died. The Department of Health and Human Services’ Office of the Inspector General has found evidence of MCO payments on behalf of deceased beneficiaries in 15 states.64
On the other hand, a 2020 meta-analysis by researchers at Emory University found some evidence of cost savings from Medicaid managed care, citing studies that showed promising results in Florida, Kentucky, and Pennsylvania.65 However, these results come with some caveats. One study the Emory meta-analysis examined was conducted by Daniel D. Maeng and colleagues at the Geisinger Health System, a managed care organization. These authors found that enrollees in Geisinger’s managed care plans in Pennsylvania had lower costs than the state’s Medicaid fee-for-service patients. However, the authors acknowledge that this was a result of Geisinger’s “data-driven” case management strategies.66 All we can conclude from this study is that a well-designed case-management scheme can reduce the costs of health care, which means that it might be possible for a state to implement a similar case-management scheme with fee-for-service beneficiaries.
Another study cited in the Emory meta-analysis was one by Georgia State University’s Makayla Palmer and colleagues, which found that managed care reduced costs in Kentucky for foster care children.67 It is not clear, however, whether these findings can be generalized beyond one highly vulnerable subpopulation.
Palmer and colleagues also cite Tianyan Hu and Karoline Mortensen’s study on Medicaid managed care patients in Florida. Hu and Mortensen found that managed care in Florida led to a 0.21–0.35 percent reduction in the growth of inpatient service usage.68 However, the study compared growth trends in Medicaid to those for private insurance, rather than changes across different Medicaid populations. Given this, Hu and Mortensen’s study is not conclusive evidence of the cost-savings potential of comprehensive managed care.
Another study cited by the meta-analysis can be interpreted as evidence of managed care’s cost-saving potential: Florida State University’s Jungwon Park found that Florida’s Medicaid managed care patients had a 7 percent shorter length of stay and 1.9 percent lower inpatient costs than comparable fee-for-service individuals.69 Such reductions are, by both the authors’ estimation and Park’s own account, quite small. However, when taken at the aggregate, Park claims that these cost savings may be “non-negligible.”70
The Emory University meta-analysis also cites a study of managed care’s impact on state budget predictability by Victoria Perez.71 This is the only study cited that considers the effect of managed care on public funds, rather than hospital costs. As such, it is more applicable for legislators. The study found no significant differences in the variability of fee-for-service and managed care Medicaid expenditures. These results still hold even when groups with high spending variability are excluded.
In conclusion, Medicaid managed care has been associated with cost savings in a limited number of situations, but overall, the economic case for managed care is unconvincing.
Other State Policies that Could Impact per Beneficiary Costs
If adopting managed care is not an effective strategy for reining in per beneficiary costs, do states have other options? This section lists some alternatives.
Physician Reimbursement Rates
States show substantial variation in their provider reimbursement rates within their fee-for-service programs. As noted earlier, Steven Zuckerman and colleagues at the Urban Institute periodically survey physician reimbursement rates and report them as a percentage of rates paid by Medicare. In their most recent survey, conducted in September 2019, the researchers found that Medicaid and Medicare fee ratios across all medical services ranged from 37 percent in Rhode Island to 118 percent in Delaware.72
Researchers and advocates of increased Medicaid spending often draw a connection between low reimbursement rates and the unwillingness of physicians to see Medicaid patients.73 But a recent natural experiment called the strength of that relationship into question. One provision of the Affordable Care Act raised the Medicaid-Medicare payment ratio to 100 percent nationally for calendar years 2013 and 2014 only. Health and Human Services analyst Sandra Decker reviewed physician acceptance rates between 2011 and 2015 and found that the temporary fee bump did not improve care accessibility for Medicaid beneficiaries.74
Other factors that may impact physician propensity to accept Medicaid patients include difficulties in obtaining reimbursement from state Medicaid programs and the perception that Medicaid patients are less likely to follow doctors’ instructions than others. As an example of the latter, doctors may believe that Medicaid patients would be more likely than others to not show up for appointments.75
Telehealth: A Partial Substitute for In-Person Physician Visits
Although patients have received medical advice by phone or over the internet for many years, interest in telehealth services skyrocketed during the COVID-19 pandemic. In theory, telehealth services are less expensive than in-person medical visits because of savings on office space and the opportunity to utilize medical professionals who work in lower-cost areas. But it remains to be seen whether state Medicaid programs can benefit from the savings that telehealth might offer.
During the pandemic, state Medicaid programs temporarily allowed telehealth reimbursements as an emergency measure and made these policy changes permanent in many cases. According to the Center for Connected Health Policy, Medicaid programs in all 50 states and the District of Columbia now reimburse providers for video health visits. Most state Medicaid programs also provide reimbursement for one or more other categories of telehealth, including audio-only visits; store-and-forward services (such as transmission and review of medical records by secure email); and remote patient monitoring.76
A January 2023 Massachusetts Health Policy Commission analysis found that telehealth services had limited impact on the state’s Medicaid costs. Telehealth visits replaced many types of in-person visits on a one-for-one basis, meaning that the total volume of services and provider reimbursement requests did not change markedly. At the same time, the state maintained parity in rates between in-person and comparable telehealth services. In its report, the commission recommended that the state extend payment parity for an additional two years to allow providers to develop and further improve their telehealth care quality.77
Providers could profitably operate with lower reimbursement rates if they were permitted to use less expensive staff by, for example, taking advantage of cost differentials across states. Even greater opportunities for savings would be possible if states were to reimburse service providers for using medical personnel in such low-cost countries as India, the Philippines, and Thailand. Although telehealth firms use offshore professionals for patients who pay privately, there are institutional restrictions on doing so with Medicare and Medicaid.
Public payers treat telehealth services as if they are rendered at the physical location of the patient. Therefore, to receive reimbursement, providers must adhere to the laws and regulations of the state where the patient is physically located at the time of the consultation, which means having a state license, participating in a multistate licensing compact, or falling under a licensing exception. While there are some telehealth-specific licensing exceptions for out-of-state providers located in other states, the Center for Connected Health Policy is not aware of any licensing exceptions for non-US providers.78
Hospital Reimbursement Rates
As with physician reimbursement, state payments to hospitals vary greatly. Unfortunately, comparative statistics are harder to find. MACPAC compared state hospital payments by stay for calendar year 2010.79 Unlike the physician reimbursement rate studies, MACPAC did not make comparisons to Medicare, and instead compared each state to the national average, adjusting for differences in local prices and case mix within each state. Using this approach, the commission found that New Hampshire had the lowest adjusted payment rate, at 49 percent of the national average, while the District of Columbia had the highest rate, at 169 percent of the national average.80
More recent MACPAC data also show variability in payment policies across states. For example, the commission found that most states pay hospitals a fixed fee based on the diagnosis related group associated with the admission. On the other hand, four states paid per diem rates.
States also make supplemental payments to hospitals. In 2021, these supplemental payments exceeded base hospital payments. Medicaid supplemental payments fall into five categories: disproportionate share, upper payment limits, uncompensated care pool, delivery system reform incentive payments, and graduate medical education payments. The disproportionate share consists of statutorily required payments to hospitals that serve a high share of Medicaid and low-income patients. The upper payment limits are lump-sum payments that are intended to cover the difference between Medicaid base payments and the amount that Medicare would pay for the same service. The uncompensated care pool includes additional funds that are used to compensate hospitals to provide uncompensated or “insufficiently compensated” care to patients who are uninsured or underinsured. The delivery system reform incentive payments are targeted payments to encourage hospitals to improve health care quality and access, and these state programs are authorized under CMS waivers. Graduate medical education payments are amounts paid to teaching hospitals to pay for training costs and to compensate them for taking a greater share of severe cases.81
Despite the availability of these supplemental payments, industry experts at the major rating agencies generally regard a high concentration of Medicaid patients as presenting financial risks for hospitals. All three major credit rating agencies treat a high percentage of Medicaid payments as a credit negative when assessing hospital bonds. In its hospital rating criteria, S&P states:
Medicaid and Medicare, both government-sponsored payers in the U.S., typically have reimbursement rates below commercial insurers. Medicaid is often subject to cuts or eligibility changes as a result of state and federal policy changes. Medicare in general offers rates that while below commercial payers, are typically better than Medicaid rates. Reliance on Medicare and Medicaid for a majority of revenue, when these programs often pay below cost, is a risk because costs must then be covered by substantially higher rates from commercial payers.82
Moody’s hospital rating methodology concurs with S&P’s assessment. In fact, Moody’s lowers the credit ratings of hospitals whose Medicaid revenue exceeds 47 percent of their total revenue.83 Fitch Ratings takes a more aggressive approach, downgrading a hospital’s credit rating if more than 25 percent of its revenue comes from Medicaid and/or self-pay.84
Concern about hospital financial risk often focuses on smaller rural facilities that have a high concentration of Medicare and Medicaid patients. According to the American Hospital Association, in 2020 rural hospitals received $1.2 billion less from state Medicaid programs than the cost they incurred for services they provided to Medicaid patients.85
Larger health systems can more easily absorb lower revenue for Medicare and Medicaid patients. Table 1 shows FY 2021 results for four of the nation’s largest nonprofit health systems, taken from their audited financial statements.86
While these systems were generally “profitable” in 2021 (they generated positive net revenues, even though they are officially nonprofit), three that have already reported 2022 results experienced net operating losses.
Some large hospital systems also offer large compensation packages to senior staff. For example, 19 employees at CommonSpirit Health received more than $1 million in total compensation in fiscal year 2022, while Trinity Health had a dozen employees receiving seven-figure compensation.87
Finally, hospitals may employ a large proportion of individuals who do not provide patient care. At the macro level, prior research has found that from 1975 to 2010, the number of health care administrators increased 3,200 percent, and that by the 2010s there were roughly 10 administrators for every doctor.88
In California, staff allocation to administrative categories varied widely, according to 2020–2021 full-time equivalent staffing data collected by the state’s Department of Health and Human Services. One hospital that employed a particularly large number of administrative staff was Cedars Sinai Hospital in Los Angeles. That institution employed 467 full-time equivalent employees in patient accounting, 385 in data processing, 277 in central services and supplies, and 203 in nursing administration, collectively accounting for more than 13 percent of the hospital’s full-time equivalent staff.89
Hospitals that are realizing positive net revenues, offer high executive compensation, and/or employ a relatively large proportion of administrative staff should not require Medicaid supplemental payments to continue offering patient services. To the extent possible, states should focus their supplemental payments on hospitals that are truly at risk of closing and thus becoming unable to serve Medicaid patients.
Deterring Emergency Room Use
Data from the US Centers for Disease Control and Prevention (CDC) show that Medicaid beneficiaries visit emergency rooms (ERs) more frequently than individuals with private coverage, Medicare beneficiaries, and even the uninsured. Because ER visits are so expensive, the federal and state governments could realize large cost savings by reducing the gap in ER utilization between Medicaid beneficiaries and other individuals.
Figure 9 shows ER utilization rates by coverage type in 2019, which are probably more indicative of post‐pandemic usage than data from more recent years. Utilization rates across all four categories fell in 2020—the last year for which the CDC has published data—as fear of COVID-19 exposure kept prospective patients away from hospitals.
The gap between Medicaid and uninsured ER use seems counterintuitive. Uninsured individuals should have difficulty accessing many nonemergency medical services, but emergency rooms cannot turn anyone away if the hospital participates in Medicare, as almost all hospitals do. On the other hand, hospitals may charge uninsured patients for services they receive in the ER, and the fear of a large bill is likely to deter many from visiting.
While Medicare and privately insured patients are insulated from such large hospital bills, they usually face a significant copayment. Government survey data show that ER copays of $100 to $250 are most common for privately insured patients, but some pay up to $1,000.90
By contrast, most Medicaid beneficiaries face little or no out‐of‐pocket costs for ER services. The Centers for Medicare and Medicaid Services gives states the option to charge Medicaid patients up to $8 if they visit an ER without having a true medical emergency.91 But as of 2020, only 14 states enforced this copayment provision, and some categories of beneficiaries are exempt (e.g., children and pregnant women).92
One state that attempted to address the ER incentive problem is Kentucky. In 2018, the state obtained a waiver from CMS allowing it to implement a rewards program for certain Medicaid beneficiaries.93 Under this program, each qualifying Medicaid beneficiary receives an account that can be used for health‐related benefits that are normally excluded from the state’s program, including certain dental and vision services, over‐the‐counter medications, and gym memberships.94 The state deposits funds into a beneficiary’s account whenever the individual completes a recommended healthy activity, such as getting a checkup, receiving a flu shot, or participating in a tobacco cessation program.95
Originally, Kentucky planned to deduct funds from a beneficiary’s rewards account if the beneficiary visited an ER without suffering a medical emergency. The deduction would range from $20 for the first unnecessary visit to $75 for the third such visit. However, this measure was dropped after Gov. Matt Bevin failed to win reelection.96
Since the deduction scheme was not fully implemented, its effects cannot be assessed.
Expanded Scope for Nurse Practitioners, Physician’s Assistants, and Nurse Midwives
While Medicaid beneficiaries have little or no financial disincentive to visit the emergency room, they may not be able to access less costly alternatives. As noted above, physicians are much less likely to accept new Medicaid patients than privately insured patients or those with Medicare coverage. As a result, many Medicaid beneficiaries who do not have a primary care doctor will tend to visit the ER as their first medical care option.
Improved access to primary care could reduce ER utilization. If physicians are unwilling to accept more Medicaid patients, nurse practitioners (NPs) and physician’s assistants (PAs) could care for this population. Similarly, certified nurse midwives can attend to the needs of pregnant Medicaid beneficiaries if obstetricians are unavailable. These professionals are qualified to provide primary care and may be willing to do so at a lower cost than physicians, who are typically required to complete at least seven years of medical school and residency. Academic research has shown that NPs and PAs provide similar or better care in many categories than physicians.97 Moreover, NPs and PAs can achieve an even higher standard of care with the assistance of artificial intelligence tools.98
States have varying policies regarding NP and PA scope of practice. Many states allow these practitioners to work independently, while others require them to work under the full or partial supervision of a physician.99
Some states reimburse NPs and PAs at lower rates than physicians. At the low end, Kansas and Kentucky reimburse these practitioners at 75 percent of the physician rate.100 At the high end, Wisconsin reimburses PAs at 90 percent of the physician rate and allows NPs to use the physician’s fee schedule.101
At the federal level, nurse practitioners are seeking payment parity with physicians in the Medicare program.102 States often reference Medicare when developing their Medicaid reimbursement policies, so it is possible that Medicaid rate payment differentials will narrow in the coming years.
Medicaid Premiums, Deductibles, and Copayments
Cost sharing can reduce Medicaid’s impact on state budgets by offsetting a portion of expenditures and deterring beneficiaries from overusing provider services. But, as noted above, federal law greatly restricts the use of cost sharing in Medicaid, and states often do not implement or enforce their remaining cost-sharing options.
Federal regulations prohibit any cost sharing for Medicaid services rendered to children, pregnant women, and patients in hospice care. They also prohibit charges for emergency services and family planning services and supplies. For those beneficiaries and services potentially subject to cost sharing, any charge must be “nominal,” as defined by the Secretary of Health and Human Services.103
As of 2013, CMS limited Medicaid deductibles to $2.65 and managed care copayments to $4.00 for most affected beneficiaries. Fee-for-service copayments of $8.00 were allowed for nonemergency use of the emergency room (as mentioned above) and for nonpreferred drugs (medicines that are not on the Medicaid preferred drug list but that perform the same functions as many of the drugs on the list). For hospital and other institutional care, states can require copayments of $75 for beneficiaries whose income is less than the federal poverty level and 10 percent of the state’s cost for those with income between 101 percent and 150 percent of the FPL.104 States are allowed to charge higher copayments and premiums to Medicaid beneficiaries with income above 150 percent of the FPL, but individuals at this relatively high income level represent a small share of the Medicaid population.105
States can seek waivers from these federal regulations that include higher levels of cost sharing, but such waivers have not been supported by the current administration. In January 2022, the CMS rejected Georgia’s plan to charge premiums to individuals who would be eligible for expanded Medicaid coverage in other states, and it instructed Arkansas and Montana to roll back policies that included premiums charged to beneficiaries with incomes of below 150 percent of the FPL.106 The CMS denials came on the heels of an executive order instructing federal agencies to examine all state waivers that reduce or undermine Medicaid coverage.107
In a 2020 survey of state Medicaid policies, the Kaiser Family Foundation and the Georgetown University Center for Children and Families found that, of the states that had implemented Medicaid expansion, 13 states plus the District of Columbia did not implement any form of cost sharing for nondisabled adults. Of the 22 states that had some form of cost sharing, most did not assess federally authorized maximums across all service categories.108
Even if states have cost-sharing provisions, they also have policies that effectively render such provisions ineffective. Arizona’s Medicaid plan states that providers cannot deny care to Medicaid beneficiaries who cannot afford copayment.109 West Virginia’s Medicaid program guide states that “providers may not deny services to individuals whose household income falls below 100 percent of the federal poverty level due to their inability to make a copayment.”110 Idaho’s Medicaid administrative code also allows providers to provide a written policy for when they may choose to waive copays.111
A 2021 Kaiser Family Foundation literature review of the impacts of Medicaid cost sharing reports that out-of-pocket costs are associated with adverse health outcomes.112 However, most of the cited studies do not involve Medicaid. For example, one of them assessed high-deductible commercial health plans. The authors defined high-deductible plans as those that require the insured member to pay $1,000 or more before benefits became available.113 That is significantly above the $2.65 deductible CMS allows under Medicaid.
Work Requirements
Another state strategy that might reduce Medicaid costs is to require beneficiaries to work. If a work requirement dissuades an individual from participating in Medicaid, the state may realize budgetary savings, but this effect runs contrary to the widely held belief that all Americans should have some form of health care coverage. Furthermore, work requirements run against the policy of the Biden administration.
State Medicaid work requirements, which require a federal waiver, were not implemented prior to the Trump administration, when CMS approved work requirement waivers submitted by 13 states. Nine others submitted waiver requests that were subsequently withdrawn or not approved before Trump left office. Of the 13 states that originally secured waivers, some never implemented work requirements or suspended them during the COVID-19 pandemic.114
The Biden administration has opposed Medicaid work requirements, given its interest in achieving universal coverage. Most states that obtained approvals under the prior administration have stopped implementation. The only exception is Georgia.
On July 1, 2023, Georgia implemented its Pathways to Coverage program, which offers Medicaid coverage to residents ages 19–64 who have a household income of up to 100 percent of the FPL and who are not eligible for traditional Medicaid. Qualifying activities include full- or part-time employment and participation in training programs, community service, or enrollment in higher education.115
Georgia was able to implement this program because it has not accepted Medicaid expansion. Had it expanded Medicaid, the group eligible for Pathways to Coverage would have been automatically eligible for Medicaid instead. Although CMS, under the Biden administration, had originally rejected Georgia’s waiver, a federal district court judge overruled CMS’s decision and allowed Georgia to move forward with its program, concluding that Pathways was having the effect of increasing Medicaid coverage in Georgia.116
Because Pathways is not a full Medicaid expansion, it is not eligible for the 90 percent FMAP reimbursement rates provided to expansion populations.117 As a result, on a per beneficiary basis, Pathways has a larger state budgetary impact on Georgia than a Medicaid expansion would have had.
Medicaid work requirements are not a viable path to achieving budgetary savings unless and until the federal government becomes more supportive of them. That said, state policymakers interested in encouraging individual responsibility might still see conditioning Medicaid eligibility on some level of effort from the beneficiary as a policy worth pursuing.
Reducing Nursing Home Costs
Federal and state governments paid more than $60 billion for nursing home care through the Medicaid program in 2019. While nursing home care is costly, its quality varies and can often be quite poor. Through policy change, it should be possible to improve outcomes for seniors and disabled individuals who require long‐term care, while reducing the cost to taxpayers.
Medicaid paid an average of $244 per resident per day for nursing facility care in 2019, according to a Medicaid and CHIP Payment and Access Commission analysis.118 For patients who must reside in a nursing home permanently, this works out to more than $89,000 per year. That does not include costs for therapy and other ancillary services or the patient’s share of nursing home fees, which are deducted from their Social Security benefits and other sources of income.119
While the cost of nursing home care is high on average, it varies widely across the country.120 It is especially expensive in Alaska and Hawaii, where interstate competition is limited by geography. But in the contiguous 48 states, states with relatively high nursing home costs may be adjacent to states with much lower costs. In 2021, the average cost of a shared room in North Dakota was $394, but it was only $234 in South Dakota. Other contiguous states with such large disparities were Minnesota ($381) and Wisconsin ($297), and West Virginia ($382) and Kentucky ($236).
This pattern suggests that some states could save money by placing residents in out‐of‐state nursing homes. Remote placements should require the beneficiary’s informed consent (which is not possible for those suffering from advanced dementia) and perhaps some financial incentive.
One objection to out‐of‐state placements is that friends and family would have to travel farther to visit residents, but one 2010 study by the CDC’s National Center for Health Statistics found that 60 percent of nursing home residents do not receive visitors. A large proportion of residents in nursing homes did not have children, while in other cases they have no living children.121
Some prospective nursing home residents without family ties may even prefer facilities outside the United States, which may not only be more affordable, but also provide residents with a higher standard of care. Facilities in Mexico, for example, can take advantage of lower personnel and real estate costs. It has already become common for Americans to retire to Mexico and obtain medical services there.122 The country also has assisted living facilities, some of which provide a continuum of care up to and including nursing facilities.123 One challenge of housing Medicaid beneficiaries in Mexico is that Medicare coverage is not available outside the United States.
A common alternative to nursing homes in California is the “board and care home,” which is a residential home that is equipped and staffed to provide daily living assistance to a small number of residents.124
Nurses also visit board and care homes to provide more specialized services. So, for most individuals who might otherwise reside in a nursing facility, a board and care home is a viable lower‐cost option. These facilities operate with lower overheads and do not have to pay onsite registered nurses or physicians. Because the setting is in a home rather than a large institution, both residents and visitors may find the prospect of an extended stay more amenable.
In most of the United States, this type of facility is either unavailable or ineligible for Medicaid reimbursement. But California has obtained an assisted-living waiver from the Centers for Medicare and Medicaid Services to include some of these facilities in Medi‐Cal, the state’s Medicaid program.125 Although this waiver is not available everywhere in California, it is offered in most of the state’s high‐population counties.
Under the waiver, Medi‐Cal can compensate board and care homes for the services they provide to patients aside from the cost of the room and meals, which are instead funded by the resident’s Social Security benefits. Services covered by Medi-Cal include assisting residents to perform daily living activities.126 Depending on the level of assistance that residents need, Medi-Cal’s daily reimbursement rates for board and care homes range from $89 to $250, averaging $183.50 daily.127 By contrast, Medi‐Cal skilled nursing facility reimbursement rates ranged from $118 to $517, averaging around $294 in FY 2023.128
Although the assisted-living waiver appears to be unique to California, it is part of a larger CMS waiver program called Home- and Community-Based Services, which funds various nursing home alternatives in 16 states.129
Nursing homes are often quite expensive and do not necessarily provide a high level of service. Alternative facilities, whether located nearby, in another state, or even over an international border, may be able to provide a higher quality of life for those needing long‐term care at a lower cost.
Policy Recommendations
The most plausible federal Medicaid reform would be replacement of the FMAP with a fixed Medicaid block grant that states can use as they see fit. In a 2018 analysis, Cato Institute fiscal policy scholar Chris Edwards noted that turning Medicaid into a block grant program would give states more flexibility to design cost-effective Medicaid plans.130
Related Media
While the existing federal system remains in place, states can make limited reforms within program guidelines and by obtaining federal waivers. Among the reforms states should consider in this context include:
- Review optional benefits (those not required by the federal government), as well as the provision of coverage to recent immigrants.
- Consider replacing comprehensive managed care arrangements with managed fee-for-service arrangements like the one implemented by Connecticut.
- Divert more Medicaid beneficiaries to lower-cost primary care providers, including nurse practitioners, physician’s assistants, and certified nurse midwives.
- Maximize utilization of telehealth services to the extent that reimbursement rates for them are significantly below those for in-person services.
- Deter unnecessary emergency room visits by providing appropriate disincentives. Aside from enforcing the federally allowed $8 copayments, states should consider Kentucky’s short-lived approach of providing Medicaid beneficiaries with medical savings accounts in which the balances are reduced by much larger copayments for nonemergency visits to hospital emergency departments than for true emergency visits.
- Implement all cost-sharing options that are available under federal regulations to reduce unnecessary provider visits, and require providers to enforce them.
- Reduce dependence on costly nursing homes by relying more on board and care homes and other home- and community-based services.
- Consider placement in lower-cost states for patients who require extended nursing home stays and who do not normally receive visitors.
- Reduce or eliminate supplemental payments to hospitals that do not exhibit financial distress because they serve a large proportion of Medicaid patients. Hospitals that have accumulated large amounts of net assets, pay high executive salaries, and/or employ a high proportion of administrative staff should be able to make adjustments and continue to operate with less state support.
Although work requirements could generate cost savings, this idea is not included in the above list because it is contrary to the current administration’s policy. Similarly, any plan to roll back Medicaid expansion would likely face resistance at the federal level.
Conclusion
While the goal of providing medical care to society’s neediest is an admirable one, the Medicaid program is not a cost-effective way of achieving it. As it was initially conceived in 1965, the program was deeply flawed and required reforms almost immediately. Furthermore, a patchwork of reforms and expansions added since the program’s creation has contributed to waste and inefficiency.
As fiscal pressures build in the coming years, Congress needs to become more open to overhauling Medicaid in a way that gives states greater latitude to provide more cost-effective health care services to the needy.
In the interim, policy opportunities at the state level amount to tinkering around the edges. But in the context of a program as large as Medicaid, such tinkering could find significant cost savings in many states. Payments to nursing homes, hospitals, and managed care organizations warrant special attention, while states should use whatever measures they can to dissuade beneficiaries from making unnecessary use of medical services.
Citation
Joffe, Marc, and Krit Chanwong. “Containing Medicaid Costs at the State Level,” Policy Analysis no. 967, Cato Institute, Washington, DC, February 6, 2024.

About the Authors


This work is licensed under a Creative Commons Attribution-NonCommercial-ShareAlike 4.0 International License.