
To promote debate and help improve U.S. decisionmaking about arms sales, we created the Arms Sales Risk Index, now in its fifth year. By measuring the factors linked to negative outcomes of arms sales, such as dispersion, diversion, and the misuse of weapons by recipients, the index provides a way to assess the risk involved with selling arms to another nation. Though this sort of assessment is by no means an exact science, and we focus here only on the potential downsides of sales, the Arms Sales Risk Index can help policymakers consider the dangers of U.S. arms sales policy more rigorously and make better decisions about which nations should and should not receive U.S. weapons.
This year’s report has three sections. In the first, we present this year’s data. We find little evidence that selling more American weapons to a country correlates with a decrease in that nation’s risk score over time.
In the second section, we show that the Biden administration has not departed from the American tradition of selling arms to risky nations. That said, compared with the George W. Bush, Barack Obama, and Donald Trump presidencies, Biden’s sales have been relatively low risk.
Finally, in the third section, we present three brief case studies to examine one of the most common arguments in favor of arms sales: their ability to produce leverage over recipients. We show that arms sales do not produce much leverage and that the risks of reverse leverage—recipient nations influencing American behavior—are underappreciated.
2022 Trends in Arms Sales Risk
Arms sales are a fundamental way that presidents conduct foreign affairs. Since 2009, the United States has delivered over $444 billion in arms sales to foreign countries. Nonetheless, these sales can draw the United States into wars, lead to weapons dispersion arming enemies, and fuel instability around the world. Congress recently has tried to reduce these risks by legislating against the president. In the 2023 House version of the National Defense Authorization Act, there were 25 pieces of legislation that attempted to reduce risks in arms sales. Due to the sheer number of sales, the risks associated with those sales, and congressional interest in this aspect of foreign policy, understanding the negative consequences is key to passing effective legislation in the future.
Related Event
Historically, the actual dollar figure of weapons delivered to foreign countries has been significantly less than what was initially authorized. This is because most weapons sales occur before the weapons are built, and the informal hold process before congressional notification can result in changes to the initial sale.1 Because arms sales deliveries occur years after the sale, these data inherently lag by multiple years, which means that there would be time for an arms sales notification to affect a recipient’s risk score. For example, the United States announced the transfer of National Advanced Surface-to-Air Missile Systems (NASAMS) to Ukraine and an official sale in May 2023. Despite sped-up arms deliveries during the war, two of the NASAMS were not delivered until November 2022, and the remainder will take years to deliver.2 The lag between notifications and deliveries of weapons allows us to examine the correlation between risk data and arms sales.
Mapping Risk
We constructed the Arms Sales Risk Index by identifying four different causal pathways by which arms sales might lead to negative outcomes. These four “risk vectors” include a country’s level of corruption, its level of instability, its treatment of its people, and the level of conflict, both internal and external, in which it is engaged. To measure these and to calculate the overall risk score for each nation, presented in Table 1, we average their scores on six independent indices (two factors combine two indices, whereas the other two rely on a single index). See Appendix A for a complete methodology.
Corruption: Corruption makes it more likely that weapons will be stolen or sold to unintended customers.3 To assess this factor, we rely on Transparency International’s Corruption Perceptions Index, which ranks 180 countries and territories by their perceived levels of corruption.
Instability: Instability also correlates with a much higher likelihood of weapons being stolen or misused by governments and other groups.4 We assess instability using the Fragile States Index, produced by the Fund for Peace.
Domestic human rights: States that have a poor record of human rights and/or regularly use violence against their citizens pose a greater risk of misusing weapons.5 We rely on two indices to measure these factors: Freedom House’s Freedom in the World Index and the Cato Institute and Fraser Institute’s Human Freedom Index’s expression and information score.
Conflict: States engaged in conflict are inherently riskier when it comes to factors such as dispersion, blowback, entanglement, and human rights abuses.6 To assess these risks, we rely on the Global Terrorism Index and the Uppsala Conflict Data Program/Peace Research Institute Oslo Armed Conflict Dataset.
As Tables 1 and 2 show, the United States’ five biggest customers have received an average of nearly $14.3 billion in weapons since 2009. They also demonstrate that the United States sells to a variety of clients that are incredibly risky, notably Saudi Arabia.
Table 1 provides a global view of risk index scores on a scale of 1 to 100, with 1 being the lowest risk and 100 the highest risk. In 2021, the average country’s risk score was 45, up three points from the prior year. Table 2 shows the arms deliveries in billions of U.S. dollars for the top-10 U.S. buyers since 2009.
Figure 1 shows the level of risk throughout the world; high‐risk zones are somewhat predictable year to year. Figure 2 shows the top U.S. customers and their risk scores.
According to the Security Assistance Monitor, in 2021, the Biden administration brokered weapons sales through the Foreign Military Sales process worth nearly $74 billion, or a total that is 44 percent lower than the final year of the Trump administration.7 It is difficult to tell whether Biden’s changes will be permanent, but there have been signs of a decreased tolerance for risk since he took office. For example, the president’s recently released “Memorandum on United States Conventional Arms Transfer Policy” stated, “United States foreign policy and national security objectives are best advanced by facilitating arms transfers to trusted actors who will use them responsibly.… When not employed responsibly, defense material can be used to violate human rights and international humanitarian law, increase the risk of civilian harm, and otherwise damage United States interests.”8 However, it is possible that this is a sign of Washington’s biggest customers becoming less risky and not a specific policy change. Most of the top-10 buyers’ risk scores have decreased. The top-25 buyers average risk score decreased by an average of three points over five years, bringing that average below the global average (43 compared to 45).
Weighting each customer’s risk score by the monetary value of each sale allows us to calculate the average customer risk score for a given seller. By restraining sales to Saudi Arabia earlier on and selling less to risky countries than previous administrations, the Biden administration has reduced risk in the U.S. weapons sales process.
Using the 2021 risk index score as a base year and then weighting each customer’s risk score by the monetary value of each sale, Biden’s average customer risk is the lowest score on record, 38.4. The Barack Obama administration had the highest average customer risk with a score of 45, followed by the Donald Trump administration at 41.13, and the George W. Bush administration at 40.71. There are two reasons for this. First, Afghanistan has ranked as one of the five riskiest customers for every risk index, but Trump and Biden sold fewer weapons to Afghanistan than Obama. During the last year of the Obama administration, the United States delivered over $322 million in weapons to Afghanistan and over $1 billion across his administration. By comparison, the Biden administration delivered roughly $200 million less than Obama’s final year.
Second, Biden’s biggest customers have tended to be some of the least risky. Out of his administration’s top-10 customers, five of the major recipients are Australia (risk score of 26), Japan (risk score of 18), Taiwan (risk score of 14), South Korea (risk score of 20), and the United Kingdom (risk score of 30). In essence, half of the Biden administration’s top customers are fairly low risk.
From a total value perspective, military aircraft and their parts continue to make up most U.S. exports over the past year, with ground vehicles coming in second and bombs and missiles third. Figure 3 provides a detailed breakdown of arms sales categories for 2019 and 2020.
Figure 4 shows the weighted risk of arms sales for each administration. As noted, Biden’s average customer risk score is lower than previous presidential administrations.
Nonetheless, it is impossible to tell if this diminishing risk is sustainable, and it is important to note that the Biden administration is still transferring significant amounts of weapons to risky clients. Out of the buyers who purchased more than $1 billion in U.S. weapons since 2009, the average risk score is 43, and states that rank in the top quartile of the risk index play a prominent role. Out of these countries, some of the riskiest countries that the Biden administration has delivered weapons to include
- Saudi Arabia (risk score of 73, over $3.4 billion in weapons received since 2021);
- India (risk score of 57, over $1.15 billion in weapons received since 2021);
- United Arab Emirates (risk score of 57, over $1.14 billion in weapons received since 2021);
- Turkey (risk score of 74, over $728 million in weapons received since 2021);
- Egypt (risk score of 73, over $368 million in weapons received since 2021);
- Pakistan (risk score of 69, over $324 million in weapons received since 2021);
- Colombia (risk score of 55, over $252 million in weapons received since 2021); and
- Afghanistan (risk score of 92, over $122 million in weapons received since 2021).9
Figure 5 shows the countries that have the 10 largest increases and decreases in risk scores over the five years that we have collected data.
The Arms Sales/Risk Connection: Testing the Assumed Strategic Benefits
Arms sales advocates’ hope that countries receiving U.S. weapons eventually have lower risk scores. The United States has sold weapons with the intention to increase regional stability, for example, or to help governments contain terrorism and insurrection.10 Lower risk scores might also occur because arms sales provide the United States leverage to stop countries’ risky behavior.
Related Media
An example of this is the Philippines. The Congressional Research Service argues that “at various times during the past decade and a half, Congress has restricted military and other security assistance to the Philippines in order to encourage improvements in human rights practices of the Philippine military, police, and government.”11 We only have five years of risk score data, but if advocates are correct, then we should expect to start seeing some degree of improvement in risk factors among the nations receiving U.S. weapons.
The world is riskier by three points since we began collecting data in 2018. Figure 6 breaks arms-purchasing countries into quintiles.
Nonetheless, because our conflict vectors include a categorical variable (the Uppsala Conflict Data Program/Peace Research Institute Oslo Armed Conflict Dataset), there are potential for outliers. This is the case with Kuwait, which when we started collecting data was supporting the Saudi Arabian war in Yemen but stopped shortly thereafter. This meant that its conflict score decreased from 100 (an active participant in war) to 1 (no participation in war whatsoever). Figure 7 looks at risk scores of all countries in the data set but removes the conflict variable. It shows that countries receiving the most U.S. weapons are increasingly risky. This is because the conflict variable tends to be static—war and war termination are both rare and take time. In other words, while U.S. weapons are not necessarily making conflict more or less likely, they are correlated with the other risks in our data set getting worse.
The lack of relationship between U.S. weapons deliveries and reduction in risk casts doubt on the idea that the United States has used weapons sales to influence its partners’ risk-proneness: who they ally with, how democratic their governments are, how they treat their citizens, or whether they engage in conflict. We do not claim that our analysis provides a complete assessment of the issue. For example, proponents of these weapons sales might argue that without them many countries would have become even riskier or more troubled. More risk data and more analysis will be necessary to untangle the relationship.
Increasing Institutional Permissiveness: Why the United States Is the World’s Leading Arms Dealer
Why does the United States remain the world’s leading exporter of weapons? As President Biden notes, Washington’s diplomacy should be “rooted in America’s most cherished democratic values: defending freedom, championing opportunity, upholding universal rights, respecting the rule of law, and treating every person with dignity.”12
In some cases, current U.S. weapons transfer policies do not align with Biden’s rhetoric. These sales open the door to entanglement (involving the United States in a conflict), dispersion (weapons falling into the wrong hands), and reverse leverage (being influenced by weapon sales recipients). Recent examples include the Saudi intervention in Yemen and weapons dispersion in the Northern Triangle of Central America. In Yemen, Riyadh uses U.S. ammunition and warheads with laser guidance to target innocent civilians.13 Selling weapons to a country that abuses human rights at home or abroad directly contradicts the Biden administration’s rhetoric about building a foreign policy based on democratic values.
Arms sales have played a central role in U.S. foreign policy since the end of World War II. Following 9/11, however, their use as a tool of foreign policy has expanded.14 Since 2009, the United States has authorized over $1 trillion in weapons sales.15 Presidents turn to arms sales repeatedly because they are marketed as a flexible, relatively inexpensive, and politically low-risk way to achieve U.S. goals compared to other options, such as security guaranties and troop commitments.
Another important reason the United States sells so many weapons is that the institutional arrangements surrounding arms sales have made it increasingly easy for presidents to sell them. Though both the Constitution and federal legislation give Congress the ability to manage or block arms sales, in practice Congress has offered little resistance to presidential arms sales policy. For example, despite passing a joint resolution of disapproval of sales to Saudi Arabia following their documented killings of innocent civilians in Yemen, President Trump simply vetoed the resolution, and arms were transferred to Riyadh.
Existing legislation creates the illusion that Congress and the federal bureaucracy have input into the arms sales process. The Arms Export Control Act of 1976 (AECA) requires that the U.S. government generate a risk assessment to confirm that potential sales will not produce unwanted outcomes. After the assessment, the presidential administration then decides if it wishes to notify Congress. If notified, Congress has 30 days to review the sale and pass a joint resolution if it wishes to prevent the weapons transfer. If it does not, then the president issues a Letter of Offer and Acceptance.16 In theory, this legislation creates both bureaucratic and legislative checks on the president’s ability to sell weapons abroad.
The biggest obstacle to making this work in practice is the process to pass a joint resolution of disapproval stopping a foreign military sale. These sales make up the largest financial value of U.S. transfers and are the public sales that Congress could, in theory, most likely prevent. Yet, there are two related bureaucratic hurdles within the AECA that make stopping these transfers nearly impossible. First, because Congress must pass a resolution rejecting the sale, this requires prioritizing a relatively inconspicuous foreign policy matter over other issues. Beyond that, it also means that any successful resolution can then be vetoed by the president—the person who already agreed to the sale.
The second reason is that the AECA does not include a procedure for discharging a joint resolution from the House Foreign Affairs Committee. What this means in practice is that unlike in the Senate where any senator can bring up a resolution of disapproval, only members of the House Foreign Affairs Committee can do so. Consequently, the 51 members of the House committee must vote to bring a resolution of disapproval, and by the time this is discussed within the committee, it often is past the initial 30-day review. Thus, it is very difficult to debate most weapons sales in the House. These two institutional problems explain why Congress has not stopped a single weapons sale since the passage of the AECA. Recent changes have tilted the institutional balance of power even further in the president’s direction.
In 2020, the Trump administration put into place regulations that changed the export oversight process of certain semiautomatic firearms, their ammunition, and other select small arms and light weapons from Categories I–III on the U.S. Munitions List to the Commerce Control List. This seemingly small change has had vast, reverberating effects.
First, the Commerce Department’s export requirements are more permissive than those of the State Department, which previously determined such requirements. For example, according to a 2019 Government Accountability Office report, between 2013 and 2017, the State Department reviewed 68,690 application licenses for these weapons and approved nearly 87 percent of those licenses, which adds up to approvals of around $30 billion, or $6 billion per year.17 In 2020 and 2021, the Commerce Department approved 94.6 percent of 11,967 license applications—for a value of $15.7 billion, or $7.85 billion per year.18 In other words, the Commerce Department reviewed fewer applications but allowed a greater value in total licenses per year.
Second, this change increased the number of countries with license exceptions, making it easier for these sometimes risky countries to gain lethal weapons. The transition from the State Department to the Commerce Department increased the number of countries with license exceptions from only Canada, the United Kingdom, and Australia to 37 nations.19 The Commerce Department estimates that several hundred license applications will be approved under its license exceptions. This means that more countries can get weapons more easily and with less regulation.20
Unfortunately, arms control legislation designed to check presidential power has made little headway. Thanks to an increasingly permissive institutional environment, the president can easily overpower Congress on Foreign Military Sales policies. Making matters worse, Congress faces other legislative hurdles, a lack of transparency surrounding direct commercial sales and Commerce Control List sales, and a lack of post-transfer oversight. This structural permissiveness means that for the system to improve, Congress would need to exercise authority to remove these barriers.
Arms Sales: Who Gets Leverage against Whom?
A common argument in favor of arms sales is that they provide the United States with an important form of leverage over weapons recipients. Advocates expect that if recipient nations depend on continued American arms sales enough that they will comply with American demands at either the domestic or foreign policy level.21 In some cases, this happens. In many, however, it does not. Unfortunately, Washington rarely stops to reevaluate this belief when arms sales fail to generate compliance.
Beyond failing to generate leverage, recipient countries also use Washington’s dependence on weapons sales against the United States. We call this phenomenon “reverse leverage.” Reverse leverage occurs when arms sales create a relationship in which the United States feels it has become dependent on the recipient—whether for security, strategic, or economic needs—and the recipient exploits this relationship to continue undertaking policies that endanger U.S. security while still receiving American weapons. Recipient states use reverse leverage to entangle the United States in a recipient state’s conflict or aggressive policies. Reverse leverage happens in two ways.
The first way is when arms sales create a perceived interdependence between the United States and an ally. One example of this is President Biden’s 2021 and 2022 sale of Patriot missiles to Saudi Arabia to help defend U.S. troops stationed in areas that are vulnerable to rocket attacks by the Houthis—Saudi Arabia’s opponent in Yemen.22
Another example is when the Government Accountability Office found that the United States was selling specific weapons to the Saudis to prevent Riyadh’s previous human rights abuses in Yemen.23 In other words, Saudi Arabia leveraged the security risks to U.S. troops from the war to receive more weapons.
The second way this occurs is via what political scientist Jennifer Spindel of the University of New Hampshire calls “loyalty coercion.”24 U.S. recipients use their partnership with a different country—whether adversary or ally—and U.S. concerns over reputation to leverage Washington into sending more weapons. Many countries relied on this strategy during the Cold War because the world was divided into two blocs.25 The recipient state’s perceived strategic and geographic significance allows it to convince great power patrons to acquiesce to policies that they would otherwise oppose.26 An example is how Saudi Arabia and Turkey used their perceived geostrategic importance as leverage to receive more weapons and deeper security commitments from the United States at the beginning of Russia’s invasion of Ukraine. Biden agreed to send more weapons to Saudi Arabia in exchange for more diplomatic support, renewing a ceasefire in Yemen, and increasing oil production to help the West’s efforts against Russia. Without a security guarantee from the United States, Saudi Arabia refused to consider such measures.27 Similarly, without U.S. weapons—of which Saudi Arabia has received more than any other country since 2009—the war in Yemen, where Biden wants a ceasefire, would have never occurred.28
The case of Turkey is equally interesting. When NATO member-states were voting in 2023 to allow Finland to become part of the alliance, Turkey was one of few countries considering its vote. After Turkey voted to allow Finland’s membership, the Biden administration began considering selling Turkey F‑16 fighter jets.29 This decision has long been debated, especially because Turkey frequently threatens to collaborate with Russia and sometimes follows through when it feels the United States is not providing the weapons that it wants.30 This is another instance of a country using its relationship with a U.S. rival to leverage Washington into sending it more weapons.
Reverse leverage from U.S. weapons sales risks entangling the United States in conflicts and partnerships that it should avoid. This entanglement can include extracting more weapons, supporting an authoritarian regime, or even entering a conflict. Rather than simply being concerned with leverage, when the United States builds a relationship at least partially because of weapons sales, Washington should be cognizant that the opposite can happen.
Cautionary Tales: Reverse Leverage, Entanglement, and Other Perils of Arms Sales
Though predicting the specific outcomes from arms sales is impossible, the risk factors captured in the Arms Sales Risk Index are connected to a host of negative consequences. In the case studies that follow, we illustrate how arms sales may give recipient countries freedom to continue engaging in risky behavior that undermines U.S. goals and principles by empowering authoritarian governments and criminal organizations.
Beyond looking at risk scores, these cases also introduce countries’ “neighborhood risk” scores. We code a state as a neighbor if it shares a land border or if it is separated by at most 400 miles of water (the maximum distance at which two 200‐mile exclusive economic zones can intersect).
We then compile the total risk of every country’s neighbor to create a neighborhood risk score. This allows us to check the risk of countries that are in very risky neighborhoods but otherwise are domestically stable.
Case Study 1: Saudi Arabia and the War in Yemen
One of the key examples of reverse leverage during a conflict is Saudi Arabia’s war in Yemen. Saudi Arabia continues to receive more arms from the United States and use this assistance to demand more military support. Saudi Arabia has used its purchases of weapons not only to expand its war in Yemen but also to entangle the United States in the conflict. As a result, the United States has become complicit in one of the world’s worst humanitarian tragedies. Figures 8–11 show Saudi Arabia’s neighborhood risk, its risk score over the five years of the index, the dollar value in arms that it has received since 2009, and the breakdown of its risk matrices.
Since 2009, Saudi Arabia has been the largest purchaser of U.S. weapons, receiving nearly $27 billion in U.S. weapons. Riyadh purchases American-made weapons on an unrivaled scale. U.S. aid has correlated with an increasing role in the war in Yemen. In 2010, the Obama administration sold fighter jets to the Saudis as part of a $29 billion deal. These same F‑15SA fighters conducted airstrikes in Yemen as early as 2018. Under Trump and Biden, there has been at least $2 million spent on F‑15 parts and F‑15 training for Saudi pilots.31
Related Event
The conflict in Yemen has killed hundreds of thousands of people, including tens of thousands of civilians—with an air campaign alone that’s responsible for 15,000 casualties.32 Furthermore, a U.S. government report notes that the United States admits to not assessing the possibility of its weapons killing innocent civilians in Yemen.33 The United States continues to train the Saudi coalition on how to use American weaponry. The U.S. Air Force has participated in joint exercises with at least 80 percent of Saudi Arabian air squadrons in Yemen. Making matters worse, at least four of these trainings took place on American soil.34 Bruce Riedel, a senior fellow at the Brookings Institution and a former CIA analyst, noted that the United States withdrawing all American military personnel and contractors would have an “immediate and devastating” impact on the Saudis. He further states that the Royal Saudi Air Force “would not be able to keep aircraft in the air, let alone operational fighting machines. The Saudi army and national guard would also be crippled.”35 In other words, without U.S. support, Saudi Arabia could not fight this war.
The United States continues to send Saudi Arabia planes and military devices such as radars and precision-guided munitions. Despite knowing that the kingdom is killing innocent civilians, Washington worries that Saudi Arabia would be even less restrained without a partnership with the United States.
For example, following an incident in which Saudi Arabia killed hundreds because of what its state news wire antiseptically dubbed “wrongly passed information,” the U.S. government began denying that its support for Saudi Arabia was a “blank check.”36 Yet, in response, Washington continued approving sales of radar and precision-guided systems in an effort to “reduce civilian harm” in the conflict.37 In short, the United States sent Saudi Arabia more weapons in hopes of preventing civilian casualties, while the Saudis have used those weapons wrongly or carelessly.
Another example occurred in 2022 after Houthi rebels began attacking U.S. air bases in Saudi Arabia.38 In response, to protect Saudi and U.S. troops, the United States sent Patriot anti-missile interceptors.39 In other words, U.S. troops stationed in Saudi Arabia to help it fight the war in Yemen allow Riyadh another excuse to purchase U.S. weapons—for protecting U.S. troops. If Saudi Arabia did not receive those missiles, U.S. troops could face further attacks. Saudi Arabia is leveraging U.S. security commitments to get even more weapons.
Saudi Arabia’s risk score is high not only because of the conflict in Yemen. The kingdom also violates domestic human rights on a large scale, having the eighth worst domestic human rights vector in our index. U.S. weapons have only reinforced the government’s authoritarian nature.
U.S. weapons have resulted in neither Saudi Arabia leaving the war in Yemen nor Riyadh’s democratization. Instead, Riyadh is using Washington’s military commitment to leverage greater support from the United States. Despite a ceasefire and the temporary end of Saudi attacks on Yemen, the conflict continues, and the risk of Riyadh continuing to use U.S. weapons for attacks on civilian infrastructure endures.40
Case Study 2: Playing Both Sides—India, Geopolitics, and Arms Sales
India is another case of reverse leverage, though in a slightly different manner than Saudi Arabia. Like Riyadh, New Delhi is not liberalizing or democratizing after receiving U.S. weapons. But rather than using Washington’s security commitment to aid it in a war, India uses the U.S. desire to balance China as a tool to receive more weapons. The U.S. relationship with India is primarily driven by great power competition. The desire to have India as a partner in competition with China results in Washington supplying it with arms. The United States is creating the conditions for continuous delivery of weapons to India by framing them as a partner in competition with China. India, therefore, continues to receive a significant number of U.S. weapons while also becoming riskier on several vectors. Figures 12–15 show India’s neighborhood risk, its risk score over the five years of the index, the dollar value in arms that it has received since 2009, and the breakdown of its risk matrices.
Since 2009, India has purchased over $2.6 billion in U.S. weapons and has seen its risk score rise by six points, from 51 to 57. This has been caused by increases in India’s state violence and reductions in domestic freedoms over the last five years.
During the past decade, the United States has been trying to make India a key defense partner, via arms sales and security agreements, to counter China.41 The relationship between the United States and India grew even closer after Narendra Modi’s rise to power in 2014. Modi facilitated strategic defense agreements, resulting in India becoming a designated Major Defense Partner.42 During the Trump administration, India was part of the Quadrilateral Security Dialogue, which meant the United States viewed India as a “democratic counter” to China’s rise.43 The Biden administration has taken this one step further by sending U.S. military representatives to New Delhi and accelerating joint military exercises.44
The problem is that while Modi was willing to forgo Cold War mindsets and work with Washington, he could not be controlled. His rise also opened the door for illiberal policies, which saw “forced conversions, religious violence, and hostility toward dissenting voices.”45 Toward the end of the Trump administration, Modi passed discriminatory citizenship laws and used his military to repress dissent.46 The consequence is that India’s domestic human rights vector has worsened by 14 points over the last five years. India has become more authoritarian and is transforming into a country where freedom of expression is quickly dissipating.
Furthermore, India’s role as a geopolitical balancer against Russia and China is entirely unclear. Despite U.S. urging, India has refused to stop buying $5 billion worth of Russian S‑400 anti-aircraft missiles. This program provides Russia with large profits and helps allow Russia to continue the S‑400 program.47 Beyond that, during August 2022, months after the start of the Ukraine conflict and weeks after Nancy Pelosi’s visit to Taiwan, India participated in joint military drills with Russia and China.48 Rather than provide balance against Russia and China after receiving U.S. weapons, India continues to work both sides against each other.
India therefore presents an interesting case of reverse leverage. An increase in weapons sales has correlated with India becoming a Major Defense Partner as well as becoming a participant in U.S. strategic policies in Asia and Europe. At the same time, India is not ending its relationships with Washington’s great power competitors, and it is becoming less democratic and less free, all while facing greater rates of domestic terrorism. However, due to fears of “losing” India to Russia, the United States continues its commitment to weapons transfers. India is an example of U.S. leverage over India not being reflected in our data. If anything, the opposite problem exists, where India is leveraging its strategic position for more access to weapons.
Case Study 3: Afghanistan and the Danger of Loose Weapons
Afghanistan illustrates the danger of focusing solely on the expected near-term benefits of arms sales while ignoring the potential risks. Afghanistan has purchased and received billions of dollars in weapons over the past two decades to defeat the Taliban. Nonetheless, post‑U.S. withdrawal, these weapons are arming the group that they were sent to defeat. Figures 16–19 show Afghanistan’s neighborhood risk, its risk score over the five years of the index, the dollar value in arms that it has received since 2009, and the breakdown of its risk matrices.
During the five-year period covered by the risk index, Afghanistan’s government fell, and the Taliban took power. This, in combination with America’s withdrawal from the country, all but guaranteed that the Taliban would take possession of U.S. weapons that have been sent to Afghanistan since 2001. Over the last five years, Afghanistan’s risk score has gotten worse by four points, dropping its rating from 84 to 88 and making it the second riskiest country in our database. Since 2009, Afghanistan has received over $1.2 billion in arms purchases and over $74 billion in total security assistance from the United States.
The collapse of the Afghan government resulted in at least $7.2 billion worth of American equipment falling into the hands of the Taliban.49 Initially, the Taliban government sold these weapons because they provided a source of revenue.50 Beyond that, the Taliban also gained political benefits by controlling who could access these weapons.51 More recently, Taliban leaders have used U.S. weapons to abuse human rights, ensuring women do not go to school, and held military showcases in cities as an attempt to convince people to obey them.52 Beyond using weapons to increase their own authoritarianism, the Taliban in the past have allowed U.S. weapons to disperse into the hands of terrorists who wish to do harm to the United States.53
Related Media
These are just some of the consequences of sending lethal weapons by the billions of dollars into countries in conflict that have weak governance structures. The rise of the Taliban certainly had major effects. For example, Afghanistan’s domestic human rights vector has worsened by 16 points over the last five years. Similarly, over the last five years, Afghanistan has been the most conflict-prone country, and as a result, its conflict vector has worsened by five points.
Afghanistan is a clear example of a country that should not have been receiving nearly as many weapons as the U.S. government provided it. While in the short term these weapons allowed for successful missions, providing them was a risky endeavor that is now arming an enemy of the United States and of Afghanistan’s own people.
Conclusion
To date, the Biden administration is, on average, approving weapons sales to less risky recipients than the Trump and Obama administrations did, but that hardly suggests the recipient list is safe. Rather, the Biden administration continues sales to Saudi Arabia, keeps sending weapons to authoritarian regimes such as Egypt and the Philippines, and fails to prevent dispersion of weapons in Mexico.
Beyond that, the Biden administration has signaled no intent to enact policies that would improve the end-use monitoring of weapons. There has been no intent to rejoin the Arms Trade Treaty, which has shown modest success at reducing illegal weapons dispersion.54 The administration also has not tried to fix end-use monitoring legislation that results in U.S. weapons being used to violate human rights or be dispersed to unsavory groups.55
Moving forward, the United States can reduce the potential risks of arms sales through a series of policy changes and institutional reforms. An obvious first step would be to halt sales to the riskiest nations: those with the highest overall risk scores as well as those scoring at the bottom of any of the risk index metrics. Extreme problems on any one of the risk vectors should be seen as red flags. There are certain cases where security concerns outweigh risks, and sales can be seen as having strategic benefits. For example, the Biden administration clearly believes this is the case in Ukraine. Weapons are being transferred, and the administration is acknowledging that dispersion is a threat—but one worth dealing with given the supposed strategic implications of the conflict.56 In October 2022, Biden’s State Department noted that “thus far, intense internal demand for use on the battlefield by Ukrainian military and security forces within Ukraine is assessed to be impeding black-market proliferation of small arms and guided infantry weapons such as [Man-Portable Air Defense Systems] and [anti-tank guided missiles] from Ukraine.”57 Policymakers should continue keeping their eyes wide open, however. Worldwide, arms sales to governments that are serial violators of human rights, nations at war, and extremely fragile or corrupt states generate the most predictable negative consequences.
Distinguishing exceptions from rules sounds simple in theory, but it rarely occurs in practice. Policy practitioners and analysts voice concerns that by stopping sales to risky clients, the United States might lose partnerships to its great power adversaries. They believe that by maintaining relations, the United States can restrain its partners.58 The data we show in the risk index, while not disproving this theory, inspire skepticism when it comes to accepting the leverage argument. Our data show that there is an absence of evidence that U.S. weapons sales can be leveraged to reduce an average country’s risk score. Given that, the long-term risks associated with giving risky countries weapons cannot easily be written off. Doing so results in a variety of negative factors, including recipients being able to leverage the United States for more weapons, weapon dispersion, human rights abuses, and increasing authoritarianism. Thus, the long-term risks must be weighed more heavily than they currently are.
Second, the United States should “flip the script” on arms sales. This would eliminate the president’s unilateral freedom to make arms sales. Under the status quo, following presidential notification of a sale, Congress must pass a joint resolution of disapproval. This process is an easy victim to both partisan gridlock and a presidential veto. Flip-the-script legislation would change the status quo and force Congress to approve sales, rather than disapprove them. Currently, the president holds all the power over arms sales, relegating Congress to a rubber-stamping role. Instead, if all arms sales were null unless Congress approved them, the presidential veto threat would no longer exist. Legislators supporting the sale would need to defend it publicly, which would pose a greater challenge for the riskiest sales.
Third, the United States should either move regulation of small arms and light weapons licenses back to the State Department or vastly improve the Commerce Department’s transparency. The Commerce Department has been working on the latter.59 Switching regulation back to the State Department or improving the Commerce Department’s transparency would reduce the number of weapons that need to be tracked and would provide more protection against unsavory actors gaining access to U.S. weapons.
While the United States must also account for other considerations, history shows that the risks involved with weapons sales must be taken more seriously.
Appendix A: Arms Sales Risk Index Methodology
Constructing the Index
The Arms Sales Risk Index (ASRI) contains four risk vectors. Each vector, in essence, represents a causal mechanism or an explanation of how arms sales can lead to negative consequences. We take what we believe to be a conservative approach based on straightforward assumptions, using available data, about the correlations between risk factors and negative outcomes. We do not claim to make precise predictions about the probability of specific outcomes based on the ASRI. The ASRI’s immediate usefulness lies in helping policymakers incorporate the consideration of risks in decisions about selling and transferring U.S. weapons abroad. In the longer run, the ASRI is an important step in developing a more comprehensive, empirically grounded assessment of the consequences, both positive and negative, of arms transfers.
We measure the strength of the four risk vectors by assessing six different indices. The risk vectors include a state’s level of corruption, the state’s stability, the state’s treatment of its people, and the level of conflict, both internal and external, in which the state is engaged.
To be included in the ASRI, a risk factor must meet the following criteria:
- It must be mentioned in the literature on the effectiveness of arms sales, or logic must strongly recommend its inclusion.
- It must be something people can measure in a consistent fashion.
- The data source it came from must be one that is regularly updated.
- The data source must be a credible one that uses transparent methodology.
- The component must complement and not overlap too much with other components already in the index.
The first risk vector we consider is the corruption of the recipient nation’s regime. We assume that states that prevent their citizens from earning income, have fake elections, and have questionable business practices pose a greater risk of misusing weapons, permitting weapon dispersion, and abusing human rights. To assess this vector, we rely on Transparency International’s Corruption Perceptions Index, which ranks 180 countries and territories by their perceived levels of corruption. It includes 16 different surveys from 12 different institutions to create a composite “corruption perception score.”
The second risk vector we consider is the fragility of the recipient nation. We assume that fragile states with tenuous legitimacy that also lack the ability to deliver services and cannot manage conflict within their own border pose a greater risk for dispersion and misuse of weapons. The Fragile States Index, produced by the Fund for Peace, examines international conditions that lead to state fragility. It examines when these pressures outweigh a state’s capacity to maintain stability. It uses 12 indicators (security apparatus, factionalized elites, group grievance, economic decline and poverty, uneven development, human flight, state legitimacy, public services, human rights, demographic pressures, refugees, and external intervention) to create a composite score for “state fragility.”
The third risk vector we examine is a state’s violence toward its citizens. States that have a poor record of human rights and/or regularly use violence against their citizens pose a greater risk of misusing weapons. We rely on two indices to measure these factors: Freedom House’s Freedom in the World index and the Cato Institute and Fraser Institute’s Human Freedom Index’s expression and information score. The Freedom House index includes measurements for electoral process, political pluralism and participation, functioning of government, freedom of expression, associational rights, rule of law, and personal autonomy.
The Cato Institute and Fraser Institute’s Human Freedom Index’s expression and information score is comprised of nine components and includes variables measuring killings of press members, jailing of press members, freedom of academic and cultural expression, harassment of journalists, government censorship, internet censorship, media self-censorship, media freedom, and freedom of expression. For this data set, the 2020 data are used for both 2020 and 2021. This is because the data set has data only up to 2020. The use of this data set in the index is to examine state violence against individual rights.
Finally, for the fourth risk vector, we consider conflict as a critical vector for negative consequences. States currently engaged in conflict are inherently riskier when it comes to factors such as dispersion, blowback, entanglement, and human rights abuses. To assess these risks, we rely on the Global Terrorism Index and the Uppsala Conflict Data Program/Peace Research Institute Oslo (UCDP/PRIO) Armed Conflict Dataset. The Institute for Economics and Peace (IEP) annually publishes the Global Terrorism Index, which provides a comprehensive summary of global trends and patterns in terrorism since 2000. It looks at the total number of terrorist incidents each year, the total number of fatalities caused by terrorism in a given year, the total number of injuries caused by terrorism in a given year, and the approximate level of total property damage caused by terrorism in a given year. It combines these factors to create a composite score that ranks the amount of terrorism facing 163 countries.
This year, we changed how we are scoring the terrorism index because of a new data source for terrorism scores. IEP switched its data source from the Global Terrorism Database to the TerrorismTracker, so we weighted the TerrorismTracker scores to be in line with the Global Terrorism Database to create an index score. We did this because “the way the TerrorismTracker classifies violent events means that the number of terrorism incidents and fatalities obtained from this source tend to be lower.”60 As a result of this shift in measurement, many countries’ risk scores declined drastically. To account for this, we standardized the data using 2022 as a base year and adjusted it for the average of the previous four years combined.
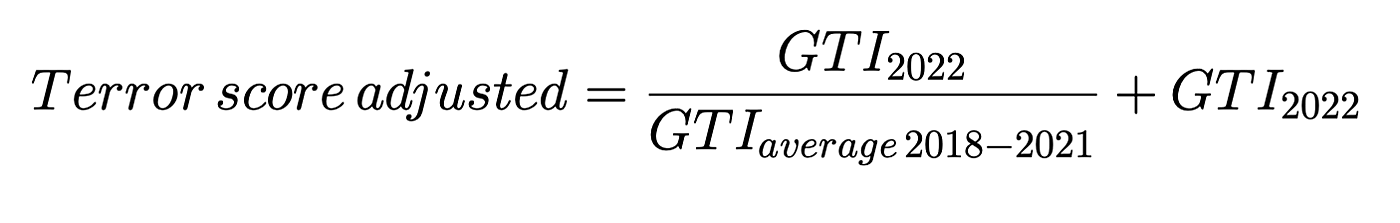
We then used the normalization method that we later discuss to convert it to the same scale as the rest of our risk index.
The UCDP/PRIO Armed Conflict Dataset is used to track the severity of armed conflict. It uses three measures (high level, low level, and no conflict) to assess the strength of a conflict in a given location. Larger conflicts are inherently riskier because of the longer duration and greater damage.
There is some overlap across indices as demonstrated in Table 3. For example, the Human Freedom Index and the Freedom in the World data sets clearly positively correlate with each other. But as the correlation matrix below indicates, even though the variables are positively correlated with one another, all of them appear to bring something different to the Arms Sales Risk Index.
This year, we changed one of our data sets to both standardize and normalize the data on a consistent scale from the first year to the fifth year. Instead of using the State Department’s Country Reports on Human Rights Practices data, we are now using the Human Freedom Index’s expression and information score. The State Department’s country reports used an interval scale rather than a continuous one. That meant that changes over time in that score were more drastic when standardizing everything to a base year. Because the Human Freedom Index measures the same thing but is continuous, there is more nuance in using its data.
We did not want to standardize the data last year because the conflict and state violence score (which had a correlation coefficient with the risk index at 0.829 and 0.913, respectively) would have been overweighted in the risk index.
Nevertheless, by changing one data set, we continue to feel confident that because the scale remains 1–100, where 1 is always the lowest and 100 is always the highest, it provides an easy reference point for policymakers to start evaluating risk profiles of countries to which the United States sells weapons. The only change is that because we also standardized the data on a 1–100 scale by only using data sets that use said scale or a version of it (i.e., 1–10). As a result, we feel confident that our standardization allows us to evaluate year-to-year trends.61
Our normalization process remains the same. To combine each of the risk factors, which are constructed using a variety of scales, we normalize the scores for each risk factor using min‐max methods. This means that we adjust the data to the rest of the data by placing all six indices on one scale. This helps us avoid weighting one factor more than another. Unless otherwise noted, normalization follows the following formula. In the equation, s’k represents the normalized score of the measurement variable s for observation k.

After normalization, for each measure, every country has a score of between 1 (the lowest risk) and 100 (the highest risk). We then weight each of the six components equally, averaging them to find the composite risk score for each country. We weight the six components equally rather than the four vectors because we do not yet have an empirical or theoretical reason to consider different weighting systems and because although they are similar, the pairs of factors that measure state behavior and conflicts measure very different types of specific data. While two countries may have the same overall score, they may be risky for different reasons. Thus, it is important to pay attention to the individual components as well as their risk index scores.
Calculating Neighborhood Risk Scores
Neighborhood risk uses the Correlates of War Direct Contiguity data set that codes a state as a “neighbor if it shares a land border or if they are separated by 400 miles of water” (the maximum distance at which two 200‐mile exclusive economic zones can intersect).
We then compile the total risk of every country’s neighbor to create a “neighborhood risk score.” This allows us to check the risk of countries that are in risky neighborhoods but otherwise are domestically stable. An example of this is Greece, which is in the 25th riskiest neighborhood, but it has only the 123rd highest overall risk score.
Additionally, the neighborhood risk metric allows us to track which regions are the riskiest. Countries in the Persian Gulf and Middle East tend to receive a lot of government‐to‐government weapons sales, but the neighborhood itself amplifies the risk of these sales. In Central America, while the individual countries see significant individual risk, they also see equal neighborhood risk—an unfortunate trend given that the region receives a substantial amount of direct commercial sales.
Calculating the Average Customer Risk Score
As its name suggests, the average customer risk score is a common‐sense measure of how risky the average arms sales customer of any given arms‐exporting nation is in a given year. The more weapons a nation sells to riskier nations, the higher its score will be. If a nation mostly sells weapons to low‐risk clients, the average customer risk score will also be low. We calculate the score by multiplying each recipient country’s risk score by the dollar amount of sales it purchased and then dividing by the total sales in dollar amounts made that year.
For example, if the United States only sold $1 million of weapons to a nation with a risk score of 100, the U.S. average customer risk score would be (100 x 1,000,000)/1,000,000 = 100. If the United States sold $1 million of weapons to a nation with a risk score of 100 and $1 million to a nation with a risk score of 1 the average customer’s risk score would be (100 x 1,000,000) + (100 x 0)/(1,000,000 + 1,000,000) = 50. Where it gets more interesting is when the dollar amounts vary, as they do in the real world. For example, if the United States sells $2.5 million of weapons to a nation with a risk score of 0 but sells $7.5 million to a nation with a risk score of 100, the average customer risk score would be (100 x 7,500,000) + (0 x 2,500,000)/(7,500,000 + 2,500,000) = 75.
Appendix B: Data, Data Sources, and References
Data
Data Sources for Arms Sales and the Risk Index
Arms Sales
Security Assistance Monitor
Risk Index Factors
Freedom House, Freedom in the World 2022
Transparency International, Corruption Perceptions Index 2021
The Fund for Peace, Fragile States Index 2022
Cato Institute and Fraser Institute, Human Freedom Index 2022
Uppsala Conflict Data Program/Peace Research Institute Oslo Armed Conflict Dataset
Institute for Economics and Peace, Global Terrorism Index 2022: Measuring the Impact of Terrorism
For the neighborhood risk index, we also utilized the Correlates of War Project’s version 2 of its Direct Contiguity Data from 1816 to 2016.
Citation
Cohen, Jordan, and A. Trevor Thrall. “2022 Arms Sales Risk Index,” Policy Analysis no. 953, Cato Institute, Washington, DC, July 18, 2023.
About the Authors


This work is licensed under a Creative Commons Attribution-NonCommercial-ShareAlike 4.0 International License.