| Statistical Determinants of Favorability Toward Police |
| As the previous data makes clear, on average, black Americans, younger people, lower income individuals, urban residents, and liberals tend to have a more negative view of police integrity, use of force, impartiality, competency, accountability, and tactics. Conversely white Americans, older people, middle and higher income individuals, suburbanites, and conservatives tend to have a more positive view of the police. Hispanics typically take a middle ground, but are concerned about current policing practices. If we are to improve public perceptions of the police and strengthen legitimacy of the law, ideally we’d like to know what’s really driving favorable and unfavorable attitudes toward the police. This is a difficult task because these attitudes are confounded. For instance, a person who thinks the police aren’t held accountable also likely thinks the police are racially biased. How might we unpack this puzzle? Statistical analyses can offer some clues. A statistical test (logit regression) can simultaneously take into account people’s backgrounds, experiences, and perceptions of police to determine which best predict favorable or unfavorable attitudes toward the local department. (Appendix I details which survey questions were used to measure each variable, and provides further methodological details). Demographics What demographic variables best predict attitudes toward the police? The previous survey results demonstrate that differences in favorability toward the police are most dramatic across racial groups. A statistical test (logit regression) confirms that both being African American and Hispanic strongly and significantly predict unfavorable attitudes toward the police; the prediction is especially stronger among African Americans.60 However, once age and education are accounted for in the model, being Hispanic no longer significantly predicts negative attitudes (see Appendix J.1).61 Perhaps with time, as Hispanics age and move up the educational and income ladders, the relationship between the police and the Hispanic community may improve. However, controlling for other standard demographic factors does not affect the relationship between being African American and favorability toward the police. When considering demographic factors altogether, increases in age, education, and income significantly and positively predict favorable attitudes toward the police and being African American predict negative attitudes. Living in a city or suburb, one’s gender, and being Hispanic do not significantly predict attitudes toward the police. A later section will show that after controlling for perceptions of police use of force and impartiality, race is no longer a statistically significant predictor of attitudes toward the police. Ideology Next we consider how well political ideology predicts attitudes toward the police while accounting for demographics. Being conservative is consistently a large and significant predictor of positive attitudes toward the police. However, identifying as politically liberal does not typically predict attitudes. These results suggest that police action notwithstanding, conservatives will tend to be more sympathetic to police than the average American (see Appendix J.2). As conservative writer Rachel Lu put it, “Conservatives like cops. We’re law and order people, so we need to believe that the good guys are the ones with the badges.“62 Perceptions of Police and Crime Next, a series of statistical tests (bivariate logit regression) respectively examines the impact of concerns about crime, evaluations of police competency, empathy, use of force, integrity, impartiality, accountability, and personal contact on general favorability toward the police, while controlling for demographics and ideology.63 (See Appendix J.2 for full results.) The statistical tests find each of these variables significantly predicts favorability toward the police, except for concerns about crime (see Appendix J.2). Race no longer predicts favorability toward the police when we control for perceptions of police use of force, impartiality, or satisfaction with personal contact.64 This indicates that if one were to equalize perceptions of police use of force, racial bias, or satisfaction with personal encounters, African Americans would have average views toward the police (i.e. they would be more favorable). Thus reformers may more effectively rebuild African Americans’ confidence in law enforcement by improving public perceptions of police use of force, impartiality, and professionalism during encounters. What Matters Most? Each of these perceptions and reported experiences with police are highly correlated with one another. This makes it difficult to determine which best explain favorability toward the police. Thus caution should be used when combining all significant variables together in one statistical model. Doing so indicates that satisfaction with personal police contact may best predict favorable attitudes toward the police, even when accounting for the effects of these other variables.65 Satisfaction with police encounters also appears to “soak up” the statistical effects of perceptions of police empathy, experience with police mistreatment, and respect for authority. It’s not just personal experience that matters: perceptions of racial bias in policing, police competency, empathy, and accountability continue to have distinct effects on favorability toward the police. Change in Predicted Probability of Being Favorable Toward the Police 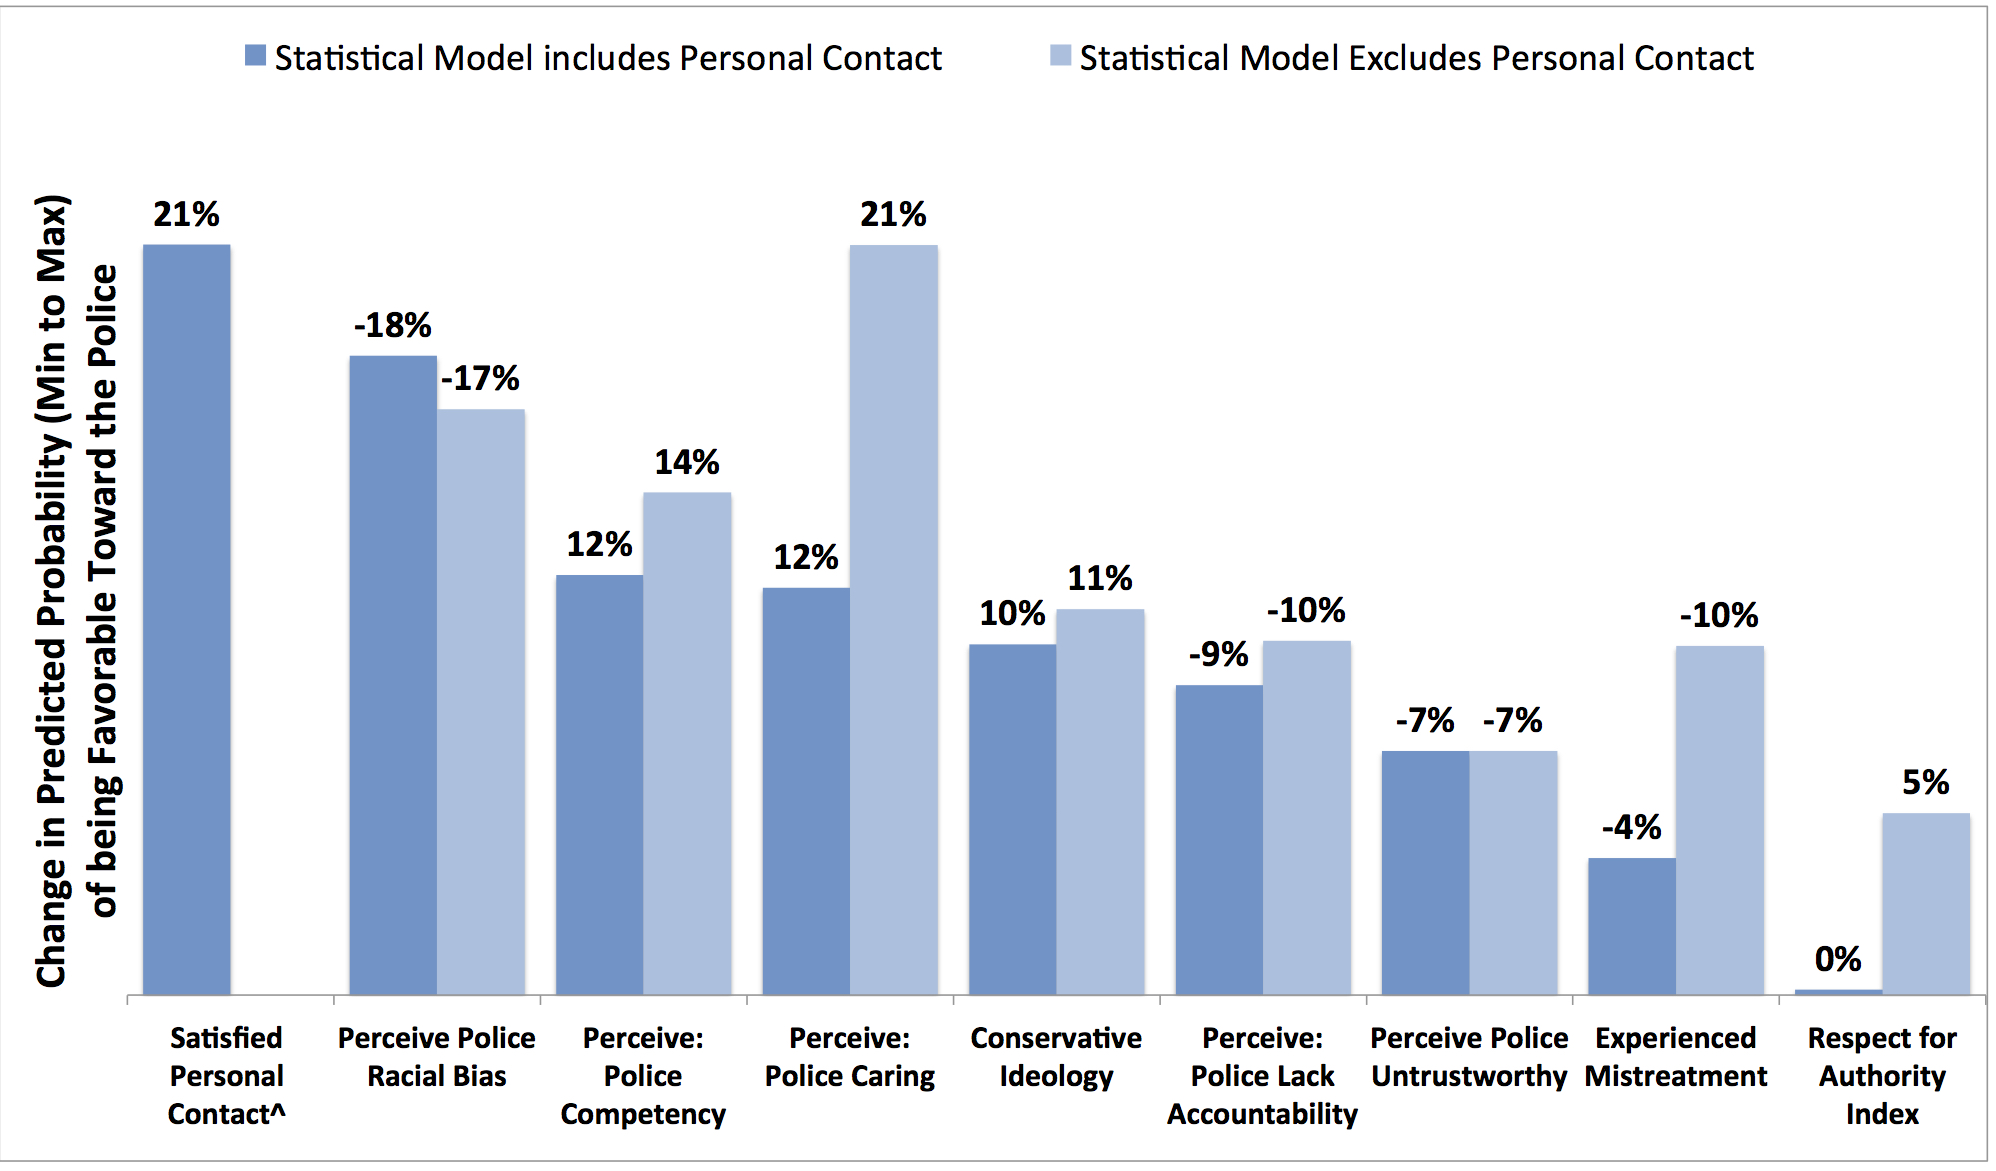
|
Notes:
60 A linear combination of estimates test indicates the effect of being African American on attitudes toward the police is about 50% larger than being Hispanic, (p <.01).
61 We can be 95 percent confident this result does not happen by chance.
62 Rachel Lu, “You Don’t Have to Be Black Lives Matter to Support Police Accountability,” The Federalist, July 7, 2016, http://thefederalist.com/2016/07/07/you-dont-have-to-be-black-lives-matter-to-support-police-accountability/.
63 Bivariate regressions were run between each key independent variable of interest while also controlling for demographics in each model.
64 Demographic and political variables were included in each of these models.
65 A series of nested models were conducted omitting one key independent variable at a time. Likelihood ratio tests and comparing improvements in pseudo-R2s indicate that each variable significantly improved model fit, except for concern about crime and frequency of interaction with law enforcement. There are particularly large improvements in model fit when including the measure of satisfaction with personal police contact (LR χ2 = 508.81 p <.001). To be sure, it is difficult to determine which variables are the strongest predictors of public attitudes toward the police because perceptions are highly correlated and are sensitive to measurement. Furthermore, satisfaction with personal police contact may itself mediate other attitudes and perceptions. Thus, caution should be used when interpreting what factors may be most important in explaining attitudes toward the police. In this report, care is taken to construct independent variables measured with survey questions using a similar response structure (i.e. scale of 1–5) to reduce the likelihood that one measure received unmerited advantage in the regression equation.