Dear Capitolisters,
I hope you all are enjoying the official start to increasing daylight and the rollout of the Moderna vaccine. Before we get to this week’s topic, a couple housekeeping notes: first, there will be no Capitolism next week, as I’ll be maximizing my leisure (i.e., I’m on vacation); second, I’m going to abandon the salutation gimmick in the new year, as it’s proven time-consuming and distracting. I’m sure you can handle both.
Anyway, on to the wonkery.
My optimistic review of “income stagnation” in the United States elicited the usual commentariat rebuttal about how such optimism ignores skyrocketing costs for essentials like health care, education, and housing. Although all of the figures I presented were adjusted for inflation (and thus the aforementioned essentials), there certainly are (as I noted in the article!) regional differences when it comes to the cost of living—differences that can dramatically affect how far one’s income actually goes.
A St. Louis Fed analysis shows how this works by recalculating median household incomes using “Regional Price Parity” (RPP) indices, which compare living costs across states (with the national average being 100), and finding significant changes in these “real life” incomes once you account for local living costs. In some places, incomes went further than face-value; in others, just the opposite. The researchers also found that housing was, by far, the biggest cost differential among states—which you can see in the updated map below for states’ metropolitan areas in 2019:
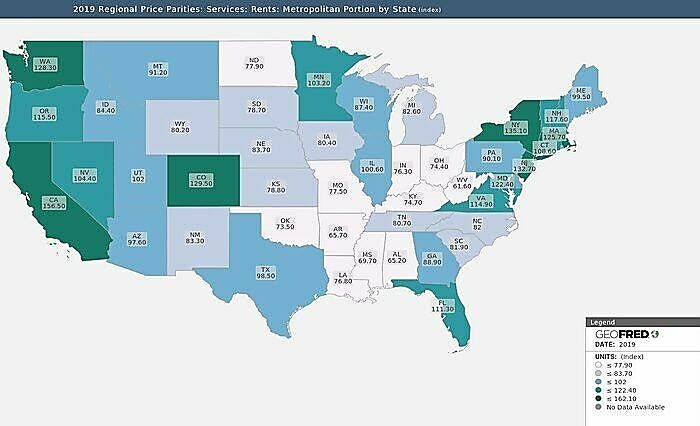
Things get even more extreme when you examine the rent RPPs of specific urban areas. For example, the 2019 RPP for rent in Charlotte is a very welcoming 89.5, while the RPP in L.A. is a dismal 169.5—even though both places have about the same per capita personal income (around $52,000). Ouch.
These regional differences can also mask problems that national data don’t show. While housing affordability actually looks fine nationwide (per the National Association of Realtors Housing Affordability Index, which examines median home prices and family incomes), for example, it can be a totally different story in certain high-cost places like San Francisco or New York. And, as the linked data show, there certainly are areas of the country in which housing affordability is a real problem—indeed, as I noted this week over at the Cato blog, these regional differences are a big reason many Americans are moving to different states—especially right now.
So What’s Driving Housing Cost Increases?
Some of the increase in home prices stems from the simple fact that houses in the United States are getting bigger, even as households are getting smaller. AEI’s Mark Perry crunched the numbers a few years ago and found that, while median home prices had steadily increased between 1973 and 2013, they were relatively constant on an inflation-adjusted, price-per-square-foot basis—hovering a little above or below $115 per square foot:
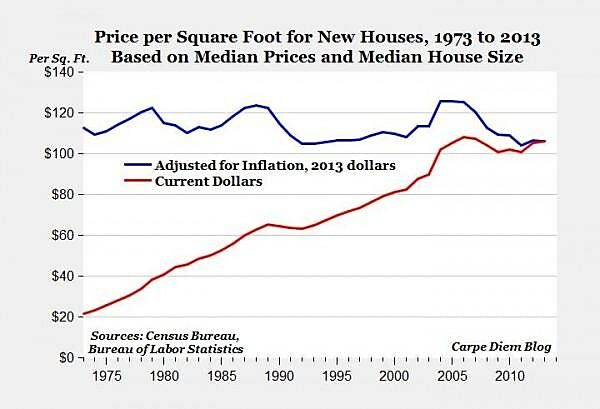
That number was in the same range in 2019 (about $121 in current dollars or $111 in 2013 dollars). However, this metric doesn’t account for rents and, more importantly, masks some legitimately high prices in certain parts of the country—prices driven in large part by government policy.
Land use regulation.
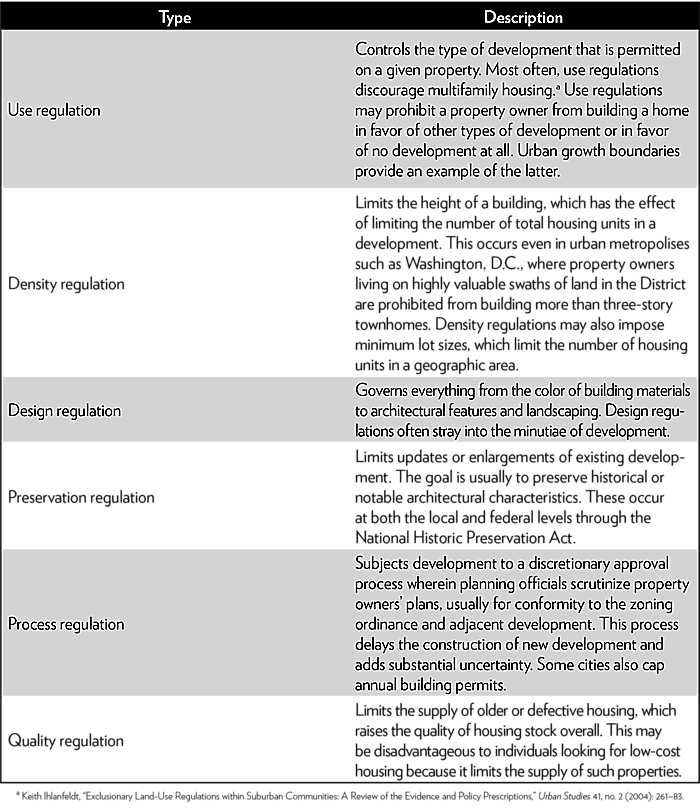
One of the biggest drivers, particularly in metropolitan areas, is land use regulation. We typically think of this being all about single family zoning, but there are plenty of other types of regulation—covering things like a building’s height or distance from the street; lot size; home appearance; requirements for a certain amount of “open space”; permitting or variance approval processes (especially timing and the involvement of third parties); and development fees. My former Cato colleague Vanessa Brown Calder’s 2017 paper on land use regulation (more on that in a sec) has a great table summarizing the universe:
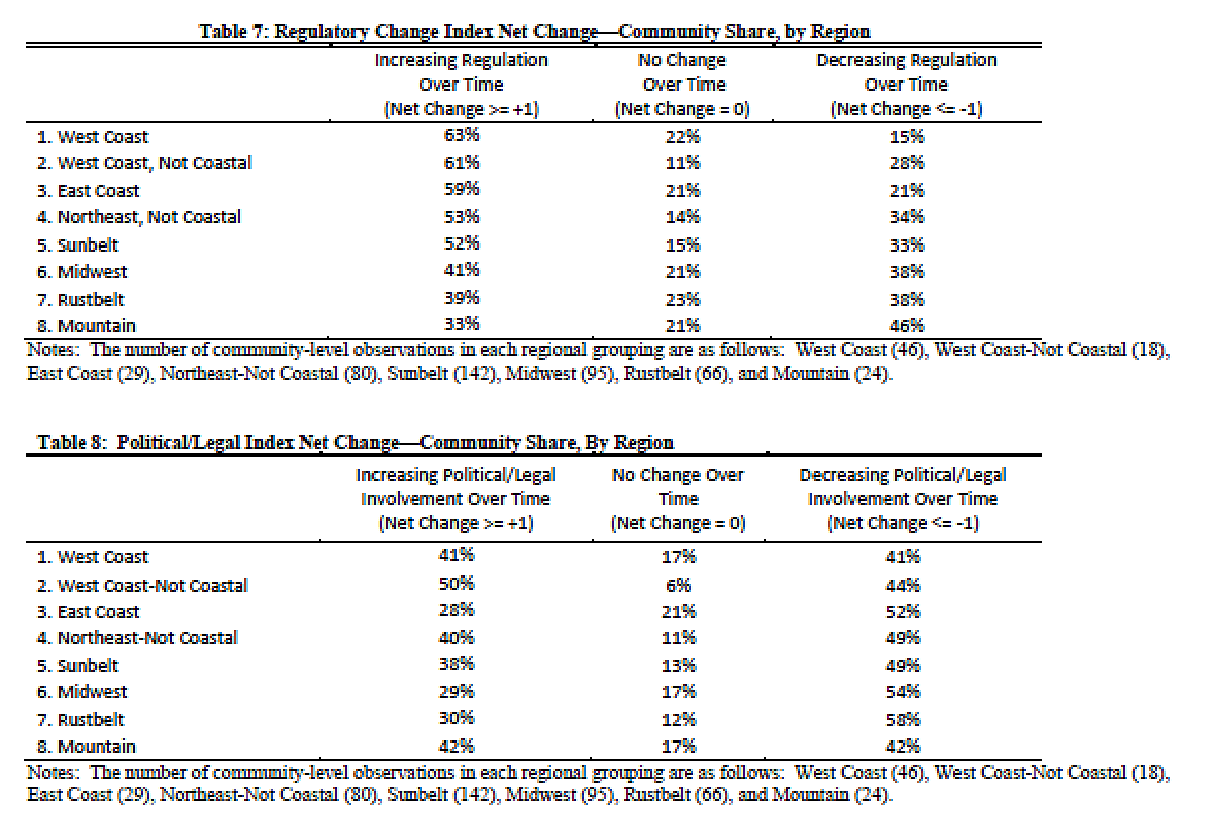
Numerous analyses have shown that land use regulation in the United States has been increasing in recent years but not evenly across regions or metro areas. Perhaps the most useful, comprehensive, and widely cited one comes from the folks at Wharton. Their latest Residential Land Use Regulatory Index shows substantial increases in land use regulations and in political or legal involvement in the regulatory process—even after the Great Recession’s housing crisis. As you’d expect, the most heavily regulated markets are on the coasts, with the San Francisco and New York City metropolitan areas leading the pack.
However, land use regulation certainly isn’t just a problem in those two cities. In fact, data show that both permitting and construction (per capita) are down significantly in most major metro areas over the last few decades:

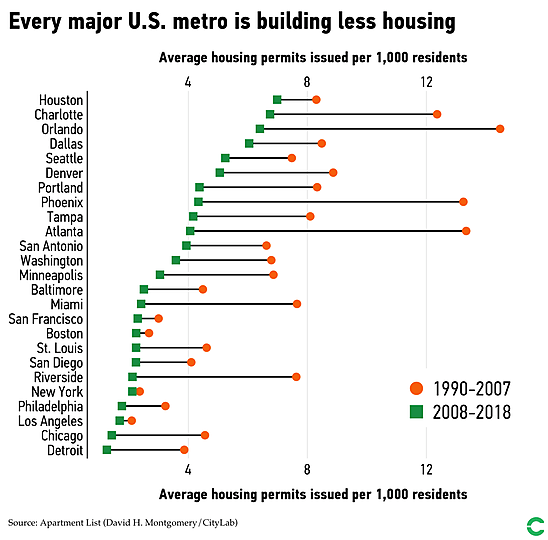
Various studies have shown that a good bit of this decline is likely attributable to the aforementioned increase in land use regulations and the “NIMBY” (“not in my backyard”) residents who demand and utilize them. The inevitable result: higher prices. For example, Calder’s 2017 paper found that “rising land‐use regulation is associated with rising real average home prices in 44 states and that rising zoning regulation is associated with rising real average home prices in 36 states.” Another recent paper (from two of the most influential economists on housing, Edward Glaeser and Joseph Gyourko) concluded that “more expensive housing markets tend to be both more regulated and have more inelastic supply sides” (meaning housing quantity doesn’t increase in line with demand). Many, manyotherstudies have recorded similar findings, along with all other sorts of problematic effects (increased inequality, reduced regional mobility, lower economic growth, decreased educational opportunities, strained fiscal budgets, etc.).
Building costs.
Construction costs have also increased substantially in recent years. As noted in one recent Harvard study, for example, “the nominal costs of commercial construction projects doubled between 2001 and the third quarter of 2019, including a 39 percent jump in 2012–2019 alone”—far outpacing inflation. Once again, federal, state and local government policy contributes to this trend:
-
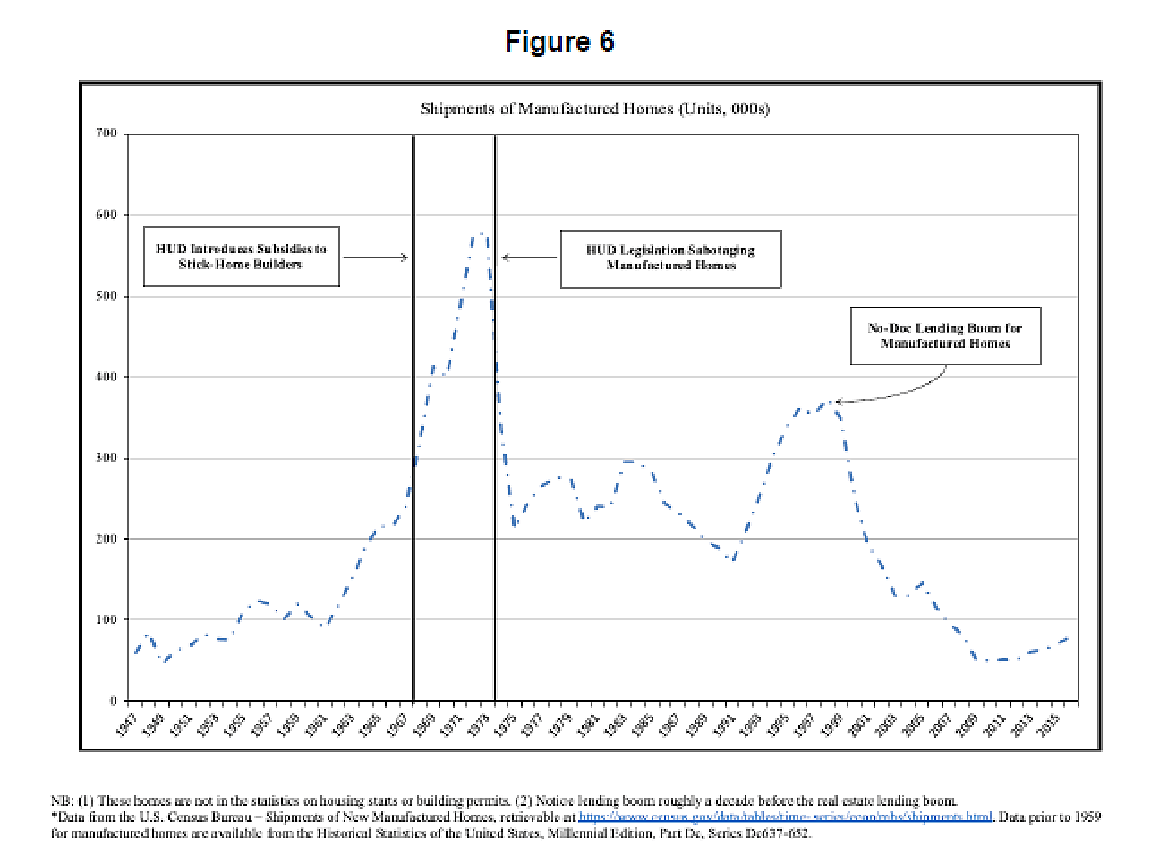
Federal restrictions on factory housing. As documented in a new paper by Minneapolis Fed economist James Schmitz, Jr., a cabal of building contractors, building craft unions, building code inspectors, architects, materials producers and politicians—primarily the National Association of Homebuilders (NAHB) and the U.S. department of Housing and Urban Development (HUD)—successfully worked in the 1970s to block the rapid growth of higher-productivity, lower-price factory housing in the United States. They did this by (1) subsidizing traditional, “stick-built” housing (and denying the same subsidies for factory housing) through low-rate “Section 235” mortgage loans; and (2) creating a strict and costly national building code (Nat-BC) regulation that applied to only factory housing and severely diminished its competitiveness in small towns and rural areas. The result: a national collapse in manufactured homes:
- Tariffs. As I documented in a recent blog post (and as noted in various anecdotes), the federal government currently imposes “import restrictions on almost everything you need to build a house, from the foundation to the roof and in between,” thus imposing higher costs on U.S. builders and, in turn, consumers:

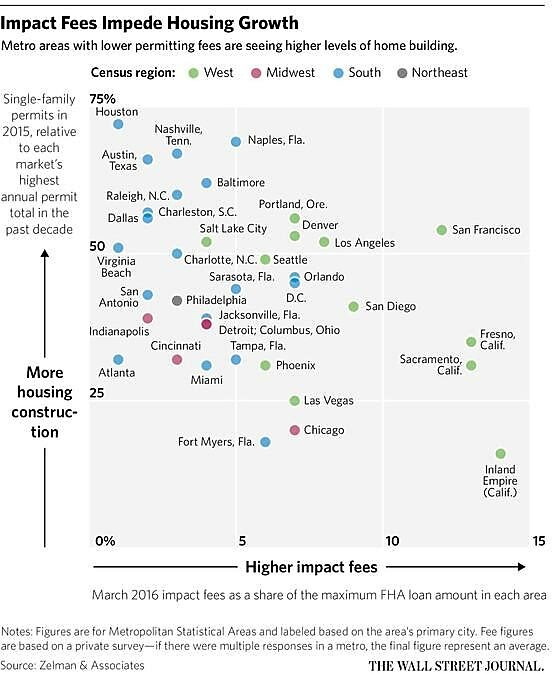
- Government fees. Local fees for permitting and construction in major metro areas have increased substantially in recent years to about $21,000 on average (but ranging from about $2,600 to a whopping $72,000). These fees disproportionately hinder entry-level housing, which has tighter margins that don’t allow builders to pass on the fees to buyers, and they can price houses out of the price range for cheaper loans backed by the Federal Housing Administration. As you can see from the chart below, places with lower fees tend to have more housing (and vice versa):
Builders could surmount this obstacle by building multifamily housing (apartments), but they are often blocked by the aforementioned land use regulations. And even when they can build, government fees can remain a serious impediment: according to one study, for example, around one quarter of the cost of building affordable housing in California goes to government fees.
Tax and other policies.
The aforementioned policies are probably the ones that most commonly arise in discussions of housing policy, but others also play a role. For example, economist Alan Cole earlier this year found that (1) itemized deductions for property taxes and mortgage interest, intended to increase housing affordability, “have the perverse effect of increasing the price of existing homes, making it hard for young would-be-homeowners looking to buy for the first time”; and (2) recent limitations on these deductions—implemented in the Tax Cuts and Jobs Act (TCJA) of 2017—have slowed home price growth in some of the costliest places in the country.
In the rental market, the Tax Foundation’s Scott Hodge notes that current tax policy, which requires apartment developers to depreciate (write off) their construction costs over decades, raises the real cost of those investments because the dollars invested today are worth less—due to inflation and the “time value of money”—when they’re finally deducted from the developers’ taxes in 20-plus years. This tax treatment can not only make other investments more attractive than real estate, but also discourage the construction of low-income apartments, which tend to have lower profit margins (due to lower rents but many of the same upfront costs and fees as fancier buildings). Put another way, current tax policy raises investors’ total cost of building, thus making some low-income units unprofitable (as opposed to higher-margin luxury units). According to the organization’s estimates, a more neutral tax approach that accounts for inflation and the time value of money would reduce construction costs by around 11 percent, thus making low-income units more profitable (and therefore more likely to be built).
Other policies potentially affecting housing include occupational licensing, immigration, transit and transportation, telecommunications, education, energy, environment, and even entitlements. But we’ll save those for another time.
Adding Supply Works—For Everyone
Regardless of what kind of housing is built, we have good evidence that adding supply in any form can reduce local rents and home prices. For example, a 2019 Upjohn Institute study of 11 cities found that new construction lowered the rents of nearby existing units by 5 percent to 7 percent and encouraged people living low-income areas to move into the now-cheaper neighborhoods. Researchers have found similar effects in specific local markets, such as New York, the Bay area, and Washington, D.C., or in other countries like Germany. In each case, the lesson is the same: more supply, regardless of its form, lowers prices.
Recent anecdotal evidence backs this up. Here in Raleigh, for example, a major increase in apartment construction “is starting to put a dent into the region’s rising rents.” On the flip-side, pandemic-induced departures from major urban areas have caused rents to collapse:
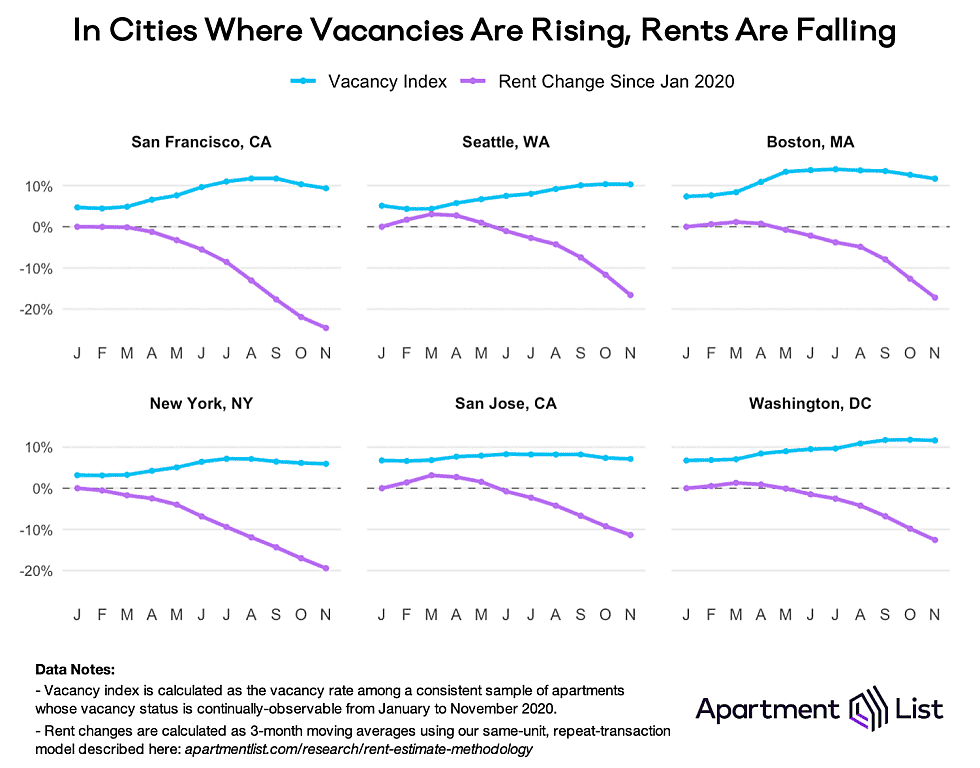
The conclusion here is straightforward: if you want lower home prices and rents, build more housing.
Summing It All Up
Decades of bad federal, state, and local housing policy have increased land and construction costs (and thus home prices and rents) in the United States—particularly in coastal urban areas—and this trend can indeed affect many Americans’ standard of living, even if their incomes have increased. The good news is that the laws of supply and demand still work in housing, so if we want more affordable housing (and higher living standards) in these places, the solutions are pretty easy: reform land use regulations and the myriad policies that inflate the cost of building a home or apartment complex. Of course, the politics of doing so are not-so-easy: not only are many of these policies local (thus negating a single federal response), but they’re also supported by powerful entrenched interests—NIMBYs, the NAHB, various government officials, etc. But at least we know what to do, even if actually doing it remains a challenge.
Still, it’s important to reiterate that affordability is primarily a regional, not national problem—though it can have important national effects. Beyond the St. Louis Fed RPP data on regional rent differentials that I already noted, the latest data from Harvard show that home prices in much of the country remain at relatively comfortable levels (typically anything below 4 in the map below is considered affordable, though today’s insanely low mortgage rates have probably moved that closer to 5).
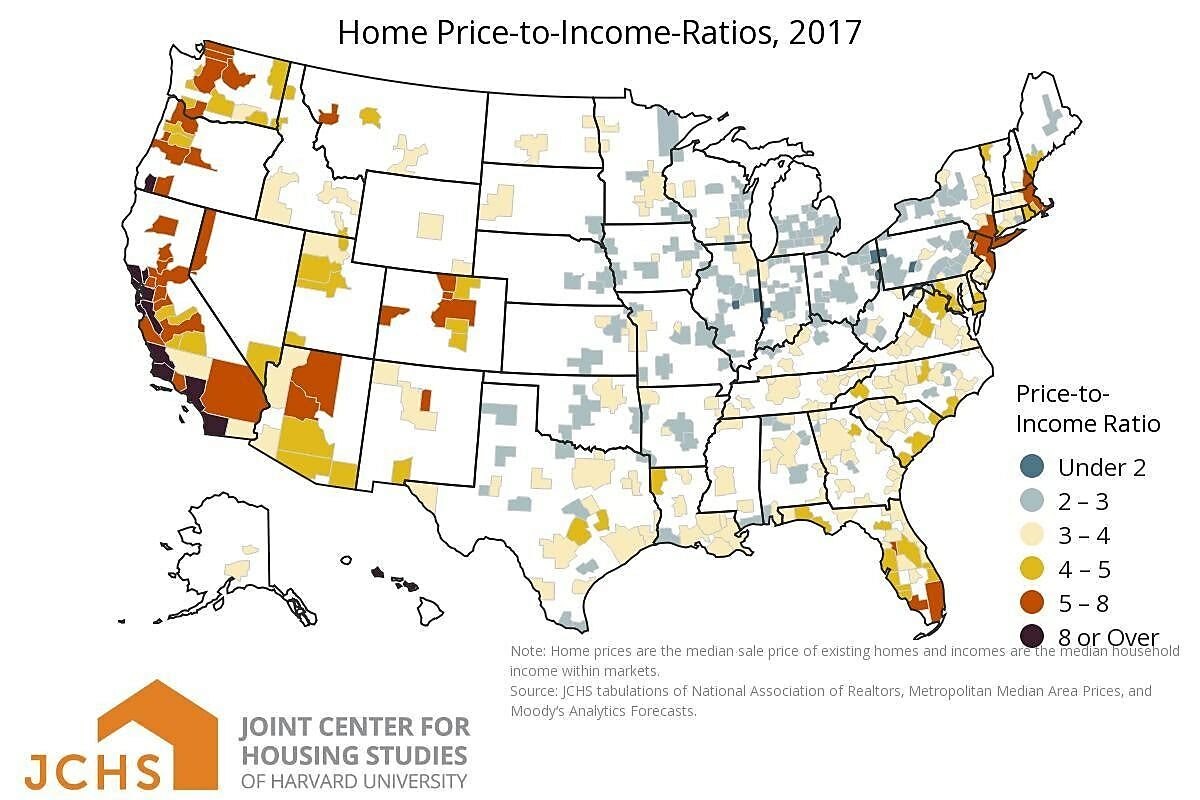
As economist Jeremy Horpdahl frequentlynotes on Twitter, moreover, this includes plenty of places that have jobs and a nice quality of life (more on this in another newsletter). So one way to beat the NIMBYs and the bureaucrats is simply to move away from the places they control to other, more hospitable environments. As I’ve been documenting recently, the spike in remote work opportunities arising from the pandemic may make that move easier, and in so doing could change the longstanding housing dynamics just discussed. That doesn’t mean we shouldn’t reform U.S. housing policy, however. It just argues for an “all-of-the-above” approach to it—one that tackles all of the policies that inflate land and building costs; that makes it easier to build everywhere, not just in major urban centers; and that maximizes Americans’ freedom to live (and work) where they want.
I hope you all have a very Merry Christmas. See you in the new year.
