When we discussed remote work’s benefits and durability a few months ago, I omitted one other great feature: its potential to allow Americans to live where they want to live instead of simply where their jobs are located. That’s good on its own, but it also comes with a big policy bonus if workers exercise their newfound freedom in large numbers: Their moves can pressure state and local governments to improve costly tax, housing, education, and other policies, and they can rejuvenate some of the places that our modern economy (supposedly) left behind.

I started wondering (fine … dreaming) about this prospect in 2020—long before we knew whether pandemic-driven increases in both remote work and migration were going to last once COVID was behind us—noting that “superstar cities” like New York and San Francisco that have long had effective monopolies on certain high-paying, high-demand “knowledge” jobs and industries (finance, tech, corporate law, entertainment, etc.) might need to change policies that make residents’ lives less affordable or else risk losing them to lower-cost places. 

Feel free to read that blog post yourself, or just trust that I was prescient way back then (if I do say so myself). That’s because we now have a few years of data showing that, thanks in large part to remote work, many people are moving again and lower-cost states and localities—including some of those “forgotten” ones—are gaining as a result.
Many Americans Are Moving, Often for Policy-Related Reasons

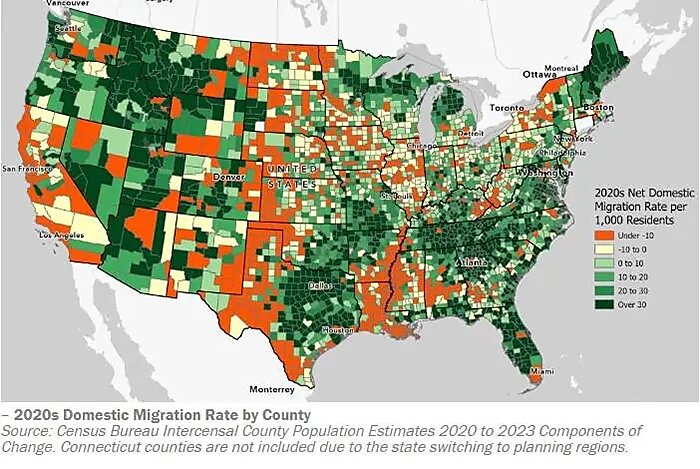
As recently documented in a great new report from UVA’s Cooper Center (go Hoos!), the latest Census Bureau data show that in the 2020s Americans have increasingly moved away from large and expensive cities and states to smaller (though not necessarily small) and more affordable ones:

lincicome-chart-6-5-24-img-1.jpg

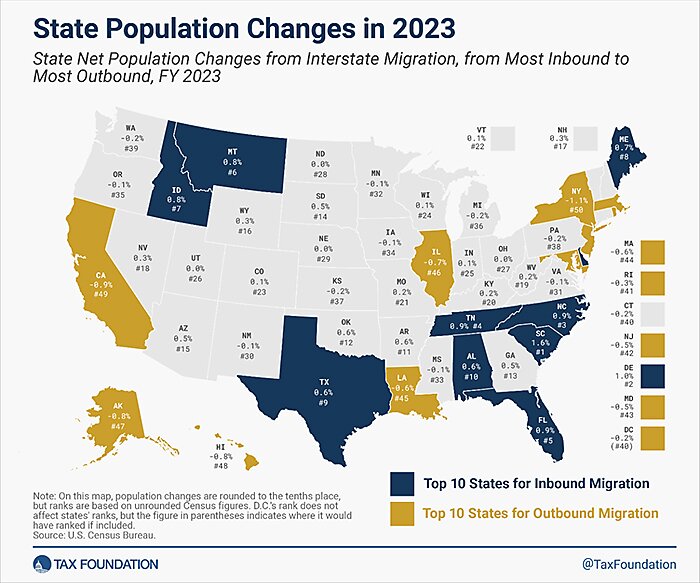
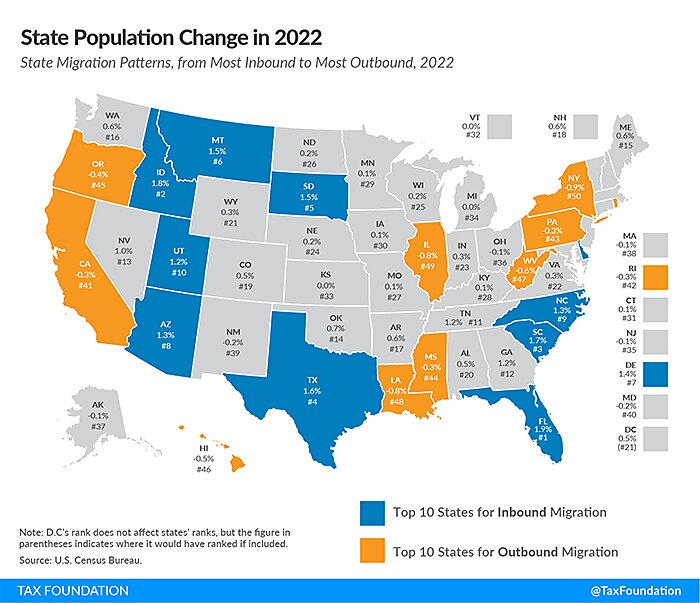
The Tax Foundation provides additional data on 2022 and 2023 migration across states and ranks each based on its inbound (good) and outbound (bad) total for the year. The annual maps show the same general trends as the longer-term UVA one: The big migration winners are generally Texas and states in the Mountain West, Southeast, and upper Northeast, while the big losers are New York, California, Illinois, and a smattering of other usual suspects.

lincicome-chart-6-5-24-img-2.jpg
lincicome-chart-6-5-24-img-3.jpg

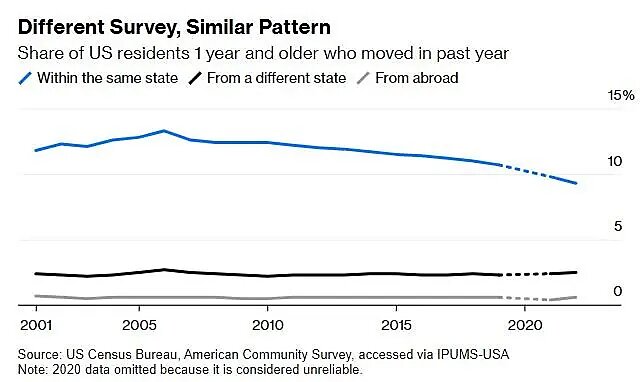
Many Americans, especially younger ones, also appear to have become more willing to move out of state since the pandemic began. As Bloomberg’s Justin Fox shows, the overall rate of U.S. migration has slowed substantially because Americans are generally getting older and short moves have collapsed. Interstate moves, on the other hand, have held steady or even ticked up (depending on which survey you use):

lincicome-chart-6-5-24-img-4.jpg

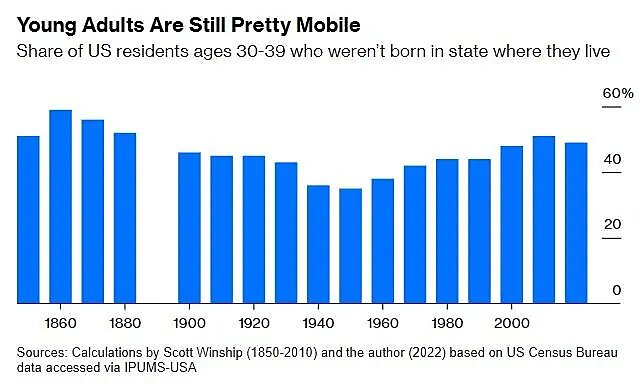
In 2022, moreover, almost half (49 percent) of Americans aged 30–39 were born somewhere other than the state in which they were now living—“slightly lower than in 2010 but still higher than at any point during the 20th century.” (Immigration doesn’t much affect the overall trends here.)

lincicome-chart-6-5-24-img-5.jpg

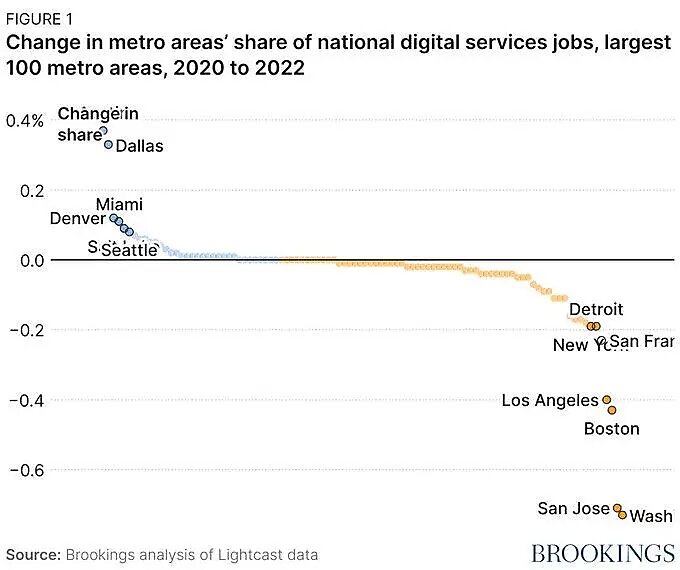
Jobs are also moving. For example, the Brookings Institution recently found that wonks’ and philanthropists’ decades-long dream of decentralizing U.S. tech jobs away from Silicon Valley and a handful of other “Big Tech towns” finally started materializing in 2020–2022. Since the pandemic began, in fact, vibrant “rising star” metro areas—Dallas, Denver, Miami, Salt Lake City, Provo, Nashville, Houston, and Jacksonville—saw substantial growth in tech employment, while “for the first time in decades,” San Francisco and San Jose “actually saw their share of the nation’s tech sector employment fall, given their relatively tepid employment growth at a time when other places were surging.”

lincicome-chart-6-5-24-img-6.jpg

Financial jobs have also decentralized. New York remains the mecca, but Dallas (nicknamed “Y’all Street” lol) has seen massive growth since 2020 and recently supplanted Los Angeles as No. 2. As Forbes highlighted a year ago, more than $1 trillion in financial assets has left NYC, with Florida another big winner—and not just for crypto bros and high-profile billionaires—along with Charlotte and Nashville.

As the Forbes piece indicates, some of these moves aren’t policy-related: Companies want better access to talent and big clients; workers move for better weather or scenery, for family or jobs, or for a host of other personal reasons. But policy, especially taxes and affordability (especially housing) plays a big—likely dominant—role here too:

For companies, real estate, labor costs and taxes are significantly cheaper compared to New York City. Organizations can cast a wider net for talent by establishing hubs in new regions, like Charlotte, Nashville, Dallas or Palm Beach. Due to technological advances, employees no longer need to be tied to physical trading floors. Moving closer to certain customer bases also improves a firm’s ability to serve those demographics.

For workers, warmer weather, lower costs of living, lower density and no personal state income tax in states like Texas and Florida are certainly a draw.

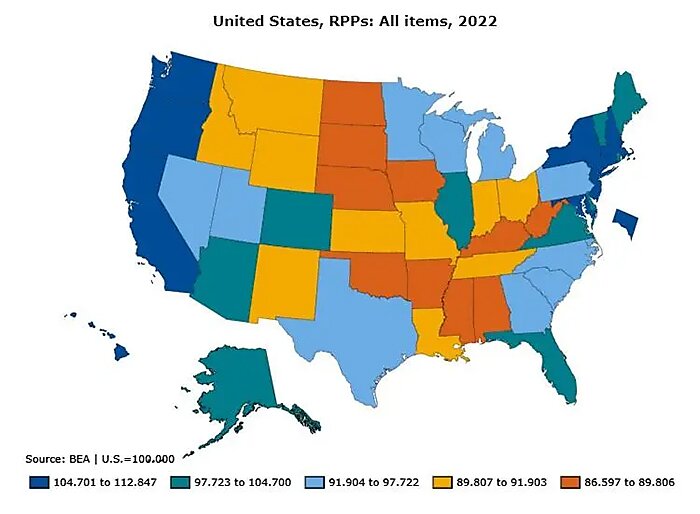
Beyond these anecdotes, there’s also a clear correlation between the places gaining residents and those with lower costs, as this U.S. Bureau of Economic Analysis map of states’ relative affordability (called “regional price parity”) shows:

lincicome-chart-6-5-24-img-7.jpg

As you can see, the states gaining the most new residents in 2022 and 2023— basically the Southeast, the Mountain West, and Texas—were also among the more affordable places to live. (Metropolitan Regional Price Parity data show similar things but are incomplete.)

The Tax Foundation has similar findings: Americans tended to move from higher-tax, higher-cost states to lower-tax, lower-cost states in 20212022, and now 2023. Here’s their summary of the latest data:

Americans are leaving high-tax, high-cost-of-living states in favor of lower-tax, lower-cost alternatives. Of the 32 states whose overall state and local tax burdens per capita were below the national average in 2022, 24 experienced net inbound migration in FY 2023. Meanwhile, of the 18 states and D.C. with tax burdens per capita at or above the national average, 14 of those jurisdictions experienced net outbound migration…. Data released last week from U‑Haul and United Van Lines, while less robust than Census data—and undoubtedly influenced by these companies’ geographic coverage—show similar overall migration patterns. 

Elsewhere, they point to new research showing a tight relationship between migration and taxes—something my Cato colleague Chris Edwards has also documented repeatedly in his work.

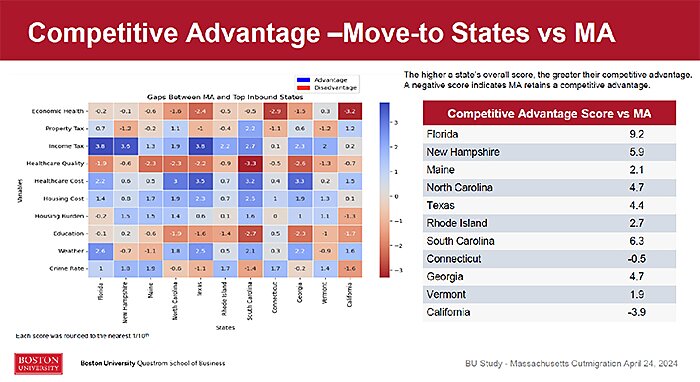
Finally, a new study out of Boston University examines migration out of Massachusetts—one of the slowest-growing states in the country and one experiencing a large and accelerating bout of out-migration, despite an unemployment rate at or below the national average. It finds that the Bay State is seeing a “growing exodus” of prime-age workers and higher-earning workers, and that they’re headed to states with lower taxes, lower housing costs, and lower health care costs.

lincicome-chart-6-5-24-img-8.jpg

Especially noteworthy here is that several destination states have worse weather than Massachusetts—something this lifelong Southerner didn’t even know was possible. Regardless, that New Hampshire and Maine are winning Bay Staters should quell longstanding claims that interstate migration is all about warmer weather. Last year, the Massachusetts Taxpayers Foundation found similar policy factors driving the state’s outflow of workers (along with miserable commutes).

Overall, the data paint a clear policy picture: States and localities that push too hard on taxes, refuse to allow new home construction, or otherwise burden residents’ budgets are seeing those residents flee for better alternatives.

Interstate Migration’s Costs and Benefits

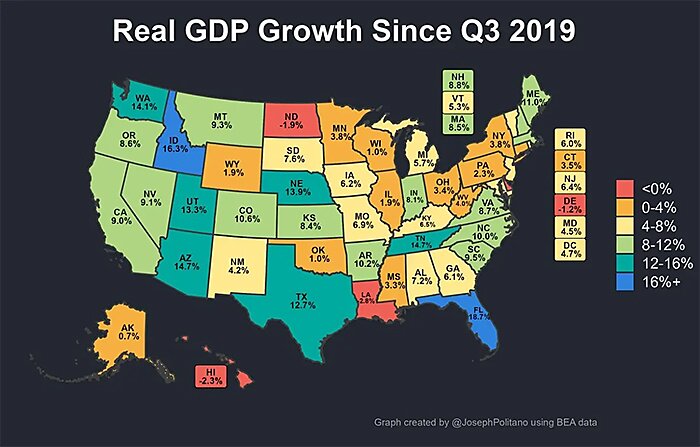
The recent migration trends in the United States have significant implications for state and local economies. As the UVA analysis mentions, many of the places that have experienced rapid gains in population because of their lower housing costs are now experiencing rapidly appreciating home prices that, if not addressed, could price out locals and newcomers alike. In general, however, the influx of people is a good problem to have: As economist Substacker Joey Politano showed back in January, the states and counties with the highest levels of domestic in-migration are also places experiencing outsized employment and economic growth (in both white collar industries and blue collar ones). Here’s state GDP growth:

lincicome-chart-6-5-24-img-9.jpg

And here are a few local stats, showing new superstar metros once again surpassing the old ones:

The Dallas metro area, despite being less than 1/3 the size of the New York metro, has contributed more to nationwide economic growth over the last three years than any other. Miami alone has contributed more to nationwide growth than the four largest midwestern metros combined, and Austin was likewise the fastest grower among America’s 100 largest metros. Those areas roundly beat out some of the “superstar cities” that led growth throughout the 2010s—as the NYC and LA metros in particular have had a very weak recovery from the pandemic.

(Plenty more charts at the link—Joey likes ‘em as much as I do.)

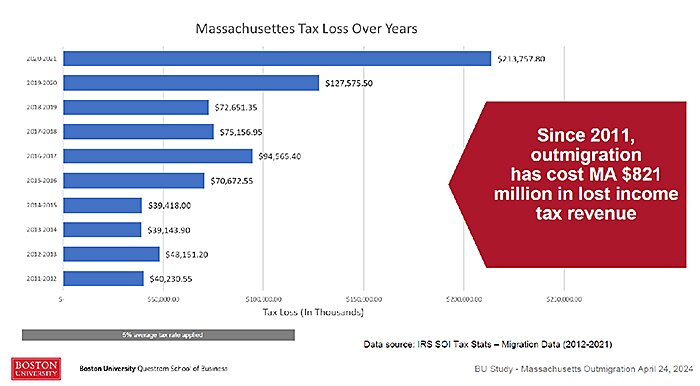
Meanwhile, and as Politano’s last sentence above indicates, the American states and cities losing residents are struggling beyond just weaker GDP and job growth. In Massachusetts, for example, that BU study finds that outmigration since 2011 has cost the state $821 million in income tax revenue, more than a quarter of which ($213 million) came in 2020–21:

lincicome-chart-6-5-24-img-10.jpg

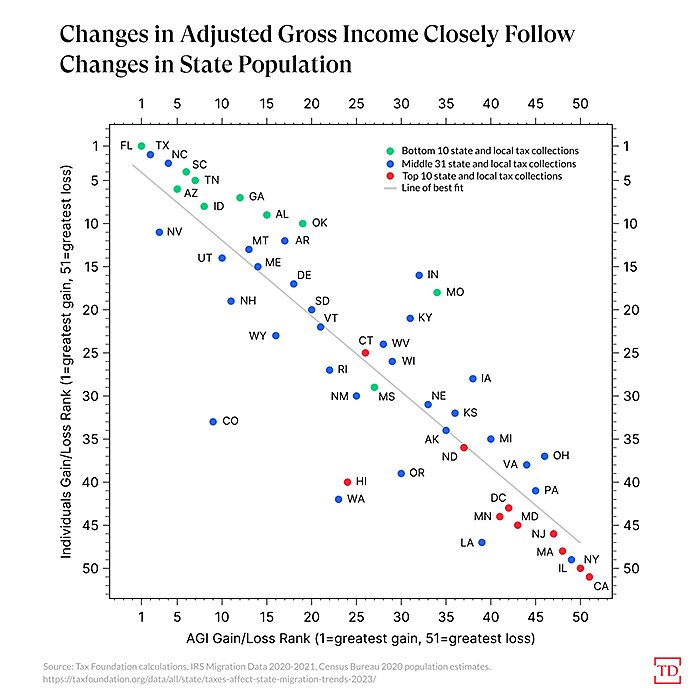
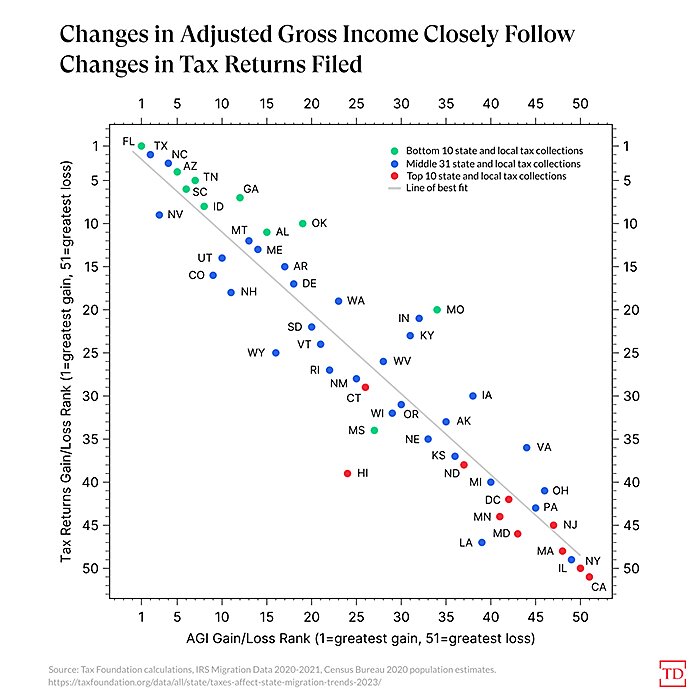
The study’s authors further find that “Massachusetts lost $4.27 billion in adjusted gross income due to net outmigration”—losses that also accelerated substantially over the last decade. The Tax Foundation has found similar (or even bigger) income losses in other states experiencing substantial outmigration:

lincicome-chart-6-5-24-img-11.jpg
lincicome-chart-6-5-24-img-12.jpg

Unsurprisingly, states with large levels of domestic in-migration have enjoyed precisely the opposite trends: All but two of the top 15 population-gaining states saw top-15 increases in income (AGI). 

Remote Work Is Driving Interstate Migration

So people are moving more, and state economies are feeling it. The next question is why now?

The authors of that Brookings study above oddly try to credit some of the geographic shifts they identify to U.S. industrial policy—in particular the “placed-based” subsidies embedded in the CHIPS and Science Act and the IRA—but this makes little sense. Those laws passed Congress in mid-2022 and are only just now being implemented, while the trends we see in the data started right after the pandemic hit (and some even earlier). 

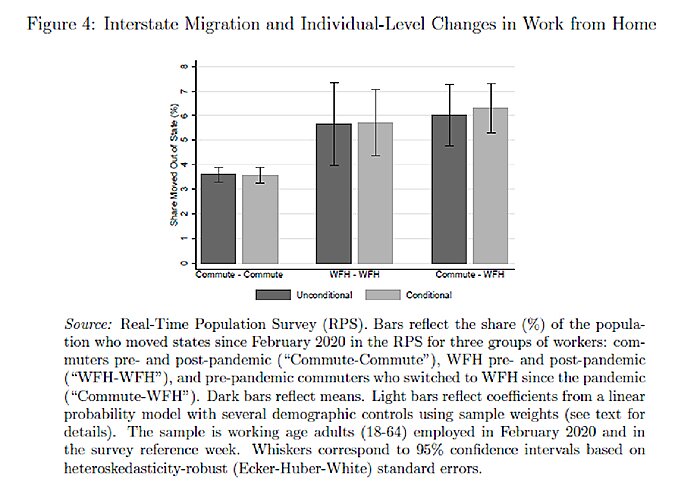
Instead, it’s far more likely that Americans’ moves have been driven by private sector initiatives and market factors, especially remote work. That was the educated guess of a lot of the folks already linked above, but now we have harder proof in a new study from the St. Louis Fed, which finds that the post-pandemic increase in remote work (work-from-home or “WFH”) accounted for more than half of the increase in U.S. interstate migration between 2019 and 2022. As shown in the chart below, the authors calculate that remote workers had substantially higher rates of interstate migration (even after controlling for demographic variables and pre-pandemic remote work status) as compared to workers with daily commutes, and that interstate migration was highest among workers who went from commuting to remote work after the pandemic hit. These and other data are sufficient, the economists believe, to conclude that increased remote work didn’t just coincide with increased migration; it caused it.

lincicome-chart-6-5-24-img-13.jpg

The authors further find that states like Massachusetts, New Jersey, and Maryland with more capacity for, and larger post-COVID increases in, remote work experienced substantially higher rates of out-migration during the period examined—just as I guessed back in 2020. They conclude that interstate migration will remain strong as long as remote work persists, with “potentially important consequences for state government budgets, state housing prices, and state economic output.” 

The only question left is how governments will respond. Do they get busy embracing policies (example) that attract and keep residents who suddenly have more options, or do they just get busy dying?

The Market’s ‘Place-Based Policy’

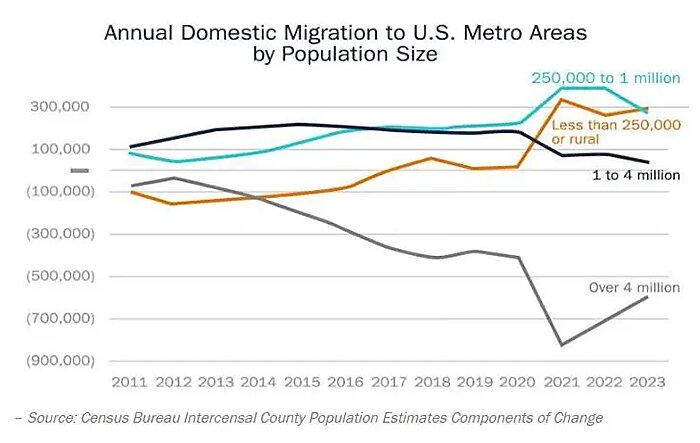
Finally, this migration has generated another nice benefit: As UVA’s analysis of the latest census migration data show, the pandemic, remote work, and other market forces have boosted not only cities like Dallas and Nashville, but also many of the same distressed communities that place-based industrial policy advocates say they want to target:

Perhaps the most remarkable statistic in the 2023 population estimates data is that last year the country’s rural counties and smallest metro areas—those with fewer than 250,000 residents—became the top destination for people moving within the country for the first time in decades. Migration into these areas rose exponentially during the pandemic, and still, the net number of people moving to them rose again last year. Many of the small towns and rural counties that experienced a surge in new residents last year were places that are relatively attractive to vacationers, such as Georgetown, South Carolina, south of Myrtle Beach. But many other communities less well known to tourists also have seen a surge in new residents in recent years after years of out migration. Martinsville in southern Virginia is one of them. It was once known as “The Sweatpants Capital of the World” due to its now-closed textile mills, and during the 2010s, Martinsville was part of the poorest state senate district in Virginia. However, in recent years, it has experienced some of the strongest wage growth in Virginia. In 2023, the domestic migration rate into the Martinsville region was the second highest among Virginia’s metropolitan and micropolitan areas.

lincicome-chart-6-5-24-img-14.jpg

Previous analyses show similar trends, with remote work again being a major driver. As the New York Times’ Eduardo Porter noted in 2022, “Economists have long voiced fear that rural places” like the former Tennessee textile town he visited “are being left behind,” but suddenly these towns have enjoyed a “boomlet” thanks to remote workers fleeing high-cost cities. The latest data confirm that the good times are continuing.

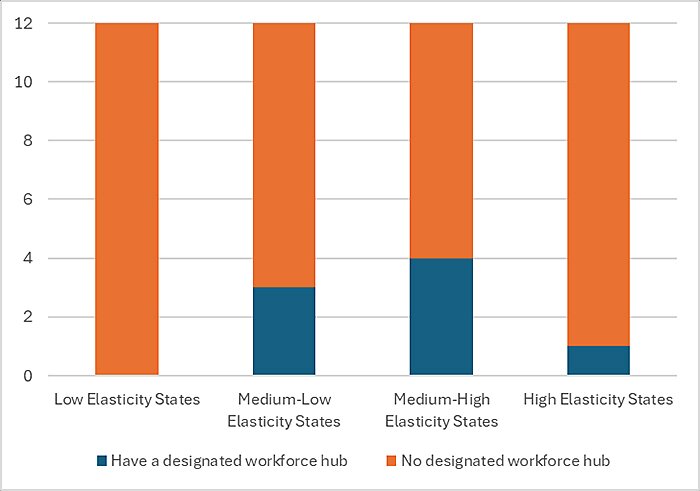
And what about all those new place-based industrial policies? Well, the jury’s still out on those because the subsidies have just started flowing, but a new analysis from employment analyst Matt Darling already provides some reasons for concern. In particular, he shows that only one of the nine new U.S. “workforce hubs” recently targeted for place-based subsidies is located in a “high elasticity” state (i.e., a state that has low levels of employment and is thus well-suited to receive workforce-growing subsidies). By targeting lower-elasticity states with tight labor markets (including some with booming economies), the funds are—per previous scholarly work on place-based subsidies—less likely to produce the outsized returns that these policies are supposed to generate.

lincicome-chart-6-5-24-img-15.jpg

And what is driving the White House’s decision here? Well, as Darling notes, six of the eight states with designated workforce hubs—Arizona (Phoenix), Georgia (Augusta), Michigan, Ohio (Columbus), Pennsylvania (Philadelphia and Pittsburgh), and Wisconsin (Milwaukee)—just so happen to be critical swing states in the 2024 election. Another subsidy recipient is New York, home to Senate Majority Leader (and notorious subsidy champion) Chuck Schumer, and the last one is Maryland, which is next door to Washington, D.C., and hosting a hotly contested Senate race in 2024.

I’m sure it’s all just a coincidence.

Charts of the Week

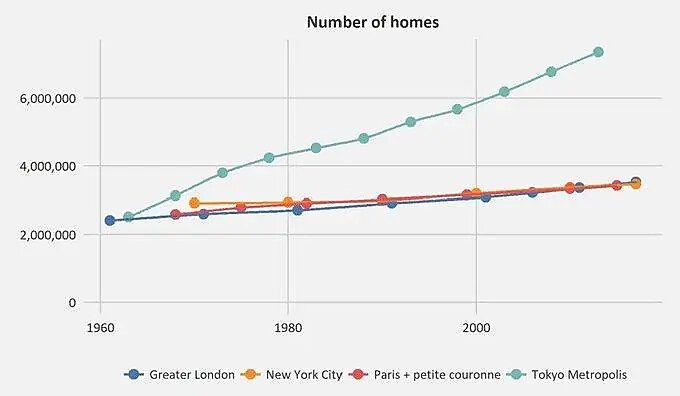
Tokyo apartments are cheap, and you’ll never guess why:

lincicome-chart-6-5-24-img-16.jpg
lincicome-chart-6-5-24-img-17.jpg
lincicome-chart-6-5-24-img-18.jpg