Dear Capitolisters,
Not Ready for Prime Time
Understanding the decline in labor force participation by workers in their prime.
A common rebuttal to my and others’ insufferable economic optimism (and the many charts backing us up) is that, well, sure, things are pretty good for workers and the economy generally, but they’re really bad for large parts of the country—especially low-skill workers in their prime years who have dropped out of the labor force to an alarming degree. This problem is then usually blamed on various things—globalization, automation, big business, etc.—that decades of laissez faire economic policy (aka “free market fundamentalism”) have allowed. On the surface, the argument has some merit—the pre-pandemic labor force participation of prime-age American workers, especially men, has steadily declined. But, as new research shows, a deeper dive into the data paints a much more complex situation—one driven as much by government policy as by market forces, if not more so.
Charting the Decline in Male Labor Force Participation
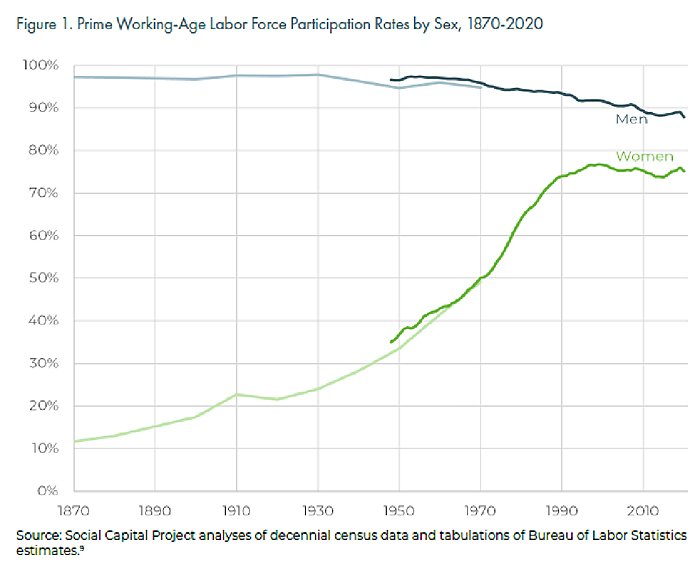
As shown in a new report from the Senate Joint Economic Committee Republicans’ Social Capital Project, there are substantial differences in the rates at which “prime-age” (ages 25–54) American workers have participated in the U.S. labor force over the last several decades. Probably the most notable difference is by gender, with male labor force participation steadily declining since the 1950s:
Since 1964, there have been more jobless prime-age men who are not looking for work than jobless prime-age men who are actively looking for employment. This has been true in every year except 1982 and 1983. Even during the COVID-19 pandemic when unemployment reached 14.8 percent, on an annual basis, the growing population of inactive men still outnumbered those actively looking for work in 2020. Until the early 2010s, there were typically only one or two inactive prime-age men who were not looking for work for every one prime-age man looking for work. In 2019, there were four times as many prime-age men out of the labor force as there were unemployed and looking for work. Inactivity among prime-age men has risen over time, and risen significantly in the more recent past.
The JEC report further documents how declines in male labor force participation have been primarily concentrated among those—both men and women—with less education (i.e., less than high school (LTHS) or high school and some college (HS/SC) education):
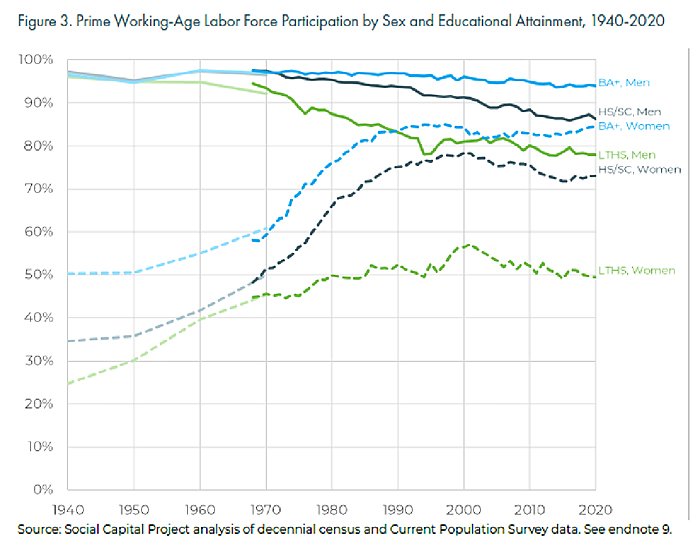
As the report explains, declining labor force participation isn’t necessarily a bad thing, to the extent that a worker’s decision to exit the job market is for benign or non-economic reasons. And, indeed, the pre-pandemic data show that much of the male non-participation is for precisely these reasons. In 2017, for example, 13 percent of inactive prime-age male workers were in school; 9 percent were taking care of family or were homemakers; 6 percent were retired; and 47 percent were disabled (self-described). Only 24 percent of inactive men weren’t in one of these categories.
Still, this 24 percent represented about 1.7 million American men who very likely should have been working—a pool of idle workers that undoubtedly expands when you add similarly inactive women, workers outside “prime age,” and those who are “disabled” but probably could work.
So What’s Going On?
There has been a ton of academic debate about the causes and consequences of prime-age inactivity in the United States. Non-participation could be caused by declining employer demand for workers (e.g., because they lack skills or education) or declining supply (i.e., workers choosing not to supply their labor). The JEC report admirably summarizes much of the research on both the demand- and supply sides (even more here), and there’s way too much in there for me to discuss today. Instead, I’d like to focus on a few things that in my mind stand out:
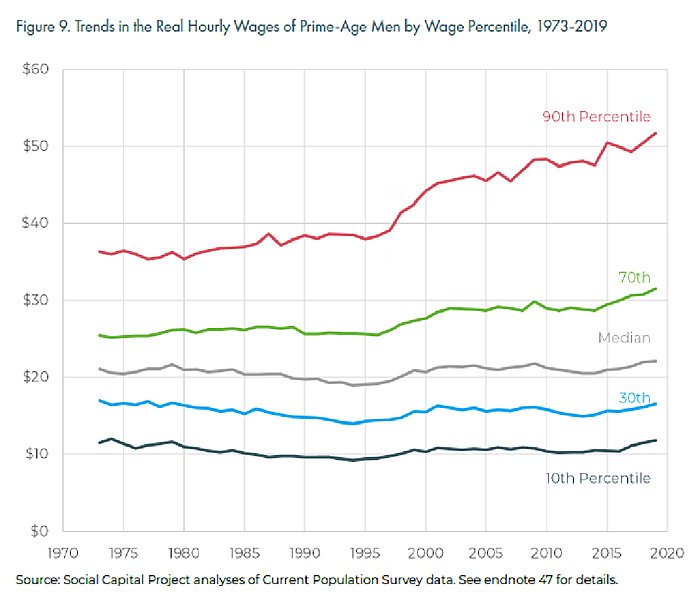
First, none of the trendy “demand side” explanations that we hear so much about today—from the left and the right—tidily fits the data. The clearest sign of falling demand for workers would be declining wages and compensation over time, as these workers became increasingly unable to command higher (or even the same) pay in the U.S. labor market. However, as shown in the following charts, the wage data provided in the JEC report don’t lend themselves to an easy demand-side narrative because the vast majority of workers’ wage stagnation—no matter how you slice it—ceased decades ago:
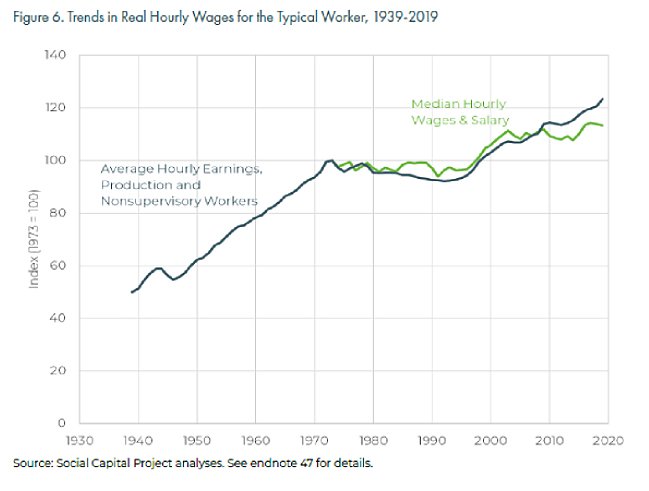
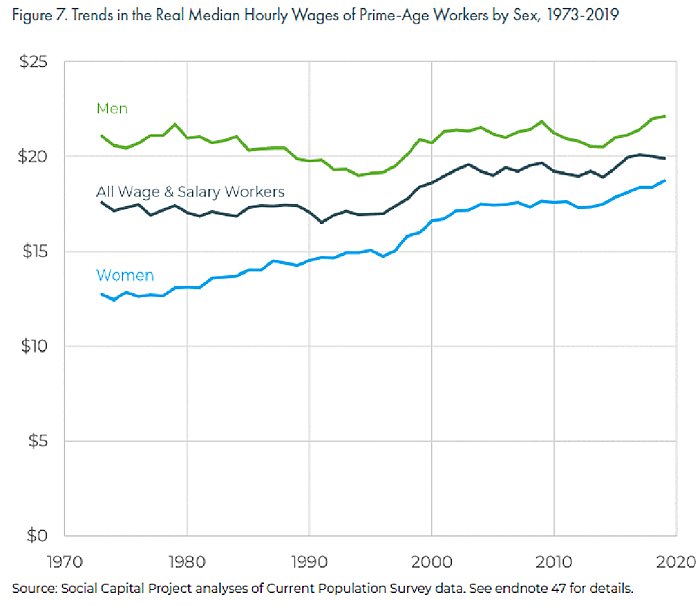
As the JEC report notes, from 1994 to 2019, wages for male workers increased by 17 percent—not much lower than women’s 25 percent increase. Thus, male wage “stagnation” primarily occurred during the 1970s, 1980s, and early 1990s, while “the trajectory of pay over the past 25 or 30 years has been upward for both men and women.”
Similar trends emerge when examining male wages by their relative magnitude. As shown in the next chart, male workers earning at or below the median wage saw their base pay bottom out in the mid-1990s but then generally increase (outside of recessions) through 2019 when the pandemic hit.
The trends are basically the same—in most cases even a little better—when considering all employer compensation (not just wages), and annual (not hourly) compensation. As the JEC report notes (and as we’ve discussed), including non-wage contributions is important because they’ve increased from 13 percent of compensation in 1973 to 19 percent in 2019.
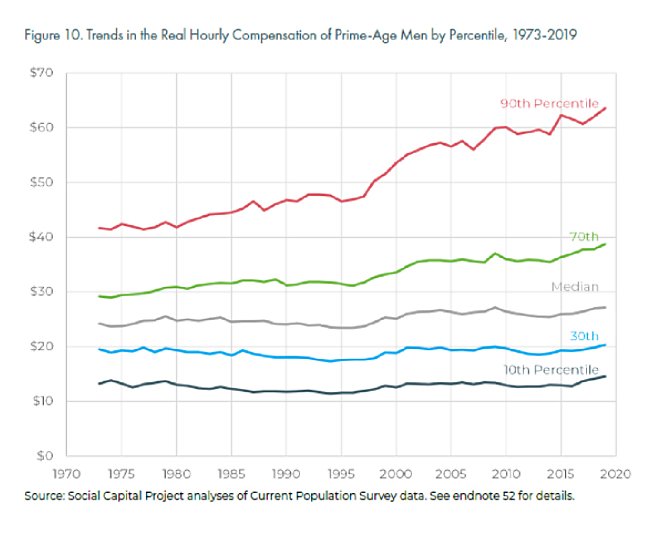
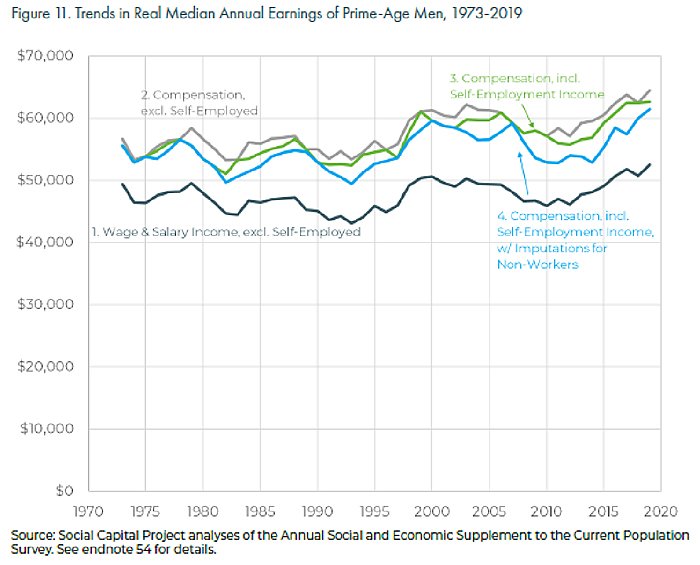
The JEC report thus concludes:
In summary, the bulk of the evidence suggests an upward trajectory of pay over the past 25 or 30 years for men and even more so for women. Following a long post-WWII boom, wage growth paused before returning to a respectable growth path in the 1990s. By choosing arbitrary time intervals, or narrowing the analysis to constantly shifting education cohorts, it is possible to tell a more pessimistic story. However, even these more stagnationist formulations tend to show constant, rather than declining pay.
The report has plenty more to say on this issue and its potential drivers, but my main takeaway from the charts above—other than the obvious effect of millions of women entering the U.S. workforce since the 1940s, I mean—is that none of the trendy things supposedly driving declining male labor force participation align with the data. On trade, for example, the United States entered NAFTA in 1994 and the WTO in 1995, and the “China Shock” didn’t start until 2000 or so—almost a decade after the middle class male wage stagnation of the ‘80s and 1990s had ended. (Those stagnante 1980s and 1990s, by the way, also featured far more U.S. industrial policy, far less global integration, a more globally-influential United States, and dozens of “competitor” countries still foundering under communism or socialism.) The most significant technological disruptions—computers, industrial robots, the internet, etc.—also became prevalent in the 1990s and accelerated thereafter, as did supposed industry concentration.
This misalignment doesn’t mean, of course, that these and other, more recent forces had no effect on the domestic demand for low-skill workers, but the tidy populist narrative of China (or robots or whatever) singlehandedly destroying American breadwinner families just doesn’t seem to hold much water. (The JEC digs further into these and other issues in the report, if you’re interested.)
Second, there’s little other support for the common theory that “industry concentration” and heightened “monopsony” power among U.S. employers has caused wage growth to stagnate and decouple significantly from workers’ productivity (thus depressing workforce participation). In particular, the JEC report shows that commonly cited analyses of the supposed “pay-productivity” gap disingenuously compare the hourly productivity of all workers to the hourly compensation of a subset of workers (production and nonsupervisory). When comparing apples (hourly productivity, excluding self-employment) to apples (hourly compensation using a better gauge of producer inflation—the “implicit price deflator”), the gap almost entirely disappears:
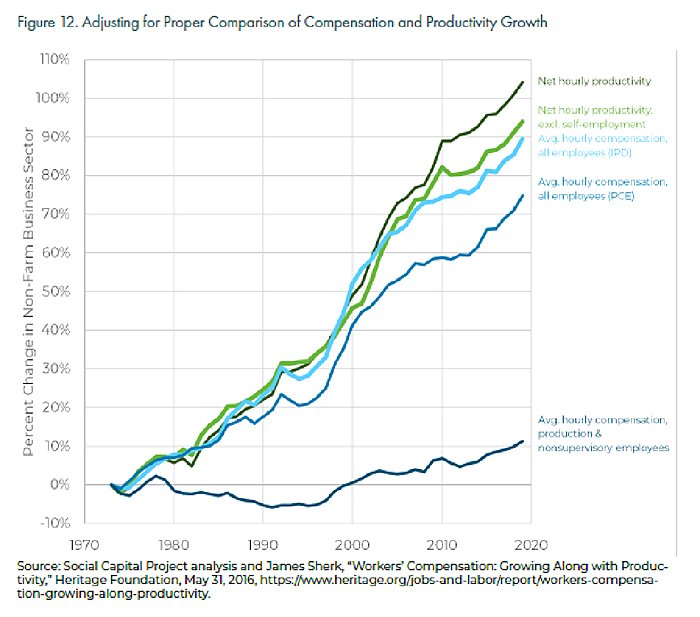
The report then cites oodles of scholarly research—from economists on the left and the right and drilling into the industry and firm levels—supporting the conclusion that “workers continue to be paid for what they can produce” (see pp. 26–27 for more).
Third, we need to pay more attention to how government policies can affect both the demand for and supply of certain U.S. workers. We’ve covered some of this, such as occupational licensing and zoning, before so I won’t rehash that work here. Another one — how very few inactive, prime-age, able-bodied men said they actually wanted a job and how the 90 (yes, 90) different U.S. safety net programs might make their non-work a viable financial alternative to work — deserves its own column, so I’ll just note it here for now.
Instead, I’d like to focus the remainder of today on an under-discussed factor mentioned in the JEC report as potentially keeping workers out of the U.S. labor market: criminal justice policy. As the report notes, “[o]ne of the impervious barriers to stable employment in America is a criminal record,” and “[c]onnecting the formerly incarcerated to communities and work is perhaps one of the most consequential public policy levers available to reverse the trend of prime-age male inactivity.”
New research shows just how consequential America’s embrace of criminalization during the 1980s and 1990s — the peak period of U.S. wage stagnation — may have been, and not just for those who have been officially incarcerated. One brand new paper, for example, finds a strong connection between a felony conviction and labor force participation. The authors first document the incredible rise in criminalization over the last 50 years:
- The imprisonment rate—the number of individuals in prisons per 100,000 adults—from 161 in 1972 to 670 in 2007 and still at 431 by end-2018. (The world average was about 144 per 100,000 in 2015.)
- Beyond incarceration, approximately 1 in 53 American adults was under community supervision (probation or parole) last decade—a “mass probation” population almost three times as large as the prison population in 2010.
Combined, it is estimated that 19 million individuals in the United States had felony criminal convictions in 2010—nearly 12 million of which never went to prison but instead served their sentences in the community while on probation. The total represents a whopping 8.1 percent of the adult population—a share that has increased in basically every state since the 1980s:
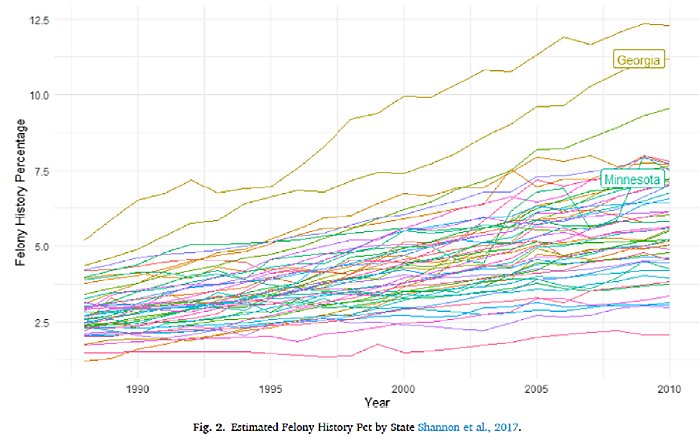
The authors then examine labor force participation over this same period and find that states that experienced a 1 percentage point increase in their felony-history share experienced a 0.33 percentage point increase in non-employment (unemployed or not in the labor force) among workers in the state. Given the country’s increasing felony-history share since the 1980s, this translated to a 1 percentage point drop in employment among Americans aged 16–54 over the same period. That might not sound like a lot, but co-author Aaron Sojourner notes on Twitter that it is about 1.7 million Americans not working (plus many more experiencing underemployment) because of a past felony conviction—an effect on American employment that would be more than six times larger than the change in the U.S. disability over the same period.
In other words, it’s huge.
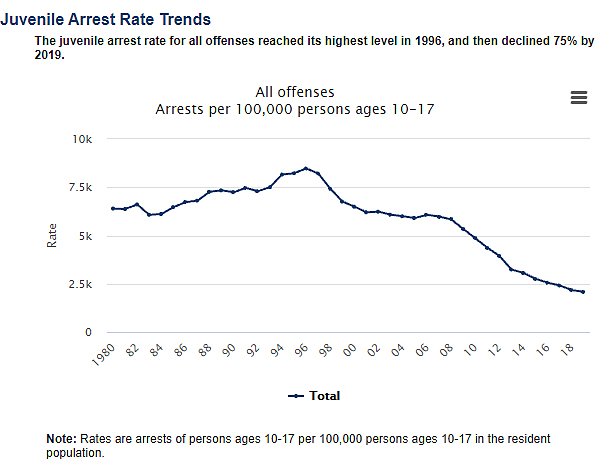
Granted, this is only one paper, but the connection between criminalization and employment is consistent with textbook economics and a growing body of academic work on the subject. One paper from 2020, for example, found that felony incarceration (which is much smaller and increased at a much slower rate than just felony convictions) caused a smaller but still significant reduction in the U.S. employment-to-population ratio between 1999 and 2016. A separate NBER paper this year found that American “youths who are convicted at or before age 17 have lower full-time employment rate and lower wage growth rate even after 10 years into the labor market”—a potentially important issue during the 1980s and 1990s when juvenile arrests increased substantially:
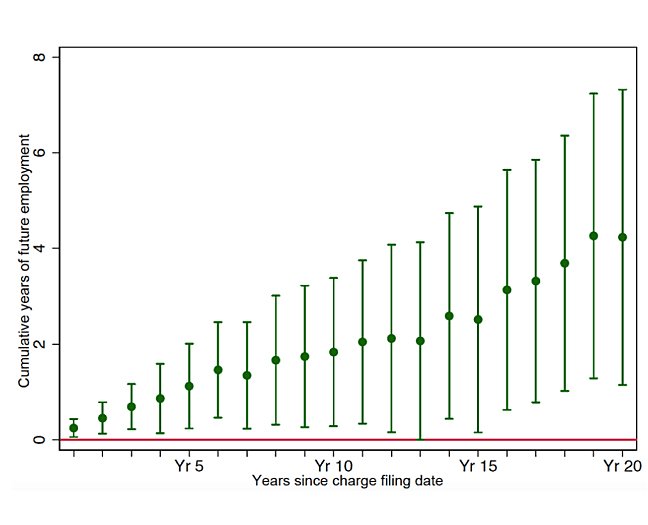
Another 2021 paper finds that the practice of “diversion,” which lets offenders serve probation but keep a criminal conviction off their records, not only reduced offenders’ chance of reoffending by half but also increased their quarterly employment rates by nearly 50 percent over 10 years—an improvement that “persists even 20 years out and is concentrated among young black men.” As shown in the chart below, diversion policy in Texas added more than four full years of employment in the 20 years after a person received it—“an enormous impact” that “suggests that diversion can permanently place an individual on a different trajectory in terms of formal employment and earnings,” helping them to find better and more stable jobs. Consistent with prior papers, the authors find evidence that avoiding the stigma associated with a conviction plays a key role in improving labor market outcomes (and reducing future offenses).
New work from Minneapolis Federal Reserve Bank finds additional support for these conclusions (and reasons for concern). The issue of how criminal justice reform might encourage Americans to enter or rejoin the labor force will hopefully be a policy priority going forward.
Summing It All Up
Declining labor force participation in the United States isn’t all bad, but some of it surely is—especially given the labor shortages popping up all over the country right now. And it’s caused many people to blame free market capitalism for the situation. As the new JEC report shows, however, the trendiest scapegoats—trade, technology, industry concentration, etc.—materialized years after the largest declines in American wages and actually coincided with slow-but-steady gains in inflation-adjusted compensation across demographic groups over the last 25 years. Such factors might, at best, be plausible contributors to the situation, rather than the primary drivers. By contrast, survey data and rigorous academic work show that various government policies—licensing, welfare, criminal justice, etc.—may be inhibiting both the demand for and supply of labor in the United States. Policy makers concerned about labor force participation should start here, instead of blaming “free market fundamentalism” (or whatever) for the situation.
Chart of the Week

Bonus Chart of the Week
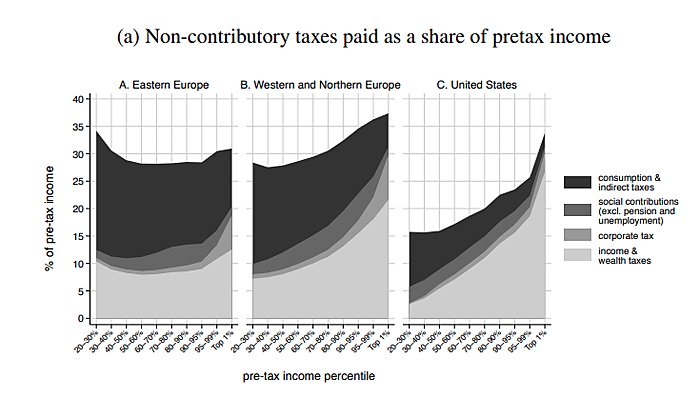
The Links
Inu Manak and I blog on the EU‑U.S. metals tariff deal
Ilana Blumsack and I blog on Sen. Hawley’s latest bad idea
10 downsides to the Dems’ latest spending plan
Supply chain crisis “real culprit” (more)
Wyden on the origins of Section 230
“Covid-19 Pushed Many Americans to Retire. The Economy Needs Them Back”
Newly-rich millennials (and a lack of supply) driving home price gains
Zillow forced to unload homes (related)
Ham-fisted U.S. industrial policy on 5G
Two-thirds of Chinese property developers breach a red line on debt
Federal vax mandate coming soon
“The Reason We Are So Rich Is That There Are So Many of Us”
Walmart hiring supply chain workers at $20/hr (Costco raises minimum to $17)
