Fifty years ago, July 1971, I wrote “The Case Against Wage and Price Control” and sent it to National Review. I was early because I could see it coming.Sure enough, on August 15, President Nixon announced a 90-day freeze on wages, prices, and rents. One year earlier, Congress had granted the President a blanket power to sabotage the price system, micromanage business and labor contracts, and replace free markets with frozen markets.
Helped by good timing, the second article I had written (the first was about Milton Friedman in Reason) was quickly accepted as a cover feature. Soon after, editor William F. Buckley Jr. invited me to lunch in San Francisco and hired me.
Barron’s publisher Robert Bleiberg later shared the following exquisite example from Pierre Rinfret of the maniacal cheerleading that greeted Nixon’s economic coup d’état:
“On August 15, 1971, Richard Nixon introduced a daring, dynamic, and delightful economic program. With one broadside blast, he attacked the international problem of the dollar, the domestic problem of inadequate capital investment, the problem of jobs in the industrial cities, the inflation, the technological problem, the problem of lagging consumer demand, and last but not least, the confidence problem. No one could ask for more. I praise the program. I support the program. I applaud the program. I have a sense of joy and elation. I am proud of a President who had the courage, stamina, and strength to move forward vigorously.”
President Nixon and his Cost of Living Council spent the next three years trying to dictate to workers what their work was worth and to businesses how their products must be priced. This bossy task soon proved as impossible as it was hubristic and tyrannical.
The whole endeavor was quixotic. American price czars could not possibly regulate prices of international traded commodities, priced in dollars, which were bound to soar with a deliberately devalued dollar. They could not possibly police millions of deals for services bought with cash. They couldn’t control prices of used goods. They couldn’t control prices of new goods either: If something is new, there is no way to tell if its price has increased.
Behind the distractive smokescreen of price controls, President Nixon abandoned the Bretton Woods pledge to redeem official foreign holdings of dollars for gold, and levied a temporary 10% tariff. The dollar was first officially devalued against gold from $35 to $38 and then $42.22 an ounce in 1972, with that gold/dollar ratio later invited to sink (“float”) ceaselessly to $183 by the end of 1973 and $675 by September 1980.
The Administration welcomed the closely related devaluation of the dollar against more stable currencies, arguing that a cheapened dollar would make U.S. goods more “competitive.” They imagined a feeble dollar would “improve” the real terms of trade (other countries would take more of our products in exchange for fewer of theirs). They did not foresee that deep devaluation would inflate dollar prices of both imports and exports.
In January 1971 a dollar would buy more than 3.6 German marks and 357 Japanese yen in January 1971, but by December 1979 a dollar was worth only 1.7 marks and 240 yen.
Since internationally traded commodities are priced in dollars, the falling dollar made stockpiling metals, grains and oil appear cheaper to foreigners who bid their prices up in dollars. That demand-side effect inflated commodity prices so long as the dollar fell, which meant many years. But it also had a big supply-side impact on the sellers of commodities, because it encouraged suppliers of storable commodities such as oil and crude oil to withhold supplies until they got more dollars per barrel (or per ounce) to compensate for the dollar’s shrinking buying power.
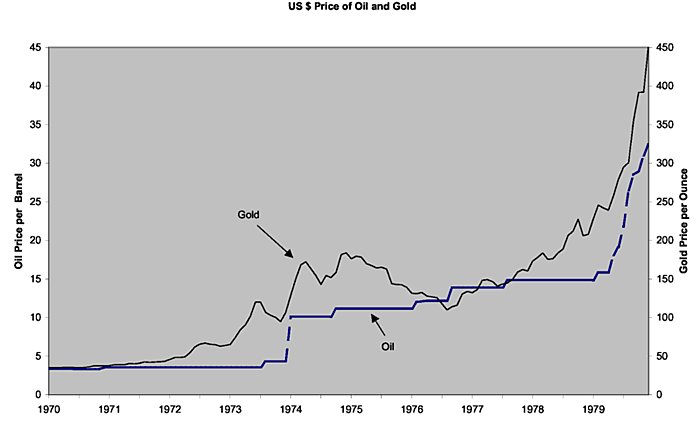
The first Graph “U.S. $ Price of Oil and Gold” is from a crucial 2003 study –”Black Gold: The End of Bretton Woods and the Oil Price Shocks of the 1970s“– by David Hammes and Douglas Wills, who persuasively argued that, “The conditions that brought about the demise of Bretton Woods also made the increases in the US dollar price of oil inevitable. Furthermore, the two dramatic US dollar price increases, in 1973 and then in 1979, only brought the ‘real’ or gold price of oil back within its historical range.”

As Boston Fed economist Michael Corbett explained, “The devaluation of the dollar that was experienced in the early 1970s was also a central factor in the price increases instituted by OPEC. Since the price of oil was quoted in dollar terms, the falling value of the dollar effectively decreased the revenues that OPEC nations were seeing from their oil. OPEC nations resorted to pricing their oil in terms of gold and not the dollar. Due to the ending of the Bretton Woods agreement, which had pegged gold to a price of $35, the price of gold rose to $455 an ounce by the end of the 1970s. This drastic change in the value of the dollar is an undeniably important factor in the oil price increases of the 1970s.”
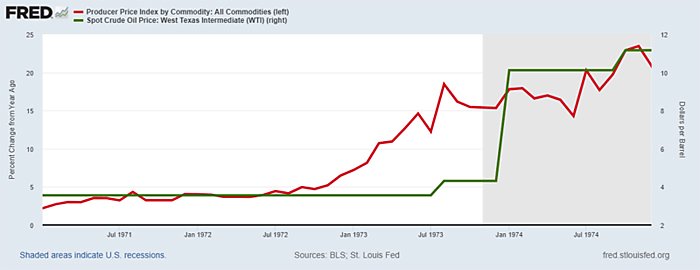
Many economic journalists and economists still try to excuse Presidents Nixon, Ford, and Carter for debasing the dollar with assistance from politicized Fed Chairmen like Arthur Burns. They try to blame a prolonged general inflation in the average of dollar prices on spurts in just one price — the price of crude oil. But the second graph clearly shows that most commodity prices (not just gold) began rising in late 1972 — long before sticky oil price contracts belatedly caught up.

How could a U.S. President surrounded by ostensibly intelligent advisers end up debauching the dollar and trying to disguise the effects with wage and price controls? Most likely that happened because terrible theories encourage and excuse terrible policies.
Determined to blame inflation on anything except fiscal or monetary policy, media pop stars like Rinfret and Galbraith fell back on primitive fallacies about most prices rising because some prices rose (cost-push), or because wages rose (wage-push), or because people simply expected most prices to rise and were somehow willing and able to keep paying more and more for everything without growing transfer payments and/or a reckless Fed giving everyone more and more money to spend.
Even Fed Chairman Arthur Burns testified in June 1971 that because “a substantial increase of unemployment has failed to check the rapidity of wage advances… I have therefore come to believe that our Nation must supplement monetary and fiscal policy with specific policies to moderate wage and price increases.” If you don’t like the message the price system is sending, shoot the messenger.
Herb Stein once confessed that before he came chairman of the Nixon’s CEA in 1972, he and other Nixon advisers simply bowed to Fed and media pressure to “do something,” even something stupid. The Council of Economic Advisers, he wrote, “found itself involved in helping devise measures that would meet the rising demand to do something — which meant incomes policy.” But by 1972, he lamented, “we were living in a new world of price and wage controls and a devalued dollar.”
That poisonous policy stew was doomed to fail horribly. Artificially low prices boost demand and discourage supply, resulting in apparent shortages of everything but money. As Schuettinger and Butler documented, wage and price controls have been repeatedly inflicted for 4,000 years and always ended in disaster.
President Nixon unleashed an inflationary hurricane in 1971 by letting the dollar collapse in terms of gold and relatively sound currencies. Inflation remained frighteningly high from 1973 to 1982, with unemployment often much higher than before the price control fiasco. The Fed put the Fed funds rate up from 9% in June 1980 to 19% in January 1981 when President Reagan took office. A 30-year mortgage rate topped 18.6% that October. It took until 1983 (when Reagan tax rate relief really started) to start getting things back to normal.
Many costly tax and other economic policy mistakes were made in the seventies, but the worst problems of the 1973–82 stagflationary era by far were the legacy of terrible monetary and regulatory blunders made in 1971.
