President Joe Biden often complains about “shrinkflation.” Before the Super Bowl, he aired an ad arguing that some companies were sneakily raising prices by reducing the quantity or weight of products in a package. “Ice cream cartons have actually shrunk in size, but not in price,” he moaned, before citing several other examples.
Biden’s intervention has been part of a deliberate White House strategy to shift blame for inflation onto corporations. Instead of acknowledging inflation as a result of broader macroeconomic forces (which would implicate excessive fiscal and monetary stimulus), progressive Democrats want voters to think that the recent inflation was driven by greedy businesses.
Shrinkflation is held up as one example of how powerful companies gouge consumers and drive up unit prices. “Shrinkflation is late-stage ‘greedflation’—when you’ve maxed out on price hikes and consumers can’t handle more,” says Lindsay Owens, executive director of the Groundwork Collaborative, a progressive group. “It’s much more deceptive than simply raising prices.”
We’ve previously explained that any recent shrinkflation—where firms reduce product size or quantity while keeping package prices the same—is just one response to broader inflationary pressures. It’s a business decision to downsize products in a world where the growth of total spending in the economy is faster than the growth of total production, so increasing unit prices.
More recently, however, the Bureau of Labor Statistics has released data that lets us examine how widespread shrinkflation really is and which products it affects within the Consumer Price Index. This data shows that shrinkflation hasn’t significantly contributed to recent inflation, let alone driven it, and that it was a normal business practice used even prior to the pandemic.
Downsizing Is No More Prevalent Today Than Pre-Pandemic
Figure 1 shows the frequency of product items within the Consumer Price Index being resized each month. It reveals that the number of product items shrinking hasn’t increased recently compared to the past. In fact, the frequency of downsizing in 2022 and 2023 is similar to 2018 and 2019 levels, and much lower than in 2015 and 2016. What’s actually declined since 2020 is the number of products being upsized—where the quantity or weight increases for the same price of a package.
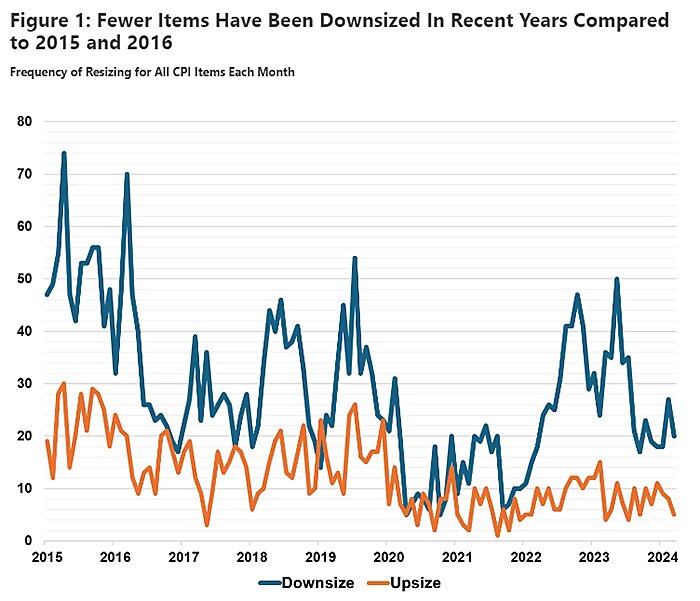
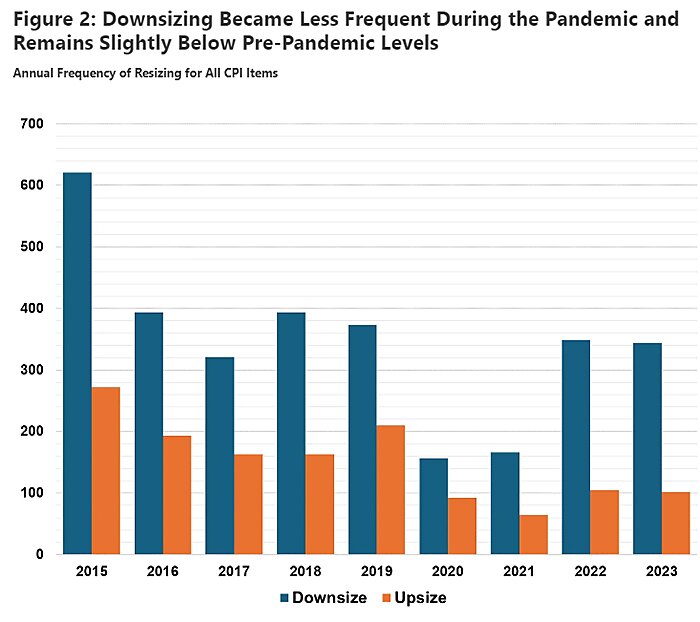
Figure 1 makes clear that the anomaly, then, isn’t any recent “shrinkflation,” but the early pandemic years when the frequency of product downsizing dropped dramatically. Figure 2 shows this clearly: the number of items downsized in any month plummeted in 2020 and 2021. Since then, the frequency has bounced back to pre-pandemic levels.
One reason for the recent panic about shrinkflation could well be, then, that, during COVID-19, consumers bought more food at home and saw downsizing less frequently for a couple of years. As the economy reopened and inflation surged, the frequency of downsizing jumped to pre-pandemic levels. This made shrinkflation more noticeable, even though it was no more common than before 2020.
Shrinkflation Doesn’t Account for Much of Recent Inflation or Even Specific Price Rises
Simply counting instances of downsizing by item within the CPI doesn’t tell us much about the magnitude of shrinkflation and how much it has contributed to overall price rises in recent years, of course. Fortunately, the Bureau of Labor Statistics (BLS) provides other data to assess this.
The existing Consumer Price Index (CPI) already tries to account for resizing by tracking unit price changes. As the BLS explains:
…if a half-gallon (64 oz) of Brand A vanilla ice cream is priced in January 2021 at $5.99, then the effective price per ounce is $5.99 divided by 64 oz or $0.093 per ounce. If, in February 2021, the same Brand A vanilla ice cream is reduced in size to 60 oz, but the price is still $5.99, the effective price per ounce would be $0.0998 per ounce. This results in a 6.7‑percent increase in the price per ounce of the ice cream, and the CPI would include this price increase. Our economists even adjust for items that do not have a weight, like toilet paper. For example, when the number of sheets per toilet paper roll changes from 220 per roll to 200, the economist will adjust the data to show a 10-percent price-per-sheet increase.
In addition, the BLS has recently produced “research indexes” that show price changes for items excluding these resizing effects. Although they note these new indexes are more likely to contain errors than normal CPI data, comparing them with the overall CPI indexes by item allows us to calculate an estimate of shrinkflation by item over time.
Previous analysis by the BLS showed that shrinkflation has a tiny aggregate effect on the overall CPI and so inflation, which is unsurprising given most items don’t get resized. The new data stemming from the research indexes confirms that even for product subcategories where shrinkflation is more common, downsizing plays a relatively minor role in explaining total unit price changes.
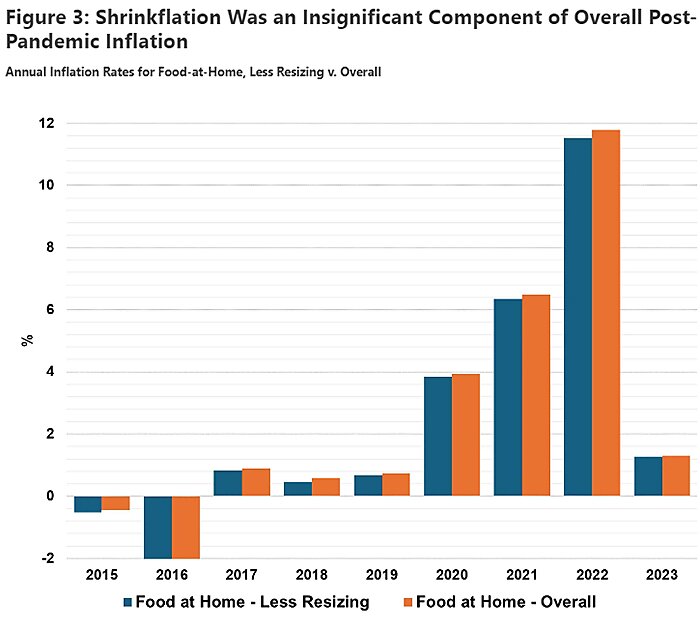
Let’s look at the “food at home” sub-index and its annual price level changes (Figure 3). BLS data shows that excluding product resizing impacts on unit prices barely changes the annual inflation rate for this category. Even in 2022, when food at home inflation hit 11.8 percent, the equivalent inflation rate excluding the effect of resizing was 11.5 percent. So, net downsizing (shrinkflation) raised food at home inflation by 0.3 extra percentage points in 2022, the year of the worst inflation. That means it accounted for just 2.3 percent of overall food at home price increases in that year.
Why, then, have we seen so much panic about shrinkflation? How is it that something that requires a magnifying glass to observe on a chart is driving so much of the political debate about price hikes?
It’s true that some individual products have seen more shrinkflation between December 2019 and March 2024. Table 1 lists the ten CPI items for which downsizing has raised their price level the most — i.e. which saw the most shrinkflation.
It includes many of those products Biden’s ad complained about. For example, downsizing has raised snack price inflation over that period by 2.5 percentage points, contributing to their overall 26.2 percent price increase through that period. In other words, even for snacks — the product for which shrinkflation was largest — less than a tenth of the price increase since December 2019 is accounted for by product downsizing.
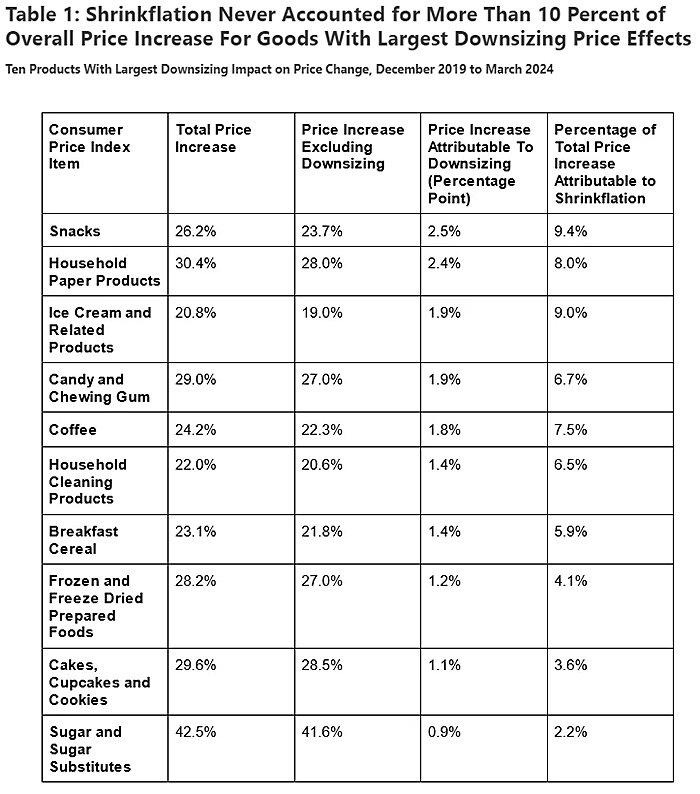
As Table 1 shows, this very modest impact holds for other items where shrinkflation effects have been largest. For example, shrinkflation accounts for just 9 percent of the total price increase in ice cream since December 2019, 7.5 percent for coffee, and 6.7 percent for candy and chewing gum. Clearly, shrinkflation hasn’t played a particularly significant role in driving item price changes, let alone inflation.
Shrinkflation Is A Normal Business Practice and a Reaction To An Inflationary Environment
When interpreting this data, it’s important to remember that shrinkflation is just a form of price increase influenced by prevailing economic conditions. In an inflationary environment with excess demand, some businesses will prefer reducing product sizes over raising prices directly due to perceived price sensitivity among their customers.
That’s what makes the political reaction to shrinkflation so foolish. Senator Bob Casey wants to ban shrinkflation, viewing it as a sneaky tactic by companies with the market power to charge more. He talks as if a prohibition on shrinkflation would simply counteract this anticompetitive conduct, lowering unit product prices for customers.
In practice, it would be nearly impossible to ban shrinkflation. Companies could always just launch wholly new product lines of different sizes with slightly different branding, discontinuing existing size-price bundles at a later date.
Even for businesses who couldn’t adjust like this, the most probable result would be that they opt for higher equivalent upfront prices for their packages if banned from downsizing. After all, an inflationary environment still sees rising costs for these firms. A decision to just put up basic package prices, though, would harm price-sensitive customers–who may have lower incomes.
It shouldn’t surprise us then to see shrinkflation concentrated among the goods it has appeared to affect. When you’re buying ice cream, snacks, or even paper towels, you tend to think of purchasing a “packet” or a number of rolls. It’s not like when you’re buying meat, when prices are set per lb and you’re looking to purchase a given weight. There’s good reason to think that customers would be less sensitive to price increases if fewer chips were added to a bag or the ice cream tub was reduced in size from 1.5 quarts to 1.44 quarts (as this Turkey Hill vanilla ice cream was) than if the package price for these products shot up.
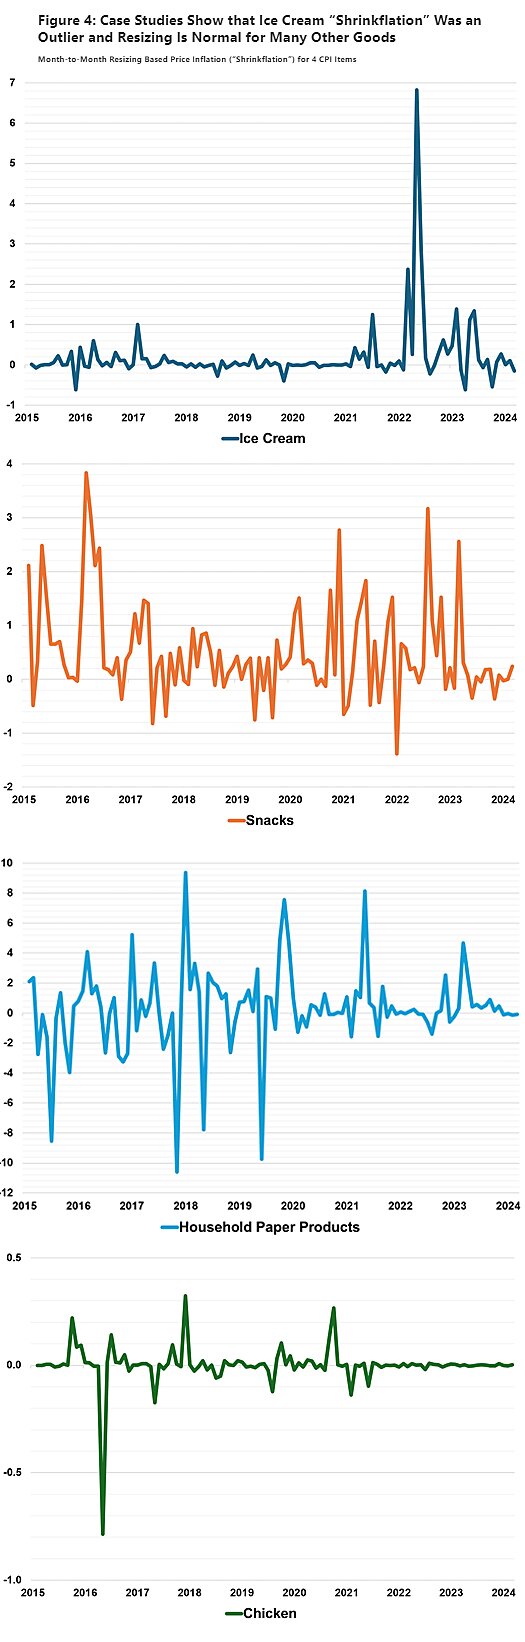
We can see this business logic when looking at shrinkflation data for individual items over time. Figure 4 shows “shrinkflation” case studies for 4 different CPI products, calculated as the difference in month-to-month overall CPI inflation and CPI inflation less resizing.
This analysis shows why the administration fixates on ice cream–it is an outlier. Ice cream products exhibited sudden and large shrinkflation, but this effect was highly concentrated to just one month (May 2022) when inflation was extremely high. Aside from the spring of 2022, shrinkflation has been relatively uncommon even for ice cream.
Snacks also exhibited shrinkflation post-pandemic, but such downsizing effects were stronger in 2016 when there was no severe inflationary pressure. Indeed, snack shrinkflation has been a normal business practice for some time.
Resizing related price effects for household paper products are common but have fallen in magnitude since the pandemic. It is thus hard to argue that such companies used the pandemic for nefarious price gouging. (In fact, even prior to the pandemic these products exhibited frequent and large upsizing!)
To confirm that such resizing effects were specific to products that consumers buy in “packages,” we also examine shrinkflation for chicken, an item usually priced by weight. As the chart shows, there are virtually no resizing effects. These case studies confirm that there is no inherent corporate deceit at play with resizing; rather, such companies simply rely on consumers’ lower quantity sensitivity to resize products purchased as packages.
These are not cherry-picked examples. The point is: there’s little evidence downsizing adjustments reflect price “gouging” or flexing greater market power, as opposed to industry-specific decisions.
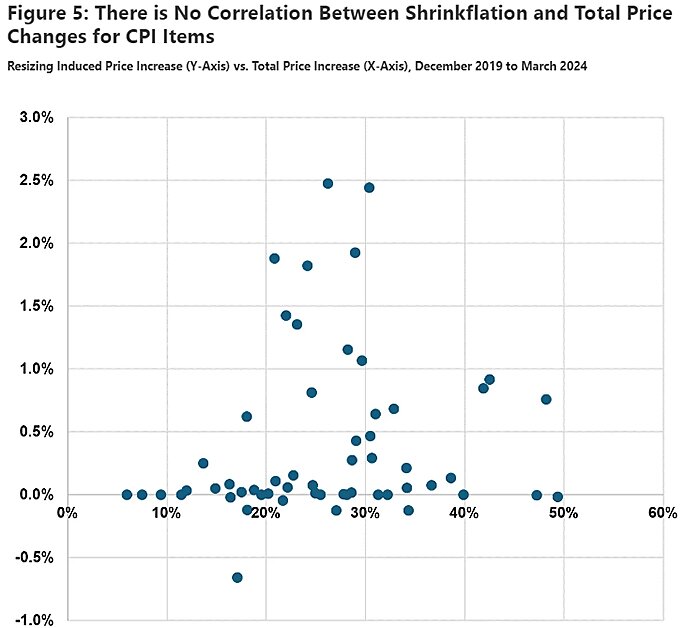
Indeed, if companies engaging in shrinkflation had heightened market power, we might expect that being able to “shrinkflate” would lead to larger overall unit price increases overall. That is, there should be some evidence that products where downsizing price effects were large were also the ones that saw the largest increases in unit prices. However, as Figure 5 below shows, there is no correlation between an item’s total unit price increase and any shrinkflation. This further suggests that resizing was a result of product characteristics and not corporate gouging.
Conclusion
Resizing a product, rather than changing its packet price, is a normal business practice that occurred more frequently in many years before the pandemic. There’s no evidence that downsizing (shrinkflation) has been more prevalent since 2020 to explain the high inflation we’ve seen, nor much evidence that the shrinkflation we saw accounted for much of the high inflation.
At most, some common food and household products have seen product downsizing account for less than 10 percent of their total price rises. These overall price rises have been large because of the broader inflationary conditions. In that environment, it’s unsurprising that some firms with price-sensitive customers would prefer to adjust package sizes instead. Yet banning this response, as some progressive politicians have advocated, would not have altered the macroeconomic or microeconomic realities and so would not have delivered lower product unit prices for consumers.
About the Authors

