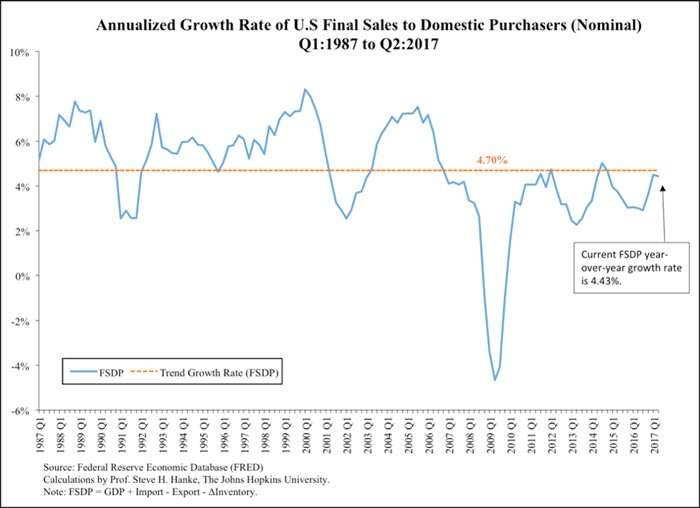
Although it's picked up recently, economic growth remains relatively sluggish throughout the world. The U.S. provides an important example. It has been nearly nine years since Lehman Brothers collapsed and the Great Recession commenced. But the U.S. has failed to bounce back. The economy is still struggling to escape from a growth recession — the economy is growing, but growing below its trend rate. The U.S. aggregate demand, which is best represented by final sales to domestic purchasers (FSDP), is now still below its trend rate of 4.7%, with growth in nominal terms at a rate of 4.43% (see the chart below).
Annualized Growth Rate of U.S. Final Sales to Domestic Purchasers (Nominal) Q1:1987 to Q2:2017
Many argue that fiscal “austerity” is the culprit that has kept growth tamped down. They advocate fiscal stimulus (read: spending on public works).
Another line of argument used to support massive increases in spending on public works goes beyond the standard Keynesian counter-cyclical argument. It is the secular-stagnation argument. Its leading advocate is Harvard economist Larry Summers, formerly U.S. Treasury secretary and president of Harvard. He argues that private enterprise is failing to invest and that, with weak private investment, the government must step up to the plate and spend on public works.
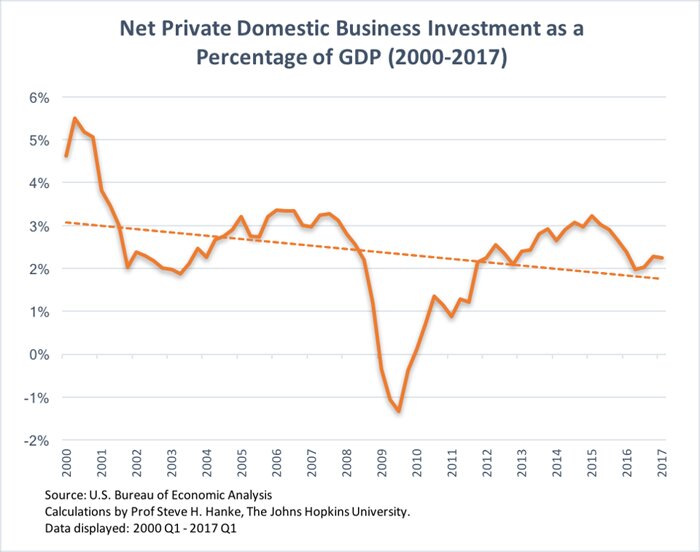
For evidence to support Summers’ secular-stagnation argument, he points to anemic private domestic capital expenditures in the U.S. As the accompanying chart shows, net private domestic business investment (gross investment — capital consumption) is relatively weak and has been on a downward course for decades.
Net Private Domestic Business investment as a Percentage of GDP (2000-2017)
Investment is what fuels productivity. So, with little fuel, we should expect weak productivity numbers in the U.S. Sure enough, the rate of growth in productivity is weak and has been trending downward. The U.S. is in the grips of the longest slide in productivity growth since the late 1970s. The secular stagnationists assert that the “deficiency” in net private investment and the resulting productivity slump can be made up by public works spending.
Both the counter-cyclical and the secular-stagnation arguments have been trotted out many times in the past. So, it’s old wine in new bottles. But, it seems to be selling as a means to escape fiscal austerity. If proposed public works projects proceed as projected, the government financing magnitudes would be stunning. The McKinsey Global Institute estimates that annual spending of $3.7 trillion per year from 2013 through 2030 would be “required” worldwide.
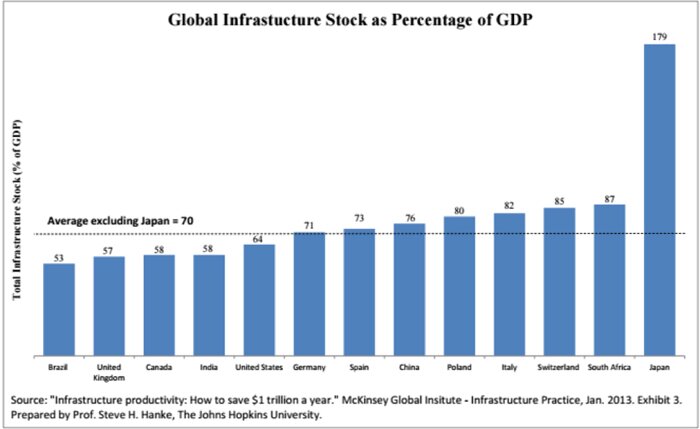
McKinsey’s “requirements” estimate was computed by using the 70% rule of thumb. As shown in the accompanying chart, the average value of the stock of infrastructure for representative countries is 70% of GDP. Based on this value, McKinsey then calculated the amount of spending required to keep the global infrastructure stock to GDP ratio fixed at 70% over the 2013-2030 period. That exercise yielded a whopping total of $67 trillion in public works spending, which is in the ballpark of most other estimates.
Global Infrastructure Stock as Percentage of GDP
President Trump has jumped on this infrastructure bandwagon. He is proposing a $1 trillion public works program. Following the script of the public works advocates (read: big spenders), Trump has lifted a page from President Obama’s Council of Economic Advisers (CEA). The CEA’s 2016 Annual Report contains a long chapter titled “The Economic Benefits of Investing in U.S. Infrastructure.” That title alone tells us a great deal. Infrastructure spending advocates focus on the alleged benefits, which are often wildly inflated, while ignoring, downplaying, or distorting, the cost estimates.
This was clearly on display in an op-ed, “These are the Policies to Restore Growth to America,” which appeared in the Financial Times (12-13 November 2016). It was penned by none other than Anthony Scaramucci, the short-lived adviser of President Trump. In it, "The Mooch" asserted that infrastructure spending “has an estimated economic multiplier effect of 1.6 times, meaning Mr Trump’s plan would have a net reductive effect on long-term deficits.” This multiplier analysis is exactly the same one used by President Obama’s CEA to justify public works spending. The idea that a dollar of government spending creates more than a dollar’s worth of output is nothing new. Indeed, the multiplier originated in an article that appeared in a 1931 issue of the Economic Journal. The article was written by R. F. Kahn, who was one of John Maynard Keynes’ favorite students and closest collaborators. Since Kahn’s 1931 article, the multiplier has become an inherent part of Keynesian theory. The numerical values of the multiplier are not only sensitive to the assumptions employed, but also subject to misuse in the artificial inflation of benefits.
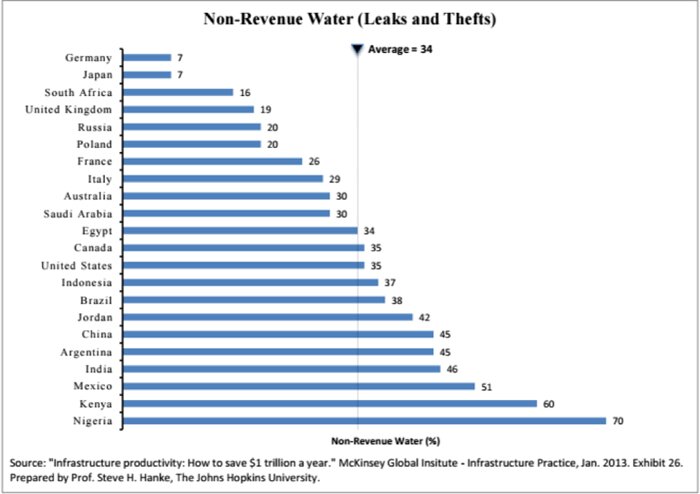
Once public works are installed, the hot air comes out of their alleged benefits. These projects are poorly maintained, and users are often not charged for what they use, or they are charged prices set well below the relevant costs incurred. Water is a classic case. For example, the accompanying chart shows that, on average, 34% of the water delivered to water systems is either stolen or leaks out of the distribution systems. In Nigeria, 70% is leaked or stolen. So, it’s hard to take seriously the claims that billions of dollars are required to develop more water-resource capacity when much of the water produced in existing systems leaks away. Adjusted for leaks and thefts, the alleged benefits for many new projects, which have been inflated by multipliers, wither away to almost nothing.
Non-Revenue Water (Leaks and Thefts)
When we turn to the cost side of the ledger, something infrastructure advocates prefer to keep from the public’s view, we find that infrastructure projects are always subject to cost overruns. While the projects might look "good" on paper, reality is a different story. Detailed studies show that the average ratios of actual costs to estimated costs for public works projects in the U.S. typically range from 1.25 to over 2.0.
In addition to cost overruns, the financing of infrastructure requires the imposition of taxes, and taxes impose costs beyond the amount of revenue raised. The excess burdens of taxation include “deadweight” distortions and enforcement and compliance costs. In short, it costs more than a dollar to finance a dollar in government spending. The best estimates indicate that, on average, it costs between $1.50 to $1.60 to raise a dollar in tax revenue.
Taking proper account of cost overruns and the costs of collecting taxes, one wonders if there are any public works projects that could justify federal financing, let alone financing to the tune of $1 trillion. Welcome to the wonderful world of infrastructure waste, fraud and abuse.


