This article investigates the dynamics of individual economic well-being in Estonia and Finland over three periods: (1) 1923–1938, when both countries were similarly situated; (2) 1960–1988, during which Estonia was under Soviet control; and (3) 1992–2018, after Estonian independence. Economic well-being is calculated using the purchasing power of wages in terms of the affordability of a minimal food basket.
The results show that, in 1938, the purchasing power of wages in Estonia was 4 percent lower than in Finland; in 1988, it was 42 percent lower; and, by 2018, the gap had fallen to 17 percent. Consequently, as measured by the purchasing power of wages, well-being in Estonia and Finland was similar before the Soviet occupation, widely diverged during Soviet rule, and converged after Estonian independence, with the transition from plan to market.
Background
There has been a long-standing debate on the economic impacts of central planning versus free markets. Traditionally, the most illustrative examples are countries that differ only in their economic and political institutions—such as East and West Germany, or North and South Korea. Such examples offer an opportunity to examine the effects of two different systems in similar environments. While some pairs are more popular for analysis, some are less obvious, especially if their characteristics became too dissimilar after the introduction of different policies. One of these less obvious examples is Estonia and Finland.
Estonia is often compared to other post-Soviet states, while Finland is normally examined within the Nordic countries. However, historically, they share more similarities than it first seems. In addition to geographical proximity and cultural affinities, such as religious (Lutheranism) and linguistic (Uralic languages), Estonia and Finland had very similar political and economic developments before the Soviet Union occupied Estonia (see Nordic Estonia).
The two neighboring countries had a similar legacy after the Scandinavian rule and the rule of the Russian Empire. They both underwent wars of liberation and gained independence in the early 20th century. As two new sovereign countries, both became parliamentary democracies under the rule of law and remained market economies.
Similar agrarian reform in Estonia and Finland led to the formation of a family farming system that played a big role in the economies of both countries (Lapping 1993; Jörgensen 2006). In 1920 and 1921, Finland and Estonia, respectively, became members of the League of Nations and developed strong economic and political connections with the international community. Estonia and Finland were relatively late with industrialization. Indeed, until the 1930s, both were predominantly agrarian economies. In the early 1930s, both nations suffered from the Great Depression but had their economies expand anew in the late 1930s, with a growing industrial sector. Under the Russian Empire, Estonia and Finland had strong connections with the Russian market, but the Soviet regime disturbed those linkages by 1924. Both countries then reoriented toward the West and began actively trading with European nations.
There is a common opinion that Estonia never became a Nordic country because it was occupied by the USSR when the Nordic Council was formed. In fact, the Nordic identity in modern Estonia is still very strong. Toomas Hendrik Ilves, Estonian foreign minister, who later served as a president of Estonia, delivered an influential speech, “Estonia as a Nordic Country,” in 1999 (Ilves 1999). In 2015, the Estonian prime minister Taavi Rõivas defined Estonia as a “New Nordic Country.” In the same year, the Swedish ambassador to Estonia, Anders Ljunggren, stated that Estonia would have been considered a Nordic country by the other Nordic countries (Aavik 2015).
As advocates for the Nordic affiliation of Estonia often pointed out, more than a thousand years of Estonian and Finnish shared history was eclipsed by about 50 years of the Soviet occupation. The similarities between the two countries became disturbed during that time, when Estonia experienced a totalitarian regime and centrally planned economy.
The Soviet rule in Estonia began in 1940, was interrupted in 1941 during the German occupation of Estonia, reestablished in 1944, and lasted until 1991. Already in 1940–1941, the Soviet Union nationalized all land in Estonia, banks, and large industrial enterprises. When the USSR regained control over Estonia in 1944, it quickly and fully integrated the country into the Soviet centrally planned structure. The Estonian economic landscape changed dramatically. Its trade connections with non-Soviet markets were cut; private ownership of the means of production was liquidated; and the economy was refocused toward the extraction of natural resources, much of which was sent to other Soviet republics. Political institutions experienced a major change as well: the democratic regime was replaced by a one-party system with almost unlimited political power.
In the Soviet Union, analysis of the Estonian transition to a planned economy had a highly ideological character and was described as a big success. However, it was widely criticized later and is still a very debatable matter. Whether the Soviet period helped or hindered Estonia in achieving its economic policy aims, it is clear that Estonian development experienced a radical twist under Soviet central planning, compared to what it was before and relative to its neighbor Finland. Such a change cannot but affect normal people’s lives.
Meanwhile, Finland defended its independence and remained a market economy with private property rights, the rule of law, limited power of the executive, and relatively free trade. In 1973, Finland signed a free-trade agreement with the European Community. In the late 1980s, like other Nordic countries, Finland eased economic regulations, privatized some state-owned enterprises, and altered tax policy. In 1995, the country joined the European Union and adopted the euro. We can never know if Estonia would have done the same if it had remained independent from the Soviet Union but similar to Finnish developments, which were popular among other European countries as well.
When Estonia gained independence from the Soviet Union during 1988–1991, its institutional structure began to converge with Finland’s. Estonia became a parliamentary democracy, the size of the Estonian government was reduced dramatically, subsidies and state-owned enterprises were abolished, the economy reopened for international trade and foreign direct investment, and macroeconomic stability was achieved via a strict monetary policy and balanced budgets. Estonia left almost no sign of the Soviet system and joined the European Union in 2004.
This article examines how the economic well-being of the Estonian people was affected by the institutional change during and after the Soviet regime compared to Finland. The main contribution is the use of hard-to-find statistical data to construct relative measures of well-being using an indicator for the purchasing power of wages. As such, this article should contribute to the long-lasting debate over the efficacy of markets versus planning by providing new data for a case of two similar countries with different experiences.
Assuming that changes in government policies affect individual economic well-being, the economic situation in Estonia and Finland is expected (1) to be similar when the countries had similar economic and political institutions; (2) to differ widely during the Soviet occupation of Estonia; and (3) to start converging after the Estonian independence.
Research Design
Such measures of national well-being as gross domestic product (GDP) per capita do not cover the entire period of interest, but Estonian and Finnish historical statistics contain enough information to construct an indicator to grasp it. Data on retail prices and average wages provide information about purchasing power, since they can help in determining the quantity of goods and services that can be bought with a wage unit. The purchasing power of wages (PPW) is calculated at a specific point in time for a specific place to capture people’s economic well-being. This procedure is used to determine how individual economic well-being in Estonia and Finland has been changing over time.
PPW is measured using retail prices of basic foodstuffs over the entire period of interest in both countries. The higher the PPW, the more things of an average price can be purchased, and the freer people are financially. While the conceptual definition of PPW includes goods and services, the operational definition used in this study means the quantity of foodstuffs that can be bought with a wage unit.
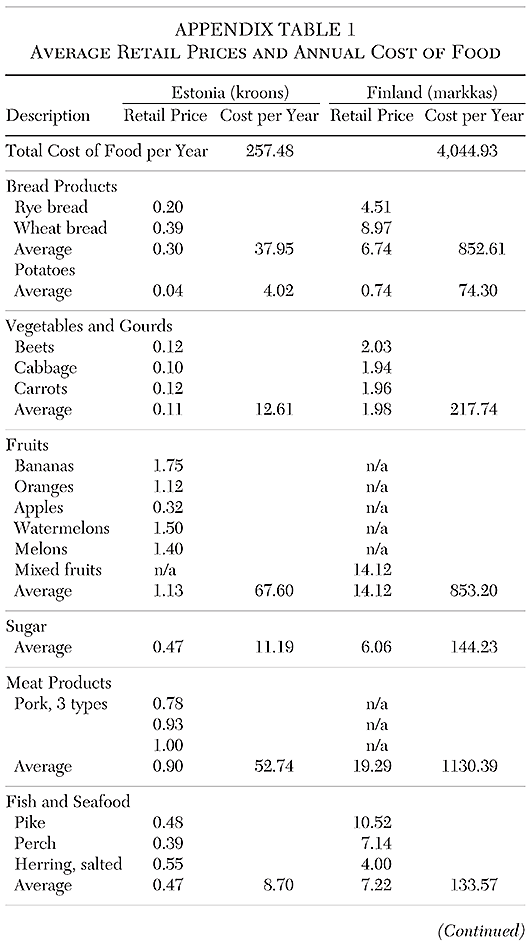
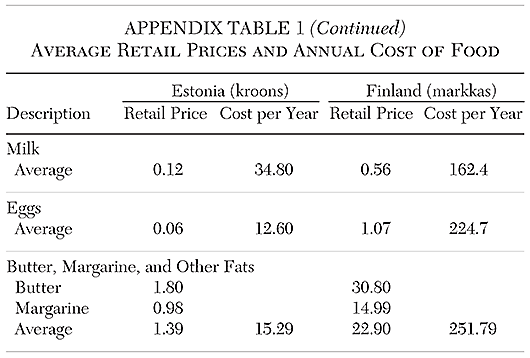
PPW was found according to the minimal consumer basket of food normally used for minimum wage legislation. The minimal food basket (Table 1) respects the minimum amount of calories required in order to function normally—a standard of 2,100 to 2,300 calories, according to the Food and Agriculture Organization and World Health Organization (MONSTAT 2018).
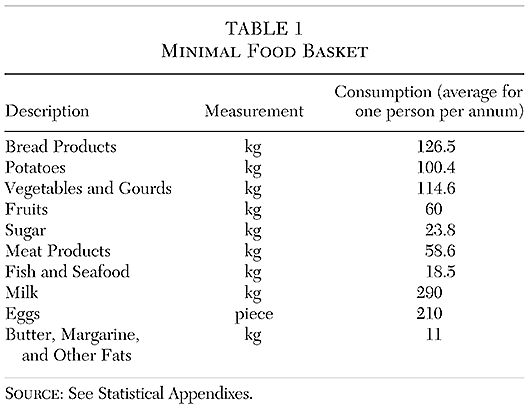
Since the exact minimal baskets for Finland and Estonia were not available, and the methodology does not change much internationally, the model used is taken from the Russian Federation Labour Code (2012). Although there are probably some differences in consumption habits among the countries, the format of the minimal basket is suitable to make conclusions due to similar climates, agriculture trends, and a comparably similar gastro-cultural background.
The PPW indicator will show how many minimal baskets an average wage in each country could buy in different points in time. The cost of the basket is calculated from the average retail prices and minimal required consumption per year. Based on the cost of the basket, PPW was counted using annual average wages to establish how many baskets per year can be bought for an average wage in each nation.
PPW is calculated for three base years: 1938, when both countries had similar institutions; 1988, after almost 50 years of the Soviet occupation in Estonia; and 2018, after the Estonian transition to a democracy and market economy. The Estonian data were primarily drawn from the statistics provided by the National Bureau of Statistics before 1940, the Central Board of Statistics of the Estonian SSR until 1989, and Statistics Estonia for current data. The Finnish data mostly come from statistical yearbooks published by Statistics Finland (Finnish: Tilastokeskus; named the Central Statistical Agency before 1971). Also, European Historical Statistics, 1750–1970 by B. R. Mitchell (1975) was used for this article. Finally, some data for the 2018 base year were extracted from the OECD statistics.
Limitations
Despite a long history of recordkeeping in both countries, the earlier statistics do not always provide all the necessary information, so this article also uses information from unofficial sources, such as newspapers from the late 1930s. Because of the dearth of data in the earlier periods, an accurate comparison of wages was possible by using the average wages of male workers in industrial enterprises (Hagfors and Kuus 1993).
Although Estonia and Finland differ in some policies, this study is primarily interested in examining how the transition from plan to market in Estonia affected economic well-being relative to Finland. What matters for this study is the existence or absence of the rule of law, trade openness, competitive political participation, private ownership—and whether prices are determined by supply and demand or fixed by government.
Results
We can now move to examine the three periods of interest: the interwar period, the postwar period, and the post–Cold War period.
Interwar Period
After the Russian Revolution in 1917, Estonia and Finland gained their independence from the Russian Empire, which was an industrial capitalist economy. At that time, the Baltic cousins were similarly situated:
- For both nations, their trade relationship with Russia collapsed and they reoriented the markets toward Europe;
- Both recognized private property and adhered to the rule of law;
- Both were parliamentary democracies;
- Both economies largely focused on agriculture.
This article calculates PPW in 1938 in both countries. According to the calculations, the purchasing power of an Estonian worker’s wage in 1938 was 96 percent of the average Finnish worker, or almost same (Table 2).
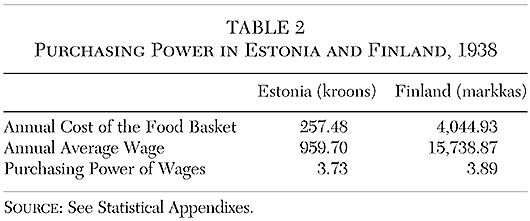
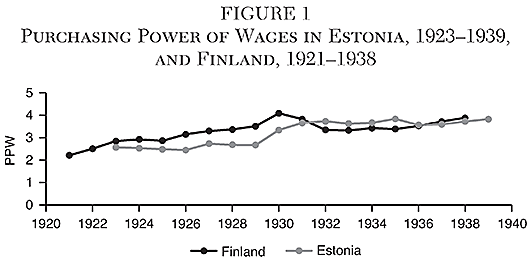
Figure 1 shows the course of PPW over time using food price and wage indexes from historical statistics. Estonian performance was typically close behind the Finnish experience and even overtook it in 1932–1936 by an average of 8 percent. Thus, overall development in both countries went hand in hand.
Postwar Period
Since Finland had defended its independence, the country’s economic progress continued in a similar matter. For example, Finland
- Remained a democracy with limited power of the executive;
- Continued to be a market economy;
- Recognized and guaranteed private property;
- Remained oriented to international trade and signed a free-trade agreement with the European Community in 1973.
In contrast, after almost 50 years in the Soviet bloc, the Estonian economy had experienced a series of changes, such as:
- Lack of competitive political participation;
- Controlled economy with a focus on natural resource extraction;
- Liquidation of private ownership of the means of production;
- Price fixing;
- An abrupt end of international trade.
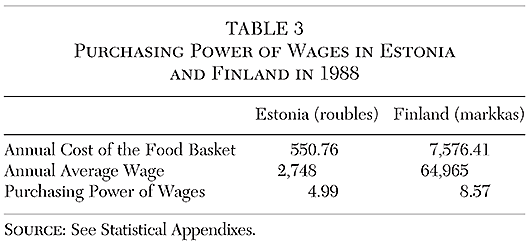
After these changes, the geographical proximity did not match the economic distance between Estonia and Finland. PPW in the two countries diverged substantially compared to where it had been before the Soviet occupation of Estonia. In 1988, the Estonian PPW, with regard to foodstuffs, was 58 percent of the Finnish counterpart, falling by 38 percent since 1938 (Table 3).
Using food price and wage indexes to measure differences in PPW in Estonia and Finland in the postwar period, Figure 2 shows that the situation in Estonia was significantly worse than in Finland.
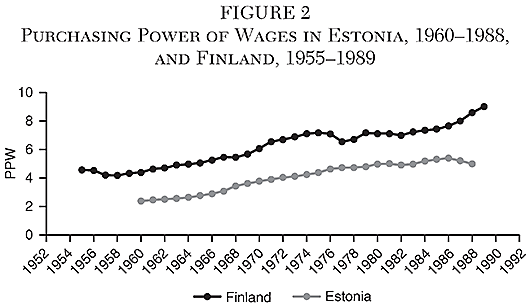
Since purchasing power is measured with regard to food, it is important to remember that prices in Finland reflected market prices, based on supply and demand, while prices in Soviet Estonia were fixed by the central government and kept artificially low. Therefore, Estonians’ food affordability during Soviet occupation is distorted by false prices and PPW appears more promising than the overall financial situation during that period (Hagfors and Kuus 1993). The food scarcity, which had been increasing at the turn of the century, should also be taken into account (Ellman 2000).
Post–Cold War Period
After the fall of the Soviet Union, Finland still had the same characteristics as described above, and Estonia
- Became a democracy again and limited the power of the government;
- Transitioned to a market economy;
- Opened for trade and foreign direct investment;
- Joined the EU single market in 2004.
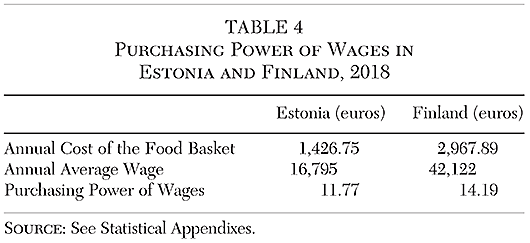
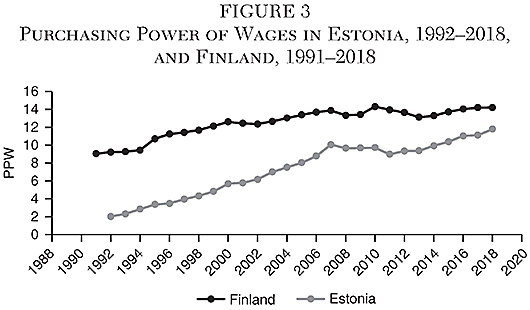
When Estonia underwent the reforms, its economic performance skyrocketed. Starting with two minimal baskets per year in 1992, after the fall of the USSR, Estonia’s purchasing power reached almost 12 baskets by 2018 (Table 4). It was 22 percent of the Finnish figure in 1992 and increased to 83 percent of the Finnish performance in 2018 (Figure 3).
Arguably, the Estonian economy experienced a J curve after gaining independence (Bremmer 2006, Laar 2008). Since Estonia inherited a collapsing economic “dinosaur,” the country needed to carry out often unpopular but necessary policies to get rid of it. Estonia had a fresh start: it instituted a comprehensive monetary reform by adopting a currency board, cutting spending, eliminating subsidies, abolishing state-owned enterprises, renewing international trade, and opening the market to foreign investment. This was bitter medicine, but the reforms helped Estonia achieve robust economic growth. Indeed, the wide gap between Estonian and Finnish PPW has been shrinking rapidly, unlike during Soviet occupation.
Conclusion
The aim of this article was to examine how the Estonian people’s economic well-being was affected under central planning versus a market economy—compared to Finland, which maintained its market-oriented and democratic system over the entire period of consideration. Figure 4 shows that PPW in Estonia and Finland (1) developed similarly when both countries shared a similar institutional structure; (2) had a considerable gap during the Soviet occupation of Estonia, when the country experienced central planning and a one-party state; and (3) started to converge to the Finnish PPW when Estonia began to undertake structural changes similar to those of Finland.
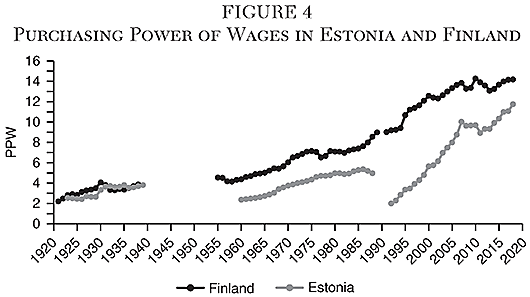
When Estonia was a part of the Soviet Union, it lagged behind Finland for nearly 30 years. It is not surprising that, given the state of the Soviet economy before the collapse, economic well-being in Estonia suffered and diverged from the level found in Finland. The decrease in Estonia’s PPW during the Soviet occupation meant that, once the transition from plan to market began, economic performance would see a sharp increase and converge toward Finland’s PPW. Indeed, after the transition to a market economy, Estonian PPW went through a J curve and started to rapidly rise. Although Estonia’s economic performance still falls short of Finland’s, the upward trend is promising. In 1992, Estonia’s PPW was only 22 percent of Finland’s, but by 2018, it was 83 percent.
From the results of this study, it is evident that institutions supporting freer markets and greater political freedom have benefited the well-being of the Estonian people.
Statistical Appendixes
Appendix A discusses the sources of retail prices for foodstuffs and calculation of the cost of the food basket. Appendix B covers the wage data. Appendix C provides a table showing PPW in Estonia and Finland from 1932 to 2018.
Appendix A: Cost of Food
The average retail prices in Estonia and Finland (Appendix Table 1) are extracted from official statistical sources, except for the price of fruit in 1938 and margarine in 2018 in Estonia. While the prices for eggs and potatoes are fairly straightforward, several products, such as vegetables and gourds, include different products’ prices and are presented as an average. The prices are presented in local currencies for each given year and in the same units as in the minimal basket. The annual cost was calculated based on consumption per annum.
Interwar Period
Base Year, 1938. Average retail prices in Finland were taken from the Statistical Yearbook of Finland (Central Statistical Agency 1938). Average retail prices in Estonia were extracted from the Monthly Estonian Statistics (National Bureau of Statistics 1938). The price of fruit was taken from several newspapers from the late 1930s (Daily newspaper 1938; New Estonia newspaper 1938).a
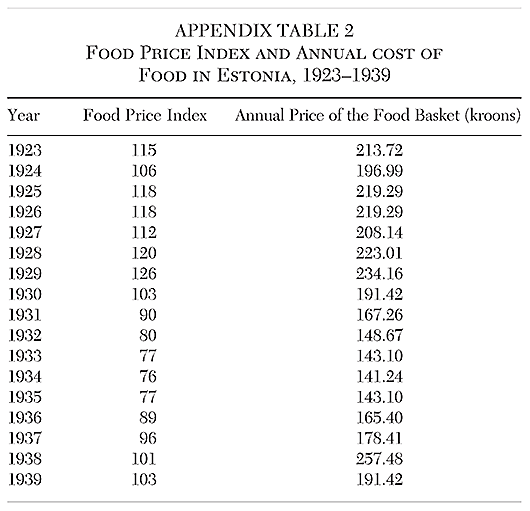
Estonia, 1923–1939. The index of food prices (Appendix Table 2) was gathered from different issues of the Monthly Statistics (National Bureau of Statistics 1937, 1938, 1939, 1940) and was applied for the cost of the 1938 basket to find the annual cost of food in the years between 1923 and 1939.
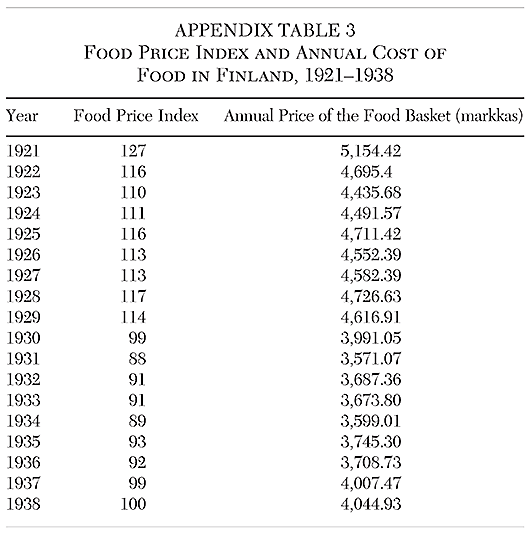
Finland, 1921–1938. In the Finnish Statistical Yearbook for 1939, there are two food price indexes: one for 1921 to 1936, with 1914 as the base year, and another from 1935 to 1938, with 1935 as the base year (Central Statistical Agency 1939: 345). The second index includes 1939, the year that has the cost of the food basket, and both indexes have two matching years, 1935 and 1936. The index in Appendix Table 3 is calculated from these data and applied to the 1938 basket to find the cost of food in the 1923–1938 period.
Postwar Period
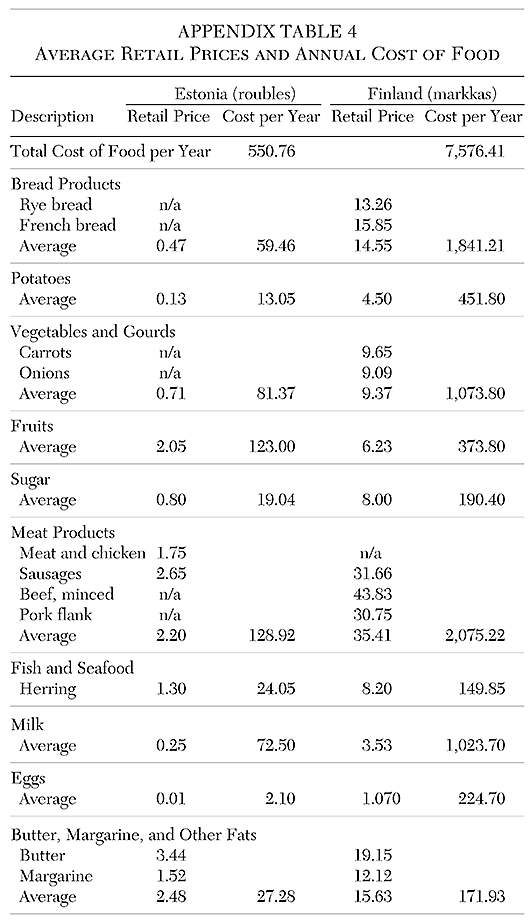
Base Year, 1988. Appendix Table 4 shows average retail prices in 1988 for Estonia and Finland. Retail prices in Estonia are drawn from the National Economy of the Estonian SSR in 1988 (State Statistical Committee of the Estonian SSR 1989: 264), and in Finland from the 1990 Statistical Yearbook of Finland (Central Statistical Agency 1990).
Estonia, 1960–1988. In Estonia’s 1987 statistical yearbook, National Economy of the Estonian SSR, there is a price index for 1986–1988, with a 1980 base year (State Statistical Committee of the Estonian SSR 1988: 280). The index for 1961 to 1988 is calculated from the price index for 1975, the 1980–1984 price index (with a base year 19705100), and the price index for each fifth year between 1960 and 1975 and 1976 (with 19605100) (State Statistical Committee of the Estonian SSR 1977: 217). The data for the interim missing years were calculated using the percentage of average growth. The resulting index was applied for the price of the food basket in 1988 (Appendix Table 5).

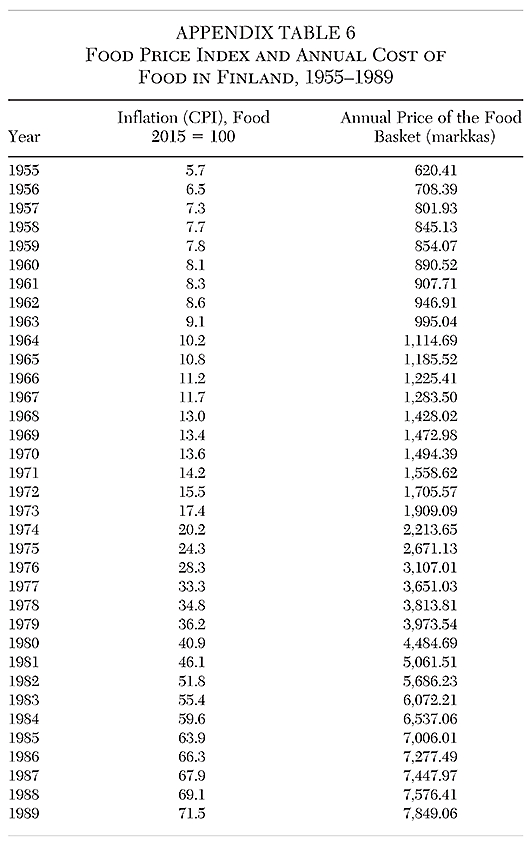
Finland, 1955–1989. Appendix Table 6 shows the annual costs of the food basket based on the cost of the food basket in 1988 and the CPI inflation rate, with the base year 2015 taken from the OECD data.
Post–Cold War Period
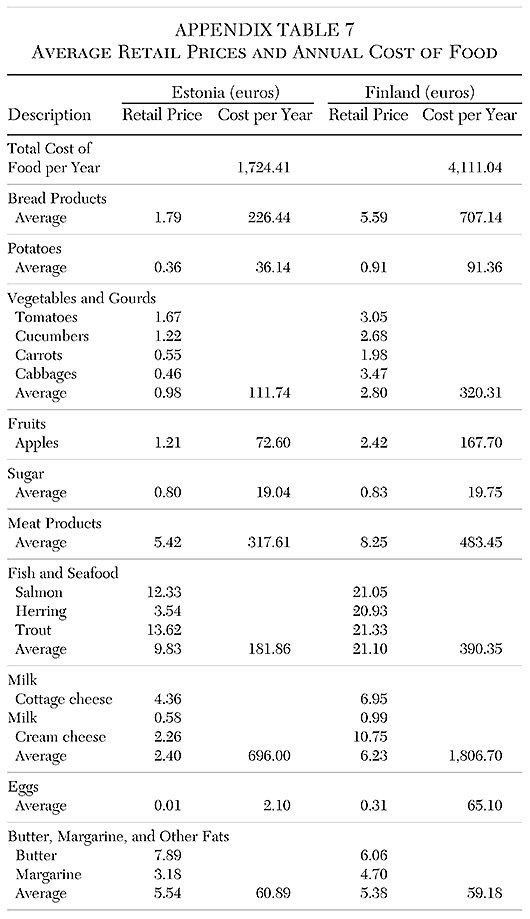
Base Year, 2018. Appendix Table 7 shows the average retail prices for foodstuffs in Estonia and Finland in 2018. Average retail prices for Estonia are published on the website of the Estonian Institute of Economic Research. The margarine and butter prices are taken from the website of Estonian supermarket Selver Heamõte. The average retail prices for foodstuffs in Finland in 2018 are available on the Statistics Finland website.
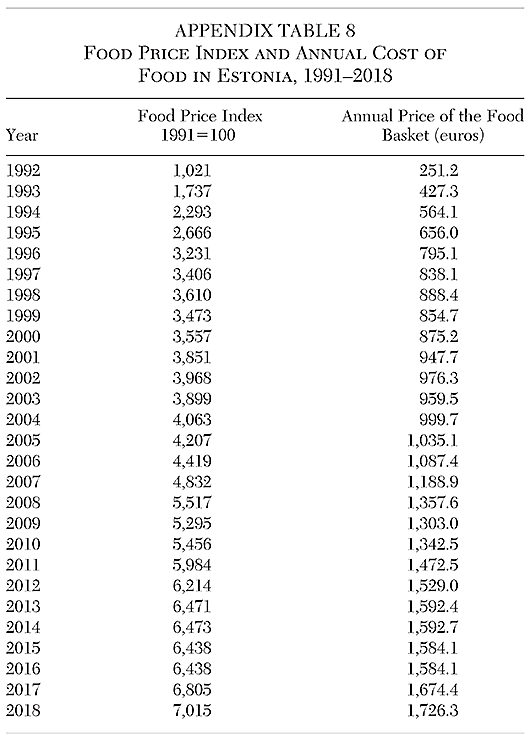
Estonia, 1991–2018. The government agency Statistics Estonia provides the food cost index for 1998–2015, with 2015 as the base year. The food index can be created between 1991–1997 and 2016–2018 by using two tables of CPI changes in relation to previous years published on the agency’s website. Appendix Table 8 shows the food price index in Estonia for 1991–2018.
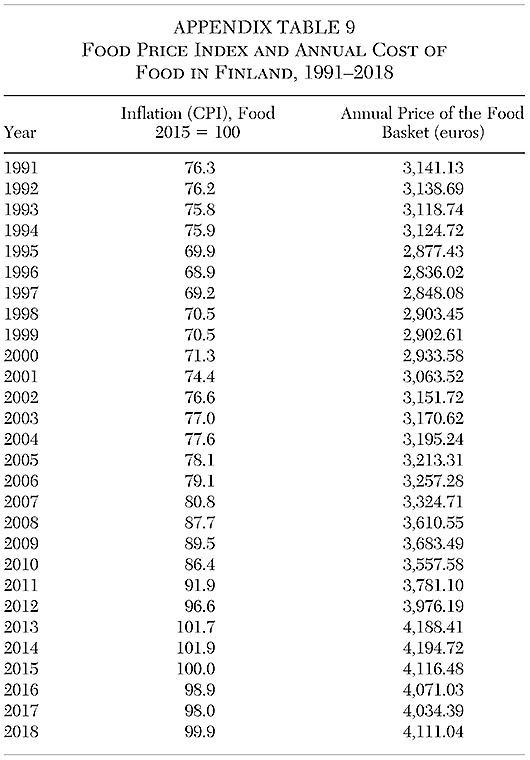
Finland, 1991–2018. Appendix Table 9 shows the food price index in Finland for 1991–2018. Data for the CPI inflation rate (food) in 1991–2015 and the percentage change on the same period of the previous year for the 2016–2018 period were drawn from the OECD data and applied for the annual cost of the food basket in 2018.
Historically, Estonia and Finland shared similar cultural, political, and economic characteristics apart from the almost 50 years of Soviet rule (1944–1991) in Estonia (Raun 1987). During that time, Estonia lacked political freedom and became a centrally planned economy. Meanwhile, Finland remained a democracy with a market economy. After Estonia gained independence in 1991, the resemblance of the institutional landscape in the two neighboring countries started to be restored.
Appendix B: Average Wages
Interwar Period
Due to the lack of data, an accurate comparison of wages in the interwar period was only possible by using the average wages of male workers in large industrial enterprises in both countries.
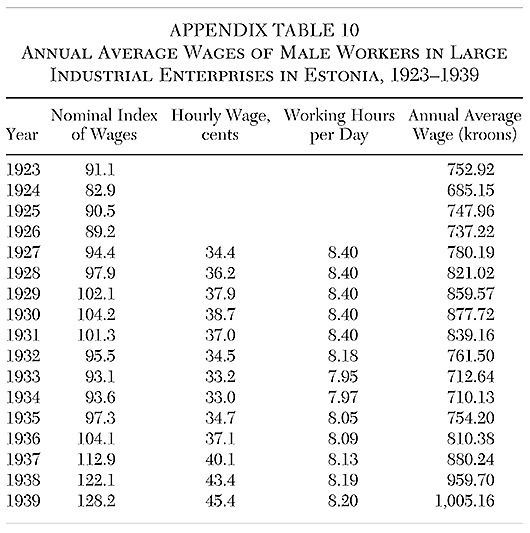
Wages in Estonia. In Statistics Estonia Monthly, No. 223, June 1940, there are data on average hourly wages of male industrial workers from 1927 through 1939 (National Bureau of Statistics 1940). Wages in 1923–1926 were counted according to the nominal index of wages (National Bureau of Statistics 1940). Also, there are statistics on working-day duration for each year from 1932 through 1939; and, as working hours did not change much over time, the working hours for 1927–1931 are the same as in 1932. Appendix Table 10 shows the annual average wages of male workers in large industrial enterprise in Estonia over the 1923–1939 period.
Wages in Finland. This study uses average hourly wages of male workers in the paper and pulp industry, sawmill industry, and metal industry taken from Vattula (1983: 421–41). The average annual wages of male industrial worker were calculated in two ways. Since the sawmill industry was a major sector in Finland at the time (Korpelainen 1957; Ahvenainen 2011), the first average wage count is based on wages in this industry. The second wage count was adjusted for 25 percent of wages in paper and pulp industry, 25 percent of metal industry, and 50 percent of sawmills in 1938, due to the larger employment in the sawmill sector. The 1921–1928 period is based on the wage index from Mitchell (1975: 186). Working hours are the same as in Estonia. Average wages in 1925–1926 in the sawmill industry are based on the trend in the metal industry (coeff: Sawmill/Metal); 1927 and 1935 are interim figures. For the comparison with Estonia, I used the first approach, but the second approach is still relevant. Appendix Table 11 shows the annual average wages of male workers in large industrial enterprises in Finland for the 1921–1938 period.

Postwar Period
Wages in Estonia. Average annual wages in the years between 1960 and 1988 (Appendix Table 12) were collected from different issues of the National Economy of the Estonian SSR: Statistical Yearbook (State Statistical Committee of the Estonian SSR 1968: 199; 1976: 40; 1980: 212; 1989: 229).
| APPENDIX TABLE 12 | |
| ANNUAL AVERAGE WAGES IN ESTONIA, 1960–1988 | |
| Year | Average Annual Wage (roubles) |
| 1960 | 975.6 |
| 1961 | 1015.2 |
| 1962 | 1,045.2 |
| 1963 | 1,078.8 |
| 1964 | 1,120.8 |
| 1965 | 1,183.2 |
| 1966 | 1,239.6 |
| 1967 | 1,321.2 |
| 1968 | 1,478.4 |
| 1969 | 1,551.6 |
| 1970 | 1,623.6 |
| 1971 | 1,683.6 |
| 1972 | 1,749.6 |
| 1973 | 1,790.4 |
| 1974 | 1,846.8 |
| 1975 | 1,917.6 |
| 1976 | 2,028.0 |
| 1977 | 2,088.0 |
| 1978 | 2,112.0 |
| 1979 | 2,160.0 |
| 1980 | 2,264.4 |
| 1981 | 2,313.6 |
| 1982 | 2,356.8 |
| 1983 | 2,407.2 |
| 1984 | 2,499.6 |
| 1985 | 2,581.2 |
| 1986 | 2,652.0 |
| 1987 | 2,748.0 |
| 1988 | 2,748.0 |
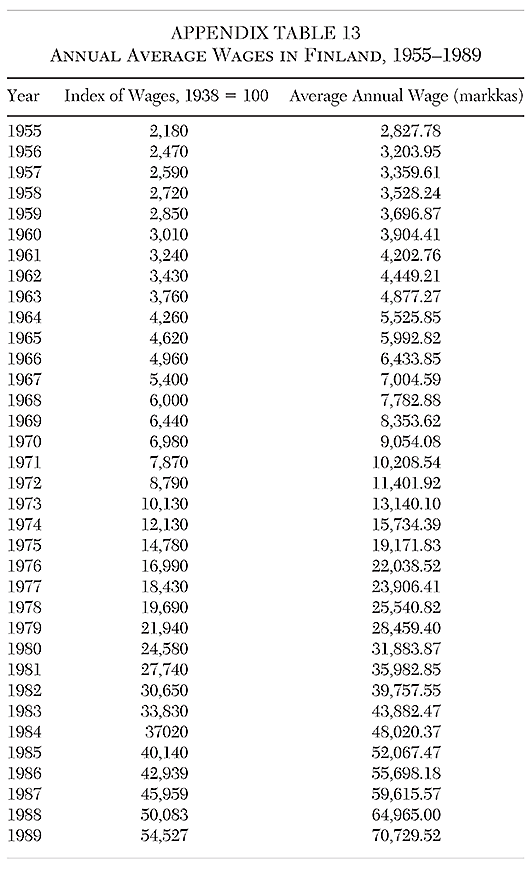
Wages in Finland. Appendix Table 13 shows annual average wages in Finland from 1955 through 1989. The average annual wage in 1988 was drawn from the Yearbook of Nordic Statistics 1991 (Nordic Council of Ministers and the Nordic Statistical Secretariat 1991). The index of wages for 1955–1989 was taken from the Statistical Yearbook of Finland 2005.
Post–Cold War Period
Wages in Estonia. Data on monthly average wages in Estonia in the 1992–2000 period is available on the Statistics Estonia agency website. The 2000–2018 period was drawn from the OECD data. Appendix Table 14 shows annual average wages in Estonia from 1992 through 2018.
| APPENDIX TABLE 14 | |
| ANNUAL AVERAGE WAGES IN ESTONIA, 1992–2018 | |
| Year | Average Annual Wage (euros) |
| 1992 | 420.00 |
| 1993 | 816.00 |
| 1994 | 1,332.00 |
| 1995 | 1,824.00 |
| 1996 | 2,292.00 |
| 1997 | 2,736.00 |
| 1998 | 3,168.00 |
| 1999 | 3,408.00 |
| 2000 | 4,107.72 |
| 2001 | 4,522.69 |
| 2002 | 4,979.85 |
| 2003 | 5,545.41 |
| 2004 | 6,200.45 |
| 2005 | 6,860.80 |
| 2006 | 7,880.47 |
| 2007 | 9,866.77 |
| 2008 | 10,818.04 |
| 2009 | 10,422.89 |
| 2010 | 10,774.01 |
| 2011 | 10,900.07 |
| 2012 | 11,786.88 |
| 2013 | 12,307.80 |
| 2014 | 13,063.60 |
| 2015 | 13,550.27 |
| 2016 | 14,428.19 |
| 2017 | 15,347.50 |
| 2018 | 16,795.39 |
Wages in Finland. The data on annual average wages in Finland in the 1991–2018 period (Appendix Table 15) were drawn from OECD.Stat.
| APPENDIX TABLE 15 | |
| ANNUAL AVERAGE WAGES IN FINLAND, 1991–2018 | |
| Year | Average Annual Wage (euros) |
| 1991 | 2,0471.00 |
| 1992 | 20,868.00 |
| 1993 | 20,853.00 |
| 1994 | 21,291.00 |
| 1995 | 22,227.00 |
| 1996 | 22,976.00 |
| 1997 | 23,450.00 |
| 1998 | 24,465.00 |
| 1999 | 25,399.00 |
| 2000 | 26,640.00 |
| 2001 | 27,490.00 |
| 2002 | 28,100.00 |
| 2003 | 28,924.66 |
| 2004 | 29,988.91 |
| 2005 | 30,993.62 |
| 2006 | 32,131.13 |
| 2007 | 33,241.35 |
| 2008 | 34,688.76 |
| 2009 | 35,609.68 |
| 2010 | 36,693.04 |
| 2011 | 38,005.38 |
| 2012 | 39,099.90 |
| 2013 | 39,628.54 |
| 2014 | 40,147.58 |
| 2015 | 40,694.04 |
| 2016 | 41,188.06 |
| 2017 | 41,285.46 |
| 2018 | 42,122.28 |
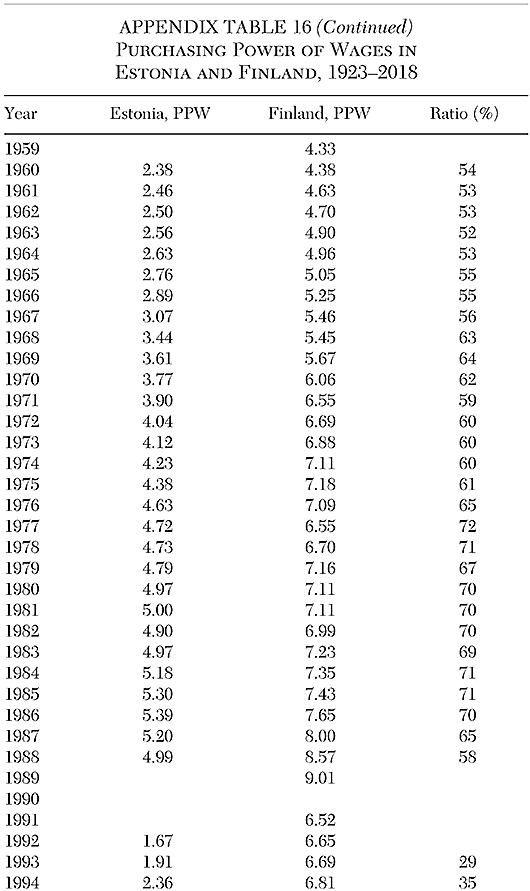
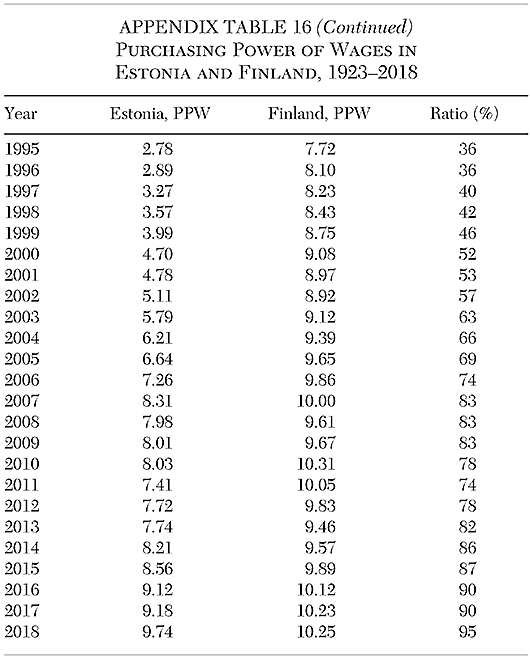
Appendix C: Purchasing Power of Wages, 1923–2018
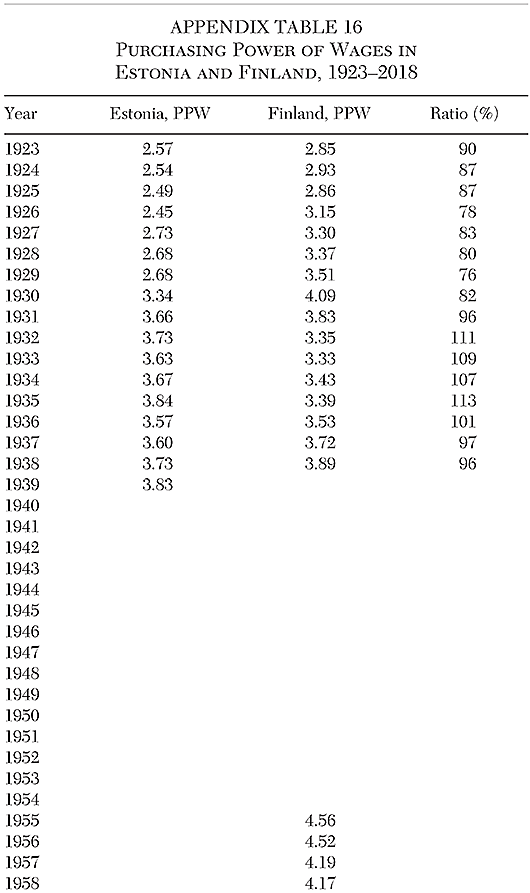
The purchasing power of wages is the quantity of goods and services that can be bought with a wage unit. Its evolution is linked to that of prices and salaries. The ratio of PPW in Estonia to PPW in Finland, from 1923 through 2018, is shown in Appendix Table 16.
References
Aavik, M. (2015) “Mis on Põhjamaade edu saladus?” Postimees Arvamus (June 12).
Ahvenainen, J. (2011) “The Competitive Position of the Finnish Sawmill Industry in the 1920s and 1930s.” Scandinavian Economic History Review 33 (3): 173–92.
Bremmer, I. (2006) The J Curve: A New Way to Understand Why Nations Rise and Fall. New York: Simon & Schuster.
Central Statistical Agency (1938) Statistical Yearbook of Finland 1938. New Series 36. Helsinki: Valtioneuvoston kirjapaino.
________ (1939) Statistical Yearbook of Finland 1939. Vol. 85. Helsinki: Valtioneuvoston kirjapaino.
________ (1990) Statistical Yearbook of Finland 1990. Vol. 90. Helsinki: Valtioneuvoston kirjapaino.
Ellman, M. (2000) “The 1947 Soviet Famine and the Entitlement Approach to Famines.” Cambridge Journal of Economics 24 (5): 603–30.
Estonian Institute of Economic Research (2018) “Average Retail Prices of Groceries in Estonian Stores.” Available at www.ki.ee/index.html.
Hagfors, R., and Kuus, T. (1993) “Income: Structure and Distribution.” In Lugus and Vartia (eds.), Estonia and Finland: A Retrospective Socioeconomic Comparison, 302–30. Research Institute of the Finnish Economy (ETLA), Series B, No. 86. Helsinki: ETLA.
Ilves, T. H. (1999) “Estonia as a Nordic Country.” Minister of Foreign Affairs, to the Swedish Institute for International Affairs (December 14). Available at https://vm.ee/et/uudised/valisminister-ilvese-loeng-rootsi-valispoliitika-instituudis-eesti-kui-pohjamaa-inglise.
Jörgensen, H. (2006) “The Interwar Land Reforms in Estonia, Finland, and Bulgaria: A Comparative Study.” Scandinavian Economic History Review 54 (1): 64–97.
Korpelainen, L. (1957) “Trends and Cyclical Movements in Industrial Employment in Finland, 1885–1952.” Scandinavian Economic History Review 5 (1): 26–48.
Laar, M. (2008) “Leading a Successful Transition: The Estonian Miracle.” European View 7 (1): 67–74.
Lapping, M. B. (1993) “The Land Reform in Independent Estonia: Memory as Precedent: Toward the Reconstruction of Agriculture in Eastern Europe.” Agric Hum Values 10: 52–59.
Lugus, O., and Vartia, P., eds. (1993) Estonia and Finland: A Retrospective Socioeconomic Comparison. Research Institute of the Finnish Economy (ETLA), Series B, No. 86. Helsinki: ETLA.
Mitchell B. R. (1975) European Historical Statistics, 1750–1970. London: Macmillan.
MONSTAT (Montenegro Statistical Office) (2018) “Methodological Guidelines: Minimal Consumer Basket.” Podgorica, Montenegro.
National Bureau of Statistics (1937) Monthly Estonian Statistics 182 (1) and 186 (5). Tallinn: Olion.
________ (1938) Monthly Estonian Statistics 193 (12) and 198 (5). Tallinn: Olion.
________ (1939) Monthly Estonian Statistics 217 (12). Tallinn: Olion.
________ (1940) Monthly Estonian Statistics 223 (6). Tallinn: Olion.
Nordic Council of Ministers and the Nordic Statistical Secretariat (1991) Yearbook of Nordic Statistics 1991. Vol. 29. Stockholm: Norstedts Tryckeri.
Nordic Estonia. “Estonia as a Nordic Country That Got Occupied by USSR.” Available at www.nordicestonia.com/nordic/introduction.
OECD.Data. “Prices: Inflation (CPI).” Available at https://data.oecd.org/price/inflation-cpi.htm.
OECD.Stat. “Databases: Labour: Earnings: Average Annual Wages: Estonia, Finland.” Available at https://stats.oecd.org/Index.aspx?DataSetCode=AV_AN_WAGE#.
Raun, T. (1987) “Finland and Estonia: Cultural and Political Relations, 1917–1940.” Journal of Baltic Studies 18 (1): 5–20.
Russian Federation Labour Code (2012) “On the Consumer Basket in General in the Russian Federation Act, Article 2. N227-FL.” Available at https://legalacts.ru/doc/federalnyi-zakon-ot-03122012-n-227-fz‑0.
State Statistical Committee of the Estonian SSR (1968) National Economy of the Estonian SSR in 1967. Statistical Yearbook 1967. Tallinn: Olion.
________(1976) National Economy of the Estonian SSR in 1975. Statistical Yearbook 1976. Tallinn: Olion.
________(1977) National Economy of the Estonian SSR in 1976. Statistical Yearbook 1977. Tallinn: Olion.
________(1980)National Economy of the Estonian SSR in 1979. Statistical Yearbook 1980. Tallinn: Olion.
________(1988) National Economy of the Estonian SSR in 1987. Statistical Yearbook 1988. Tallinn: Olion.
________(1989) National Economy of the Estonian SSR in 1988. Statistical Yearbook 1989. Tallinn: Olion.
Vattula K. (1983) Economic History of Finland, Vol. 3: Historical Statistics. Helsinki: Tammi.

This work is licensed under a Creative Commons Attribution-NonCommercial-ShareAlike 4.0 International License.