The nearly decade-old Regional Greenhouse Gas Initiative (RGGI) was always meant to be a model for a national program to reduce power plant carbon dioxide (CO2) emissions. The Environmental Protection Agency (EPA) explicitly cited it in this fashion in its now-stayed Clean Power Plan. Although the RGGI is often called a “cap and trade” program, its effect is the same as a direct tax or fee on emissions because RGGI allowance costs are passed on from electric generators to distribution companies to consumers. More recently, an influential group of former cabinet officials, known as the “Climate Leadership Council,” has recommended a direct tax on CO2 emissions (Shultz and Summers 2017).
Positive RGGI program reviews have been from RGGI, Inc. (the program administrator) and the Acadia Center, which advocates for reduced emissions (see Stutt, Shattuck, and Kumar 2015). In this article, I investigate whether reported reductions in CO2 emissions from electric power plants, along with associated gains in health benefits and other claims, were actually achieved by the RGGI program. Based on my findings, any form of carbon tax is not the policy to accomplish emission reductions. The key results are:
• There were no added emissions reductions or associated health benefits from the RGGI program.
• Spending of RGGI revenue on energy efficiency, wind, solar power, and low-income fuel assistance had minimal impact.
• RGGI allowance costs added to already high regional electric bills. The combined pricing impact resulted in a 12 percent drop in goods production and a 34 percent drop in the production of energy-intensive goods. Comparison states increased goods production by 20 percent and lost only 5 percent of energy-intensive manufacturing. Power imports from other states increased from 8 percent to 17 percent.
The regional program shifted jobs to other states. A national carbon tax would shift jobs to other countries. A better policy to reduce CO2 emissions is to encourage innovation rather than rely on taxes and regulation. The United States has already reduced emissions 12 percent from 2005 to 2015, more than any other developed country with a large economy, mainly through innovations in natural gas drilling techniques. There are many other opportunities to invest in innovation, for example, improved solar photovoltaic cells, more efficient batteries, small modular nuclear reactors, and nascent technologies that use fossil fuels without emitting CO2.
Background
Ten northeast states joined together to form the RGGI to require power plants with a capacity of more than 25 megawatts to buy emission allowances for each ton of CO2 emissions. The states included Connecticut, Delaware, Maine, Maryland, Massachusetts, New Hampshire, New Jersey, New York, Rhode Island, and Vermont. The allowances were sold in quarterly auctions beginning in 2008. The initial plan was to gradually reduce the number of allowances available to achieve a 10 percent emission reduction by 2018. New Jersey dropped out of the plan in 2011. In 2013, RGGI, Inc. announced plans for a 45 percent reduction in the number of allowances available in auctions beginning in 2014, with an additional 2.5 percent reduction each year until 2020 (Brown 2013: 1). Consequently, allowance prices began to rise, and RGGI states are now negotiating an extension to 2030, with an additional 30 percent reduction in allowable emissions.
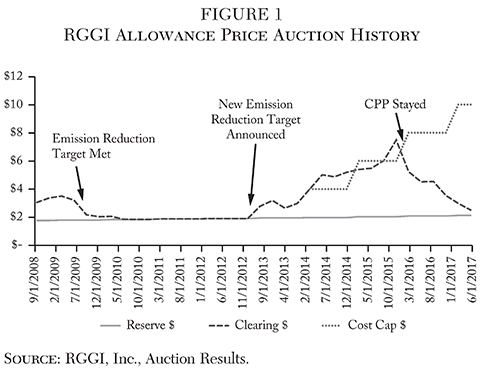
The program is touted by RGGI, Inc. as a market-based system. However, the program applies a minimum reserve price and a Cost Cap Reserve that kicks in additional allowances if an annual price cap is exceeded (Figure 1). The proposed agreement for 2030 also includes an Emissions Containment Reserve whereby states can withhold allowances if auction prices fall below a set target price. A true market-based cap and trade program would allow the market to set the price. Allowance prices averaged about $3/ton from 2008 to 2013 ranging from about $2 to $4. In 2014, there was a dramatic cut in the number of available allowances that forced prices to a high of $7.50/ton in 2015, tracking the Cost Cap Reserve target. Prices began to fall after the Clean Power Plan implementation was stayed by the Supreme Court, and hit $2.53/ton in June, 2017, compared to a reserve price of $2.15. The extension targets a $13/ton price in 2021, and $24/ton in 2030. Speculators have made up roughly one-quarter of allowance purchases, trading with compliance entities in a secondary market.
According to Hibbard et al. (2011:15), in a report for the Analysis Group, “Within the electric system, the impacts of these initial (RGGI) auctions show up during the 2009–11 period, as power plant owners priced the value of CO2 allowances into prices they bid in regional wholesale prices.” A flow diagram in that report (p. 22) shows how the auction costs flow from the electric generators to the electric distributors, and on to consumers, the same as a direct tax or fee would do.
In order to claim success for RGGI, the first cap and trade program in the United States, we need to consider some related issues:
1. Can the measured emission reductions be accounted for by non-RGGI causes?
2. Can the impacts on the economy be clearly broken down into statistically confirmable independent (RGGI inputs) and dependent variables (real GDP, or electric price changes)?
3. Can the RGGI revenue expenditures be shown to have been necessary and to have had significant impacts?
4. Were energy efficiency project claimed savings rigorously tested by weather-adjusted “before and after” meter readings?
RGGI fails to answer these questions. Unfortunately, the data needed for a robust statistical analysis (question 2) are not readily available and obtaining them is beyond the scope of this article. The other three are noted in the text that follows.
Electricity Demand
The change in electricity demand, by necessity, must consider the interplay of real economic growth, the details of that growth, changes in population, the impact of pricing, and changes in energy efficiency. The RGGI program has an impact on these parameters.
It is difficult to compare electric prices from state to state because of significant regional differences in power cost. Also, at roughly the same time RGGI started, many states began requiring increased use of energy sources like wind and solar in their Renewable Portfolio Standard (RPS) laws and set energy efficiency requirements.
A further complication is that a number of states deregulated the supply portion of electric bills allowing market competition just prior to the start of the RGGI program. All the RGGI states deregulated. Fortunately, there is a comparison sample of five non-RGGI states (Illinois, Ohio, Oregon, Pennsylvania, and Texas) that deregulated electric supply in a manner similar to the RGGI states, and also had significant RPS requirements. Both RGGI and non-RGGI states have wide variation in their RPS programs, which adds uncertainty. Increasing wind and solar power raises electric rates because they are premium-priced power sources. For example, the increase in Delaware’s electric prices by 9 percent is directly related to the RPS, which shows up on consumers’ Delmarva Power electric bills. Likewise, Maryland electric bills have increased 14 percent for the same reason, according to a report from the Maryland Energy Administration (Tung 2017: 17).1
Non-RGGI comparison states actually added more wind and solar generation than RGGI states: adding 5.5 percentage points to generation compared to 2.3 percentage points in the RGGI states. Even removing the large wind farm construction effort in Texas from the calculation, the non-RGGI comparison states still outperformed the RGGI states: adding 3.4 percentage points compared to 2.3. The cost of wind and solar power has averaged two to three times the megawatt-hour rate compared to existing conventional fuel sources. The price impact should be greater in the non-RGGI states. Despite this disadvantage, the non-RGGI states still had lower overall price increases.
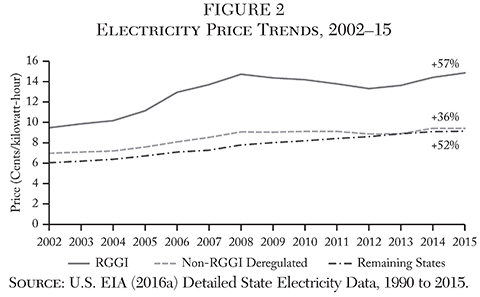
Several states that offered limited deregulation were not included in the comparison, and New Jersey is not included as an RGGI state because it dropped out of RGGI in 2011, and California is not included because it began a carbon tax just a few years ago. The results shown in Figure 2 cover the period from 2002 to 2015 to capture the impact of the four policies taken together (deregulation, RPS, energy efficiency, and RGGI).
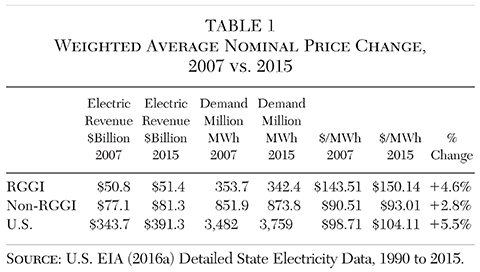
To more accurately isolate the impact of RGGI between 2007 and 2015, the weighted average of total electric revenue for the multi-state groups is used in Table 1, and shows RGGI prices rose 64 percent more than comparison states. The increase was split between direct RGGI cost pass-though and indirect cost. Direct emission allowance cost was $436 million in 2015, about half the price differential between RGGI and comparison states. The rest of the difference may be due to indirect RGGI costs. For example, when power is imported to Delaware and Maryland from the PJM Regional Transmission Organization, there are premium charges for transmission distances, transmission congestion, and capacity. An earlier study, “Cost Impacts of 2013 RGGI Rule Changes in Delaware” (Stevenson and Stapleford 2016: 2), demonstrates that RGGI allowances directly added $11 million a year to Delaware electric bills, while the indirect costs added another $28.5 million.
Prices in RGGI states rose concurrent with more energy-intense manufacturing segments of the economy leaving the RGGI states with slower overall real economic growth based on Regional Real Chained GDP (Table 2). Linking real economic growth to RGGI alone is fraught with problems: real economic growth rates in RGGI states between 2007 and 2015 varied widely from a negative 7.1 percent for Connecticut to a plus 11.9 percent for Massachusetts. Can we realistically claim RGGI helped Massachusetts but hurt Connecticut at the same time?
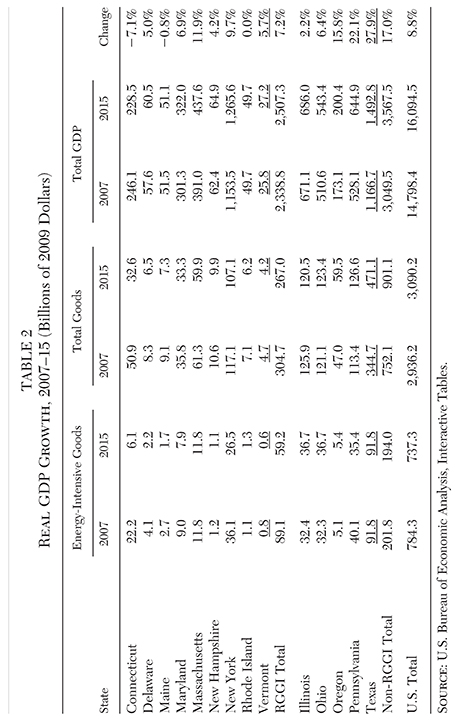
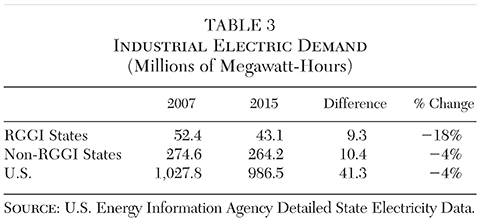
The comparison states’ economies grew 2.4 times faster than the RGGI states. Data from the U.S. Bureau of Economic Analysis show that the RGGI states lost 34 percent of energy-intensive businesses (primary metals, food processing, paper products, petroleum refining, and chemicals); the comparison states lost only 5 percent. The RGGI states lost 12 percent of overall goods production, while the comparison states grew by over 20 percent. We see this impact show up in industrial electric demand with the RGGI states falling 18 percent, while non-RGGI comparison states fell only 4 percent (Table 3).
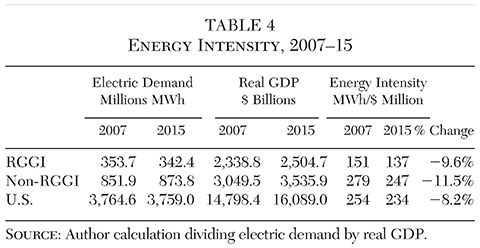
Consideration also needs to be given to energy efficiency improvements as shown by the improvement in energy intensity (Table 4). RGGI states improved by 9.6 percent, while non-RGGI comparison states improved 11.5 percent. (Energy intensity improves when it goes down.)
According to RGGI, Inc. (2016), RGGI states are investing the RGGI revenue in energy efficiency projects, suggesting RGGI states should be improving energy efficiency faster than other states. Based on gains in overall energy intensity, this claim appears to be false. An explanation for this disparity may be that the funds are not going to energy efficiency, or that the energy efficiency projects may not be working well. Both effects are seen in Delaware where 35 percent of allowance revenue is assigned to the Department of Natural Resources & Environmental Control (DNREC), and the rest flows through a private, nonprofit organization known as the Sustainable Energy Utility (SEU). Delaware has received $100 million in RGGI revenue: $55 million remains unspent and another $22 million has gone to administrative overhead and fuel assistance, with just $23 million (23 percent) going for energy efficiency projects.2
The Maryland Energy Administration (2016) reported that only 25 percent of RGGI revenue was allocated to grants for energy efficiency projects, and that doesn’t take into account any money from the grants used for administration by the grantees.
Could the energy efficiency and renewable energy projects have been completed without the RGGI grants? The Maryland 2016 report, Appendix B, lists hundreds of projects receiving grants. Most of the renewable energy grants went to individuals or companies to install solar photovoltaic cells. The grants were small, running from $700 to $1,000 for residential systems that typically cost about $20,000. Solar projects receive federal tax credits, and the owners can sell renewable energy production credits to utilities that are required to buy them by state law, and receive full credit for every kilowatt-hour of energy produced from the local utility. Using a proprietary spreadsheet program, I find that the internal rate of return of a residential system falls from 10.6 percent with the state grant to 9.2 percent without the grant.3 Most of the projects would move forward without the RGGI revenue grants.
In a report for the Delaware Department of Natural Resources and Environmental Control, Small (2012: 3) found that the federally financed “Weatherization Assistance Program,” which receives 10 percent of RGGI revenue, was shut down for two years while all existing projects were reviewed and redone as needed after a federal audit found various quality control issues. This shows how state evaluation, measurement, and verification measures are not working.
The most rigorous test for energy efficiency projects is to check weather-adjusted meter readings before and after the project is implemented. I have found only one large-scale study by Alberini, Gans, and Towe (2013) that did this. The authors found Maryland homeowners who replaced their heat pumps with no incentives saved an average of 16 percent on electric usage. Meanwhile, homeowners receiving cash incentives of $300, $450, and $1,000 or more had energy savings of 6.2, 5.5, and 0 percent, respectively. The authors concluded on page 7 that “the survey responses provide suggestive evidence the ‘rebaters’ were disproportionately replacing ‘inadequate’ units, leading us to conjecture that the rebates are being used to defray the cost of more powerful units, or of units that end up being used more.”
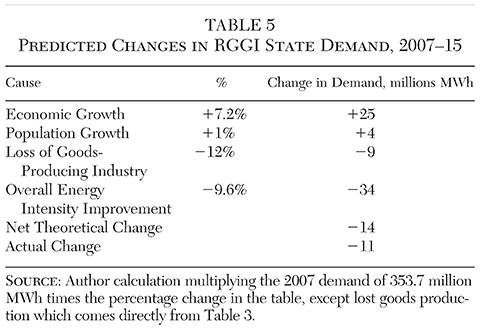
Table 5 shows predicted changes in electricity demand in the RGGI states based on the 2007 demand adjusted for economic growth (7.2 percent from Table 4), population change (1 percent from U.S. Census data), loss of goods production (−12 percent from Table 2), and efficiency improvements (−9.6 percent from Table 4). The actual demand fell 11 million megawatt-hours, close to the projected 14 million.
Impact on Carbon Dioxide Emissions
Emissions were reduced about 40 percent from 2007 to 2015 from electric generating units in the RGGI states (Table 6). That compares to only about a 20 percent reduction in emissions for the country as a whole and the comparison states, suggesting RGGI has been a success. As raw percentages, this would be true, but the base emissions of the RGGI states are much lower than the total for the country, so a relatively small change can appear as a relatively large percent.
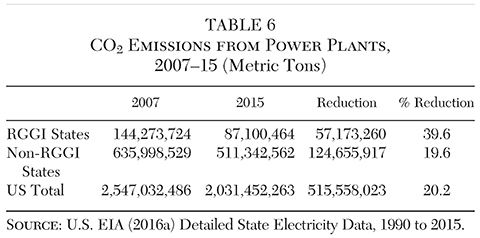
Table 7 shows high CO2 emission coal-fired generation drops 16 percentage points in both RGGI and non-RGGI comparison states, and natural gas rises virtually the same amount (10 for RGGI states versus 9 for non-RGGI states).
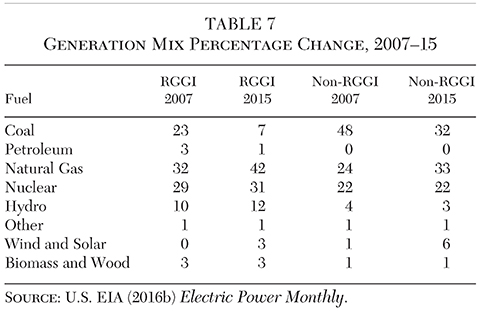
The non-RGGI comparison states actually added more wind and solar generation than the RGGI states (5.5 percentage points versus 2.3), even after allowing for a very large wind farm proliferation in Texas. Some RGGI auction revenue was invested in solar energy projects, but the RGGI, Inc. (2016) report identifies less than 100 MW of added solar capacity, which would account for only about 1 percent of the total wind and solar capacity added in the RGGI states according to generation data in the U.S. EIA Electric Power Monthly .
Another way to sort out the impacts of the RGGI program on emissions reductions is to review regulatory and market impacts to the generation mix and emissions in detail. The impacts of exporting emissions through the increased importing of power must also be considered. If a comparison is made of the estimate of emission reductions using just factors common in all states, the comparison should isolate the impact of the RGGI program. The result of this comparison is discussed below and shows RGGI had no impact on emissions.
Delaware provides an early example of exporting emissions that can be found in a number of articles published in the Wilmington News Journal beginning in January 2008. On December 17, 2008, Delaware participated in its first regional cap and trade auction. Three weeks later the Valero-owned Delaware City Refinery announced the shut-down of its electric generation at the plant. According to RGGI, Inc. (2009), CO2 emissions from the plant’s electric generation facility accounted for 17 percent of Delaware’s initial emission allocation. Valero had been gasifying petroleum coke, a waste product from the refinery, to fuel the power plant. Petroleum coke has emission rates similar to coal, but by gasifying it Valero reduced emissions of other air pollutants. So, three weeks into the RGGI program Delaware met its total 10 percent RGGI reduction goal. That isn’t the end of the story. Valero sold the facility to PBF Energy. PBF restarted portions of the power plant fueled with conventional natural gas. The petroleum coke was loaded onto ships and sent to China to be burned directly for electric generation without pollution controls.
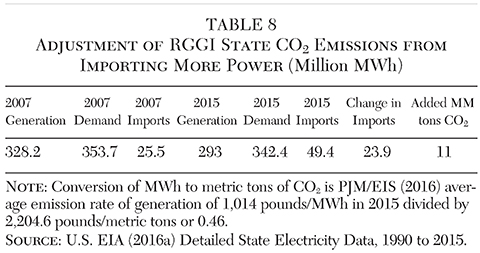
The RGGI states export CO2 when they increase the import of electricity from other states. Between 2007 and 2015, the RGGI states doubled their imports (Table 8). Much of the imported power comes from the PJM transmission region. Adjusting for this factor decreases the RGGI state emissions reductions about 11 million tons.
CO2 emissions are down across the country. A number of major EPA regulations have been implemented since 2009. Electric power plants have seen the most impact from regulation including the Mercury & Air Toxics Standard (MATS), the Cross State Air Pollution Rule (CSAPR), the Carbon Pollution Standard for New Power Plants that established New Source Performance Standards (NSPS), and the Clean Power Plan (CPP), all aimed at reducing the use of coal and forcing the closure of older, smaller power plants that were not worth upgrading with expensive new filtration equipment, given the low cost of natural gas.
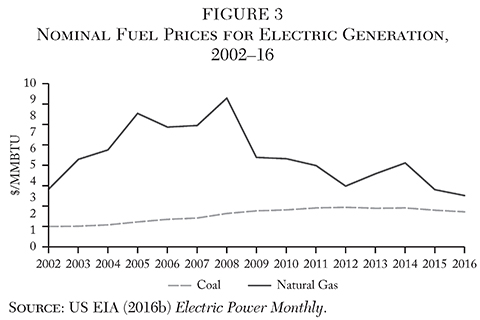
The question is how much of the improvement in power plant emission reduction was caused by EPA regulations. As shown in Figure 3, nominal natural gas prices dropped significantly starting about 2009, driven by an increase in supply from the deployment of hydraulic fracturing and horizontal well drilling technology in shale formations. The types of coal used for electric generation have no other significant uses, and price tends to be stable because electric demand does not vary much from year to year. Natural gas has a number of high volume uses, such as for industrial feedstock and as a primary fuel for heating. Heating demand can vary significantly from year to year. For example, very cold temperatures in the winter of 2014 caused a spike in demand and price. Lower overall natural gas prices played a major role in the switch from coal to natural gas for electric generation starting in 2009, and regulations impacted generation capacity starting in 2012.
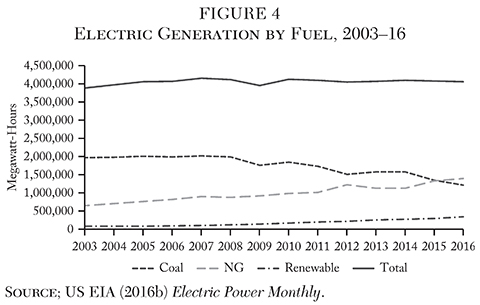
Total electric generation was relatively constant since 2003, but increased almost 3 percent from 2009 to 2016 as the economy recovered from the recession (Figure 4). That increase in demand was met with wind and solar power growth driven by state Renewable Portfolio Standards along with federal and state subsidies. Coal-fired generation was relatively constant until 2008, but began to fall in 2009. The fall paralleled declining natural gas prices. Natural gas generation has been increasing at a relatively constant rate.
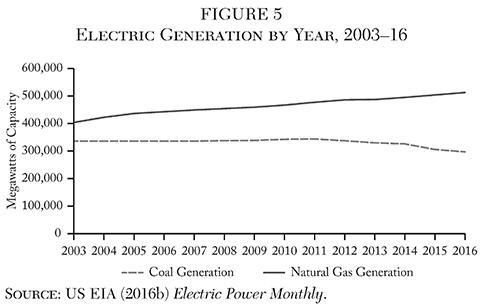
EPA regulations did impact coal-fired generation capacity as shown in Figure 5. The downturn in coal capacity coincides with new regulation implementation beginning in 2012. Lower natural gas prices obviously influenced the decisions to close down the coal-fired generation.
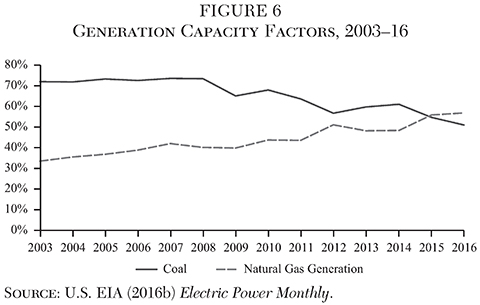
However, more important to coal-fired generation was the change in the capacity factor, that is, how often power plants ran in comparison to natural gas-fired power plants (Figure 6). The decline tracks the falling natural gas price curve that began in 2009.
With some certainty nationally, coal plant capacity reductions were caused by EPA regulations, and output reductions were caused by falling nominal natural gas prices. The impact of the two trends can be parsed. The computational details are provided in Stevenson (2017: 12). The result, both nationally and for the RGGI states, is an identical 28 percent from lost generation capacity, and 72 percent from lower natural gas prices. If the RGGI allowance program had a significant impact, it would have offset some of the impact of lower natural gas prices, because the allowance cost acts as an additional variable production cost, and would have shifted the ratio, but it didn’t. This result is not unexpected as RGGI allowance revenue only averaged 0.6 percent of electric revenue between 2007 and 2015 ($0.3 billion/$51 billion).
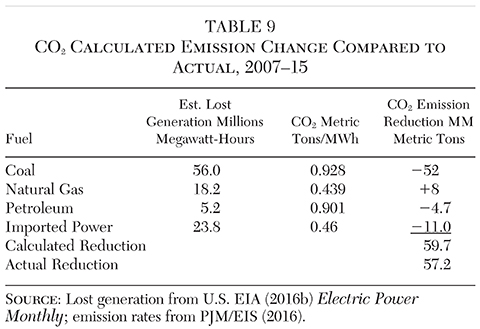
To complete the estimate of emissions from common factors, the changes in natural gas-fired and petroleum-fired generation need to be added. Table 9 shows that the total net estimated reduction in emissions for RGGI states, due to factors common to all states, was 59.7 million metric tons. That figure is slightly higher than the actual reduction of 57.2 million metric tons, which suggests that the actual reduction is accounted for without any significant additional contribution from the RGGI program.
Low Income Program
According to RGGI, Inc. (2016), in its report titled The Investment of RGGI Proceeds through 2014 , 15 percent of RGGI revenue ($178.2 million) went to direct low-income electric bill assistance to 2.6 million households from the beginning of the RGGI auctions in 2008 through 2014. The RGGI funds, about $30 million a year, were added to the federal Low Income Home Energy Assistance Program (LIHEAP). According to the U.S. Department of Health and Human Services (2014: 10–11), the federal government provided $795 million to RGGI states in 2014. Thus, RGGI added less than 4 percent to LIHEAP ($30 million annual RGGI contribution/$795 million federal contribution).
RGGI allowance revenue totaled $1.8 billion through 2014. The allowance program added $0.85/megawatt-hour to electric bills between 2008 and 2014 ($294 million a year/348 million megawatt-hours demand a year). RGGI state residential electric demand has been fairly flat, and averaged 130.9 million megawatt-hours/year. According to the U.S. Census Bureau (2010), there were 17.3 million households in the RGGI states. Thus, residential electric demand averaged 7.6 megawatt-hours per year (130.9/17.3). The total cost of RGGI equaled $6.50/household ($0.85 × 7.6). This reduces the net contribution to low-income households to $5/year ($11.50−$6.50). Therefore, the net RGGI contribution to the federal LIHEAP was only 1.6 percent, an insignificant amount.
Conclusion
In this article, I investigate claims by the Acadia Center (Stutt, Shattuck, and Kumar 2015: 6) and RGGI, Inc. (2016) that the RGGI program has generated significant benefits. Using data from five comparison states with similar overall electricity policies, except for RGGI, along with looking at national trends, I find the RGGI, Inc. and Acadia Center claims to be misleading.
The Acadia Center claims that compared to other states RGGI states increased electric prices by half as much, had 3.6 percent more economic growth, and reduced emissions 16 percent more leading to greater health benefits from pollution reduction. In reality, from 2007 to 2015, net weighted average nominal electricity prices rose 4.6 percent in RGGI states compared to 2.8 percent in comparison states. Linking real economic growth to RGGI alone is fraught with problems. Real economic growth rates in RGGI states between 2007 and 2015 varied widely from a negative 7.1 percent for Connecticut to a plus 11.9 percent for Massachusetts. Also average RGGI revenue amounted to only 0.01 percent of the combined average real GDP of the RGGI states, so one wouldn’t expect much impact. Ignoring those difficulties, real economic growth was 2.4 times faster in comparison states than in the RGGI states. High RGGI state electric rates led to a 34 percent reduction in energy-intensive industries and a 12 percent drop in the goods production sector, while comparison states saw only a 5 percent drop in energy-intensive industries and a 20 percent gain in goods production.
This article finds there were no added reductions in CO2 emissions, or associated health benefits, from the RGGI program. RGGI emission reductions are consistent with national trend changes caused by new EPA power plant regulations and lower natural gas prices. The comparison requires adjusting for increases in the amount of power imported by the RGGI states, reduced economic growth in RGGI states, and loss of energy-intensive industries in the RGGI states from high electric rates.
The RGGI, Inc. report focuses on the impacts of spending the allowance revenue and suggests significant gains in energy efficiency, wind and solar investments, and assistance with low-income energy bills. Noticeably, RGGI, Inc. does not make claims of superior emission reductions or lower power prices. In reality, the spending of the allowance revenue had marginal impacts. All states have shown energy efficiency gains. The RGGI states saw a lower improvement in energy intensity at 9.6 percent compared to 11.5 percent for comparison states, so there appears to be no RGGI-related gain in overall energy efficiency. Wind and solar energy installation was slower in RGGI states, increasing by only 2.3 percentage points, while comparison states grew by 5.5 percentage points, more than twice as fast. RGGI grants for wind and solar power accounted for only about 1 percent of all the wind and solar power added by the RGGI states. The net fuel assistance help for low-income households, 15 percent of all households, added only 1.6 percent to the federal Low Income Home Energy Assistance Program, or less than $5/year. RGGI had no meaningful impact on lower-income families. Meanwhile, the other 85 percent of households saw an increase in electricity cost of $6.50/year directly caused by the RGGI allowance cost.
References
Alberini, A.; Gans, W.; and Towe, C. A. (2013) “Freeriding, Upsizing, and Energy Efficiency Incentives in Maryland Homes.” Fondazione Eni Enrico Mattei Working Paper No. 82. Available at https://papers.ssrn.com/sol3/papers.cfm?abstract_id=2336044.
Brown, J. (2013) “RGGI States Propose Lowering Regional CO2 Emissions Cap 45%, Implementing a More Flexible Cost-Control Mechanism.” RGGI, Inc. Available at www.rggi.org/docs/PressReleases/PR130207_ModelRule.pdf.
European Commission (2016) “CO2 Time Series 1990–2015 per Region/Country.” Emission Database for Global Atmospheric Research (EDGAR) , release version 4.3.2. Joint Research Centre (JRC)/PBL Netherlands Environmental Assessment Agency.
Hibbard, P. J.; Tierney, S. F.; Okie, A. M.; and Darling, P. G. (2011) The Economic Impacts of the Regional Greenhouse Gas Initiative on Ten Northeast and Mid-Atlantic States. Boston: Analysis Group.
Maryland Energy Administration (2016) Maryland Strategic Investment Fund Report on Fund Activities FY2015. Available at http://energy.maryland.gov/Reports/FY15_SEIF_Annual_Report.pdf.
PJM/EIS (2016) “Generation Attributes Tracking System.” System Mix 2015 . Available at https://gats.pjm-eis.com/GATS2/PublicReports/PJMSystemMix/FilterPJM.
RGGI, Inc. (2009) “RGGI Historical Emissions 2000 to 2008 Spreadsheet.” Available at http://www.rggi.org/historical_emissions.
______ (2016) “The Investment of RGGI Proceeds through 2014.” Available at www.rggi.org/docs/ProceedsReport/RGGI_Proceeds_Report_2014.pdf.
______ (2017) “Auction Results for Auctions 1–36.” Available at www.rggi.org/market/co2_auctions/results.
Shultz, G. P., and Summers, L. (2017) “This Is One Climate Solution That’s Best for the Environment and for Business.” Washington Post (June 19).
Small, D. (2012) Annual Report on the Weatherization Assistance Program . Wilmington, Del.: Delaware Department of Natural Resources & Environmental Control.
Stevenson, D. T. (2017) “Sorting Root Causes of Air Quality Improvements 2009 to 2015.” Caesar Rodney Institute Policy Paper (January). Available at https://criblog.wordpress.com/2017/02/12/sorting-root-causes-of-air-quality-improvements-2009-to-2015.
Stevenson, D. T., and Stapleford, J. E. (2016) “Cost Impacts of 2013 RGGI Rule Changes in Delaware.” Caesar Rodney Institute Policy Paper (August). Available at www.caesarrodney.org/pdfs/Cost_Impacts_of_2013_RGGI_Rule_Changes_in_Delaware.pdf.
Stutt, J.; Shattuck, P.; and Kumar, V. (2015) Regional Greenhouse Gas Initiative Status Report, Part 1: Measuring Success. Boston: Acadia Center (July).
Tung, M. B. (2017) “RPS Requirement and Aggregated Cost of RPS.” Presentation to the House Economic Matters Committee, Maryland Energy Administration, Baltimore, Md. (January 15). Available at http://news.maryland.gov/mea/wp-content/uploads/sites/15/2017/01/EconomicMattersPresentation1.23.2017.pdf.
U.S. Bureau of Economic Analysis (n.d.) “Real Chained GDP by State.” Interactive Tables available at www.bea.gov.
U.S. Census Bureau (2010) “Population and Housing Unit Estimate Tables by Year.” Available at www.census.gov/programs-surveys/popest/data/tables.2010.html.
U.S. Department of Health and Human Services (2014) LIHEAP Report to Congress for Fiscal Year 2014. Division of Energy Services. Washington: DHHS.
U.S. Energy Information Agency (EIA) (2016a) Detailed State Electricity Data: “Average Price by State by Provider (EIA-861)”; “Revenue from Retail Sales of Electricity by State by Sector by Provider (EIA-861)”; “Retail Sales of Electricity by State by Sector by Provider (EIA-861)”; “Net Generation by State by Type of Producer by Energy Source (EIA-906, EIA-920, and EIA-923)”; “U.S. Electric Power Industry Estimated Emissions by State (EIA-767, EIA-906, EIA-920, and EIA-923).” Available at www.eia.gov/electricity/data/state.
______ (2016b) Electric Power Monthly (2007 and 2015): “Table 1.4.B Coal by State by Sector, Year-to-Date”; “Table 15B Petroleum Liquids by State by Sector, Year-to-Date”; “Table 1.7.B Natural Gas by State by Sector, Year-to-Date”; “Table 1.9.B Nuclear Energy by State by Sector, Year-to-Date”; “Table 1.10B Hydroelectric (Conventional) Power by State by Sector, Year-to-Date”; “Table 1.14.B Wind by State by Sector, Year-to-Date”; “Table 1.17.B Solar Photovoltaic by State by Sector, Year-to-Date”; Table 4.2 Total Average Cost of Fossil Fuels for Electric Utilities”; “Table 6.7A Capacity Factors for Utility Scale Generators Using Fossil Fuels.” Available at www.eia.gov/electricity/monthly.
1I use 2007 as the base year through 2015, unless otherwise noted. The reason for using 2007 is that RGGI auctions began in 2008, which was also the first year of the Great Recession.
2Calculation is based on information provided in an unpublished e-mail to a state senator of how DNREC spent RGGI allowance funds from 2014 to 2016, and from SEU Annual Reports (available at www.energizedelaware.org/sustainable-energy).
3I assume a 7,500 watt system @$2.85/watt cost with 20 year life, 9,000 KWh first-year generation reduced 0.5 percent per year, $0.1425/KWh electric rate rising 2 percent per year, $6 SREC value, and 30 percent federal investment tax credit.