The state of liquidity after the global financial crisis presents paradoxes. The money markets are awash in liquidity provided by central banks in most advanced countries. Yet by some indicators, liquidity appears to be impaired compared with pre-crisis conditions. By some market indicators, risk taking appears to be vibrant. By others, risk aversion and caution are dominant.
Also puzzling—and troubling—is a proliferation of market anomalies and oddities that have persisted or even grown more pronounced as the crisis itself recedes further into the past. These range from the failure of some basic near-arbitrage relationships to hold, to sporadic market “tantrums” and “flash crashes.”
Much criticism of post-crisis financial regulation has argued that it has made basic intermediary functions—lending and facilitating trades—costlier. The market paradoxes and anomalies indicate that something more is happening. They may be related to a more general impairment of market functioning, or to a rebuilding of pre-crisis levels of leverage, partly in hard-to-discern forms.
A reduction in liquidity compared with pre-crisis may not be unambiguously harmful. Liquidity is closely related to leverage, and ample liquidity before the crisis reflected the extensive leverage some market participants took on, enabled in large part by explicit or implicit public-sector repayment guarantees.
Liquidity is affected not only by regulations directly addressing liquidity, but also by policy measures affecting short-term funding markets, and the supply of and demand for liquidity in various forms. The impact on liquidity is not one to one with any particular change in policy. Frictions and tensions have been introduced that are hard to attribute to specific policies or trends. There is generally an identification problem in associating specific changes in the economy with specific policy changes. It is far more challenging when so many policy changes and changes in the overall economic environment have been taking place simultaneously.
But the results are potentially ominous. The still-highly leveraged financial system has a good chance of being subjected to unusual stresses soon as monetary policy normalizes in a low-growth environment and with high political risks. Will relatively modest reductions in central bank securities purchases or holdings be disruptive? Will the tensions be resolved “peacefully” or otherwise? The risk of disruptions emanating from surprising corners of the financial system is high.
What Is Liquidity Risk?
Liquidity is a difficult concept to pin down. It can refer to phenomena that seem quite disparate but are closely related: how easy it is to buy and sell assets, ease of access to credit, and the amount and forms of money in the financial system. Liquidity is intertwined with other phenomena, especially leverage and risk taking.
Market or transactions liquidity risk is the risk of moving an asset price against oneself while buying or selling, or covering a position, and thus being locked into it. It arises from the cost of searching for a counter-party and the cost of inducing someone else to hold a position. Market liquidity depends on participants’ positions, on institutions such as exchanges and dealer firms that aid search and make markets, and above all on the risk appetites of market participants.1
Funding liquidity risk is the risk to market participants of being unable to maintain debt financing, and having as a result to liquidate a position at a loss that they otherwise would keep. Funding liquidity risk events typically involve short-term debt, which rolls over more frequently than long-term. Financial firms are most susceptible, since they are often in the business of using short-term debt to finance longer-term financial assets, which are harder to sell without loss. The yield curve is generally upward-sloping, making maturity mismatches attractive.
Funding liquidity depends on both the reality and perceptions of borrowers’ creditworthiness and is more fragile when borrowers are highly leveraged. This fragility can be even greater when there is uncertainty about how leveraged the borrowers are; large banks’ balance sheets, for example, are notoriously opaque. Short-term credit is granted in part based on public-sector guarantees, adding to fragility.
Liquidity is closely connected to risk appetites. Higher risk aversion renders liquidity fragile; perceptions about creditworthiness or the solidity of guarantees may suddenly seem less well-founded. When risk aversion is high, dealers are more reluctant to make markets in size and lenders, including short-term lenders on collateral, are less eager to extend credit and to put up with sparse information on creditworthiness.
Funding liquidity is also closely linked to market liquidity, since they interact, and since both suffer when risk aversion is high. Banks, dealers, and traders depend on funding liquidity, either to finance inventories or provide collateral, in order to make markets. Short-term lenders depend on market liquidity to support borrowers’ ability to repay and the value of the collateral they hold. If many borrowers experience a liquidity risk event at the same time, or market liquidity for the assets being financed is poor, forced unwinding or positions may result in a “fire sale,” with prices driven far from any notion of fair value.
Financial crises are often triggered by liquidity events coinciding with abrupt changes in sentiment. Liquidity risk events in financial markets are apt to affect many market participants at the same time. The withdrawal of short-term lenders may be effected through higher interest rates, but as often through non-price rationing, such as increases in “haircuts” on collateral, refusal to accept some collateral, or simple refusal to lend. The onset of a crisis is often described as a liquidity crunch, but could as easily be described as a sudden spike in risk aversion, expressed in part as aversion to some types of privately created liquidity. It is often marked by a run or run-like behavior, in which short-term lenders suddenly converge on a borrower.2
The financial system creates most of what is used as money, in the form of assets corresponding to some short-term debt. Most of the narrowly defined money supply consists of bank deposits. Other short-term assets included in standard definitions of monetary aggregates also carry out at least some of the functions of money, such as availability at par or at least a highly predictable value to buy other assets. A large volume of assets with these characteristics, but not necessarily included in monetary aggregates as defined by central banks, is created by financial intermediaries in wholesale short-term funding markets, in which larger financial and non-financial firms participate. Also known as shadow banking, they have grown rapidly over the past four decades.
The spread between short-term rates with terms of a few days or weeks and longer money market rates is generally particularly wide. Part of the term spread at the very short end of the yield curve is a money premium, the interest forgone in exchange for money services. The money premium makes short-term wholesale funding even more attractive (Greenwood, Hanson, and Stein 2015).
Two important mechanisms of private money creation outside banking are repurchase agreement or repo markets and money market mutual funds (MMMFs). Repo is a form of short-term collateralized lending in which the lender of cash receives bonds as collateral from the borrower. Repo is legally framed as a pair of bond purchases and sales, one now and the other in the future, both at prices that are determined now and imply a lending rate. Repo adds to the supply of liquidity because holders of repo-eligible securities can use them to quickly obtain a predictable amount of liquidity at a predictable rate. It has become a large part of short-term wholesale lending, particularly since a regulatory change in the 1980s exempting repo from the automatic stay in bankruptcy, thus permitting repo cash lenders to immediately sell collateral if their counter-party defaults.3
MMMFs first arose in 1971 and grew rapidly from the mid-1970s, a time of high and rising interest rates, as a means of evading the regulatory ceiling on bank deposit rates. From 1983, the Securities and Exchange Commission (SEC) set credit standards for MMMFs’ asset pools and permitted them to use a fixed $1 par value for share transactions. Growth of so-called institutional MMMFs serving non-financial firms, used less as ready cash than as liquidity reserves, was even faster than that of retail MMMFs. MMMF assets reached nearly $4 trillion before the crisis, the bulk initially in commercial paper, but displaced in part over time by short-term municipal and corporate bonds, and increasingly, repo.
Policy Changes and Interest Rates Since the Crisis
Market behavior has been affected by major changes in monetary and regulatory policies. Policy has in some respects added tremendously to both the supply of and demand for liquidity. Liquidity is also affected by nonpolicy trends that began before the crisis, but have been transformed in its wake, mostly associated with low interest rates. We’ll summarize these developments to help understand recent market behavior.
The identification problem makes it difficult to say which policy or economic change has led to which impact on liquidity. But, in some cases, some direction of influence can be stated.4
Monetary and Debt Management Policies
The Federal Reserve initially responded to the crisis with conventional monetary easing and emergency programs that combined liquidity support for the financial system as a whole with targeted credit support for specific firms and types of intermediation. For most of the past decade, the main policy tool in the major industrial countries has been variants of quantitative easing, the purchase of bonds in large volumes on the open market. It is intended to further reduce the long-term rates most relevant for investment by reducing term and risk premiums once short-term rates have been brought near zero.5
Forward guidance through public statements, on which the Fed has placed far greater reliance since the crisis, is intended to support easing by committing the Fed to keep short-term rates near zero in the future and thus lowering the expected future rates component of the long-term rate. Forward guidance adds to liquidity in the same way that interest-rate smoothing did prior to the crisis, by making market participants confident that financing rates will stay steady.
Quantitative easing is intended to work through different channels from conventional monetary policy, which relies on managing overnight liquidity to set the overnight federal funds rate, focusing on central bank assets rather than liabilities. But by creating a large volume of central bank reserves, it has a strong impact on the markets in which the funds rate is determined. The most direct impact is to flood markets with safe overnight liquidity and vastly reduce banks’ need to trade them.
Several new policy tools have been introduced in the United States to manage that impact and preserve the fed funds market for a future return to conventional policy. Interest on reserves was introduced in late 2008 to keep the funds rate near the target rate or within the target range once the Fed permitted its balance sheet to expand to accommodate the emergency programs. Overnight reverse repurchase agreements (ON RRPs) were introduced as a floor on the funds rate once the bottom of the target range was raised above zero. Policymakers have expressed concern that, by providing a flight destination from private forms of liquidity, ON RRPs could be destabilizing in times of financial stress. While lower limits have at times been placed on ON RRP volume, it is currently limited only by the size of the Fed’s portfolio of Treasury bonds.
U.S. Treasury cash management practices were adapted early in the crisis to support the Fed’s efforts, and more recently have been an independent factor influencing markets. All these changes have affected all money markets, not only that for fed funds.
Regulatory Policies
Regulatory policies have changed substantially since the crisis. Many new rules, a number ordained by the 2010 Dodd-Frank Act, have been adopted in the United States, though the compliance deadlines for some have not yet arrived.6
The Basel minimum capital standards have been revised and increased in a several ways. The minimum common equity ratio is now higher. Criteria for the recognition of non-equity capital have been tightened, but most of the additional capital required can be funded in non-equity forms. Dividends and other payouts are to be slowed or halted if additional capital buffers are breached. Some apply to the largest banks, including a requirement to issue non-equity capital that is intended to be zeroed out and thus limit the need to apply public funds in the event of insolvency.
The revised Basel and U.S. capital standards retain the pre-crisis reliance on risk-weighted assets, and the minimum ratios remain low compared with previous eras; but a capital ratio based on the size of the bank’s balance sheet has been introduced. Banks must satisfy the higher of the two, so either can become a binding constraint. The size-based capital ratios also have a more stringent version for certain very large U.S. bank holding companies, insured bank subsidiaries of which are subject to an enhanced Supplementary Leverage Ratio (SLR) of 6 percent.
Leverage ratios endeavor to address two drawbacks of risk-weighted ratios. Whether based on a table of weights supplied by the regulator or on internal models, weights designed to be risk-sensitive may be drastically inaccurate and induce banks to shift to higher-risk assets. Two classic pre-crisis examples are the zero or near-zero weights on sovereign debt and on senior securitization tranches with low-quality underlying asset pools. The second drawback is that risk-weighting systems, if they are to be accurate and comprehensive, must also be complex in design, on top of the complexities of the composition of regulatory capital. Together with the presence of public-sector guarantees, these problems enable banks to take risk beyond what their capital funding can appropriately bear without external guarantees.
The advantages of a regulatory leverage ratio in countering these problems, however, have the inverse consequence of dis-incentivizing transparent low-risk activities that “use a lot of balance sheet,” that is, add large positions counted as assets in the denominator of the ratio. The U.S. deposit insurance program now imposes fees based on total assets rather than insured deposits, with a similar effect. Criteria for inclusion or exclusion of on- and off-balance sheet positions in the denominator are themselves complex, in addition to the complexities of the capital numerator.
One of the goals of post-crisis regulatory reform has been to reduce short-term wholesale funding. Higher capital standards work in that direction, but new liquidity regulations have also been introduced. Banks’ thin capital cushions and funding liquidity risk are treated as requiring distinct regulatory approaches, rather than viewing short-term wholesale funding as a form of leverage that is particularly attractive to large banks with stronger implicit guarantees.
To that end, two new minimum ratios have been introduced. The Liquidity Coverage Ratio (LCR) can be thought of as a 30-day liquidity stress test, requiring banks to keep enough liquid assets to meet a specific scenario of a run on their short-term funding. The Net Stable Funding Ratio (NSFR) limits maturity mismatch on banks’ balance sheets. Both rely on complex rules for inclusion, weighting and exclusion of assets, liabilities, and off-balance sheet items. The ratios penalize short-term funding not secured by low-risk collateral (i.e., government bonds) and reward short-term lending, and would ceteris paribus increase the money premium.
There is a tension between the liquidity and capital standards as they now stand. Deposits with central banks—primarily excess reserves in the United States—are near-riskless. But they lengthen the balance sheet and raise minimum capital if the SLR is binding and are thus costly to finance relative to their risk and return. But these excess reserves can be used to satisfy the new liquidity regulations, so banks reap a regulatory compliance reward, in addition to interest on reserves.
The so-called Volcker Rule prohibits proprietary trading, as well as ownership by banks, which benefit from deposit insurance and lender of last resort support, of hedge funds, private equity funds, and loan securitizations. Because of the difficulty of discriminating between positions held in anticipation of price changes and those held to facilitate market-making, hedging, and other permitted activities, the Volcker Rule is accompanied by extensive record keeping requirements, and its implementation will depend on regulators’ interpretation even more than for other post-crisis rules.
Changes in the rules affecting MMMFs include permitting a fixed net asset value (NAV) only for funds that invest in U.S. government-issued securities and repo, or serve exclusively retail investors. Other MMMF types must mark their NAV to market daily. Moreover, if there are substantial redemptions in a short time from a nongovernment fund, it is obliged to restrict or impose fees on further redemptions.
The revised rules shift demand from corporate, and to a lesser extent municipal securities, to U.S. issues. The share of government-only funds in total MMMF assets has grown from about one-third in mid-2015 to about three-quarters. The share of U.S. government securities and repo in the assets of all MMMFs has also risen. The shift in allocation enlarged the market for the Fed’s floor-setting ON RRPs.7
Some changes have been introduced through persuasion more than regulation. Repo trading is carried out in different trading venues. Some repo trades are focused on financing long or short positions in specific bonds used as collateral. These repo trades between dealers and their customers are usually cleared bilaterally, a process called delivery versus payment. Dealers themselves want to have matched books, that is, facilitate trades for customers, but limit their own net risk, and inter-dealer trading that achieves this has been moving to a facility called the General Collateral Financing (GCF) Repo Service. Repo trading focused on lending or borrowing money, rather than on specific securities, including GCF repo, settles on the triparty repo platform, a service that has been provided by two large U.S. banks, JP Morgan and BNY Mellon.
A major supervisory concern has been the extremely large exposure of the two tri-party clearing banks during regular business hours. The banks, one of which is exiting the business, fund repo dealers between the time expiring contracts roll off and the dealers return cash to their counter-parties in the morning, and the time they enter into new contracts in the afternoon. The Federal Reserve has been pressuring the banks to reduce this intraday exposure and dealers to use GCF repo. The intraday exposure has in fact been greatly reduced. The effort is consistent with the regulatory effort to channel derivatives trading from bilateral to multilateral clearing platforms.
A relatively new and still diffuse regulatory effort addresses financial stability through a so-called macro-prudential approach to regulation, which views regulation from the point of view of the stability of the financial system as a whole, in addition to the traditional micro-prudential focus on the safety and soundness of individual financial firms. The approach focuses on externalities and systemic risk in finance, that is, profitable activities of individual intermediaries that are said to impose uncompensated risks on others. While not yet well articulated, it has motivated liquidity regulation, as well as supervisory guidance restrictions on riskier loans by banks.8
The macro-prudential approach creates tensions with monetary policy. The approach could aim to crack down on symptoms of excessive credit expansion through regulatory measures. This would insulate monetary policy from financial stability considerations and permit longer periods of ease. Or it might add countercyclical regulatory measures to a generally tight monetary stance that is wary of credit expansion. In the past, this debate was known as “lean or clean.” Today, it is related to the debate on the pace of normalization in the absence of rising inflation.9
Low Interest Rates and Demand for Safe Assets
Some pre-crisis trends have continued since the crisis. Interest rates, particularly long-term rates, had fallen steadily in the years leading up to the crisis. The real interest rate is not directly observable, econometric estimates have wide confidence bands, and market-based estimates are bundled with unobservable risk premiums. But the estimates agree that the real rate has been falling steadily, worldwide. The U.S. real rate has fallen about an additional 200 basis points since the onset of the global financial crisis.
The demand for “safe assets,” including highly rated sovereign bonds and the short-term assets resulting from private liquidity creation described earlier, is closely related to low rates. Before the crisis, the two phenomena met in the “conundrum,” the unusually flat term structure of interest rates, reflecting high demand for longer-term bonds. It was attributed to demand for low-risk fixed-income assets by an aging, wealthier world population. More recently, attention has focused on the ability of such assets to serve liquidity functions, as described above. The crisis is said to have eliminated some asset classes from the supply of safe assets by exposing their credit risk, adding to the downward pressure on interest rates.10
The demand for safe assets contributes to strong demand for U.S. dollar-denominated assets. The demand for U.S. dollar intermediation, including high volumes of both dollar funding and dollar-denominated assets, was seen prior to the crisis and continues after. Much dollar funding is raised directly by non-U.S. issuers of dollar-denominated bonds, and much of that in recent years has been in emerging markets. But a great deal of dollar funding is raised by U.S. offices of foreign banks (FBOs) and lent both within and outside the United States.
Is Liquidity Impaired Now?
Financial markets are displaying many unusual behaviors: conflicting indicators of market and funding liquidity, anomalies and impairments of normal market functioning, and conflicting indicators of risk appetite. These behaviors are related to one another, and how the conflicting evidence is resolved will influence how well the economy can respond to shocks and how disruptive will be central bank efforts to return to more normal monetary policies.
Market liquidity, the ability to alter holdings quickly and cheaply, is very hard to measure. Observable phenomena such as trading volumes and bid-ask spreads are only indirectly related to the cost of buying and selling, and to how much a large securities order changes the market price, and for how long. Even data on observable characteristics are hard to obtain and summarize across asset markets.
Concerns have been raised that higher capital and new liquidity requirements and the Volcker Rule have inhibited market liquidity since the crisis, particularly in the U.S. corporate bond market. But the evidence isn’t robust. Market structure has also been changing, for example the growing prevalence of electronic trading, so identification of the cause of change is difficult.
Trading volume of U.S. bonds overall and dealer balance sheets have declined since the crisis (Figure 1), although trading in corporate bonds, a small fraction of the total, has increased a bit. Much of that may be due to the increased issuance of corporate bonds. Turnover of corporate bonds, the frequency with which the bonds are traded, appears to have declined over the post-crisis decade.
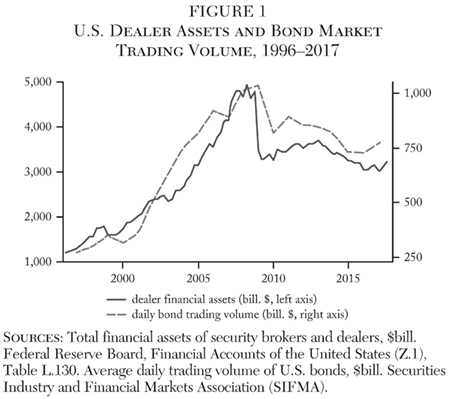
Bid-ask spreads, however, don’t appear to have greatly changed. That would be consistent with the shrinking of dealer balance sheets and a shift from market makers acting as principals and taking long and short positions, to agency trading. It would also be consistent with a shift away from low-risk intermediation requiring balance sheet, and thus debt or equity funding. But entering or exiting a position may now take longer and require more, smaller transactions. All in all, the upfront cost of trading may be steady or even declining, but less immediacy in trades imposes additional implicit costs.11
Since the crisis, transactions liquidity in specific markets has suddenly become not just impaired but has virtually disappeared for periods of a few minutes to a few days. These episodes are loosely referred to as “tantrums” and “flash crashes,” and have occurred in a range of markets and market types. An early such episode took place on May 6, 2010, in the U.S. equity market. Others have occurred in U.S. Treasury and German Bund markets, as well as in the sterling markets. A recent episode in the silver markets is typical of the intraday variety. On July 6, 2017, silver futures fell about 10 percent early in the Pacific trading day, and recovered within a few minutes.
Market as well as funding liquidity may appear ample if demand to use it is low, but disappears if uncertainty and risk aversion abruptly rise. The experience during tantrums suggests that market liquidity may become much less reliable if there is a sustained change in sentiment from the current low volatility regime. The concern about liquidity in a stressed market is strengthened by evidence from the U.S. corporate bond market that market liquidity of specific issues is badly affected by downgrades.12 The tantrums also suggest that market liquidity can’t be assessed on its own but only in the context of the other unusual market behaviors we’re describing.
Risk Appetite
Evidence on risk appetites is also in conflict, with evidence of both risk seeking and risk avoidance. Concerns had been raised prior to the crisis about “reaching for yield,” the propensity of unleveraged long-term investors such as pension funds and insurance companies with fixed future retirement or claim liabilities to shift allocations to higher-risk assets to compensate for low interest rates. It may also be driven by regulatory constraints and public guarantees enjoyed by some intermediaries. For example, regulatory capital requirements on U.S. and European insurers are lower if they hold bonds rather than equities as investments, and regulatory and accounting rules constrain pension plans to hold bonds rather than equities against some liabilities. But within those constraints, long-term investors may increase the duration or credit risk of loan and bond portfolios, select the riskiest bonds within a regulatory category, or deploy their equity allocations in riskier forms such as hedge funds and private investments. Bond investors, before the crisis, pressured rating agencies to inflate ratings by assigning a higher fraction of securitization pools to the most senior bonds (Calomiris 2009).
The pre-crisis patterns of reaching for yield and demand for safe assets have continued barely interrupted after the crisis. For example, the allocation to lower-quality bonds (BBB-rated and speculative grade) in U.S. property and casualty insurance fixed income sector portfolios has risen from about 7 percent in 2007 to about 21 percent in 2016 (New England Asset Management 2017).
Implied and realized asset return volatility have been extremely low in recent years. Implied volatility is expressed through option prices, and it is low when market participants expect future realized volatility to be low, but also when they are eager to take the risk of selling puts and reluctant to pay for the corresponding protection, even at relatively low prices. Figure 2 illustrates with the VIX, a well-known index of equity implied volatility, and the MOVE index of U.S. interest rate volatility. Both are at the lowest levels of their quarter-century history.
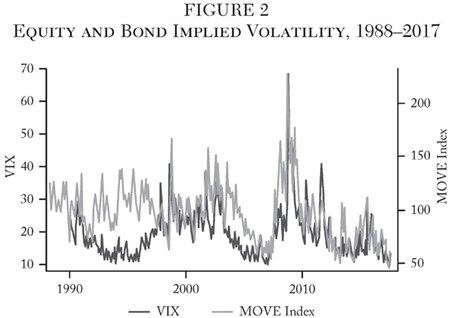
Implied volatility is generally close to, but somewhat higher than, expected volatility, measured using recent realized volatility. The difference, or variance risk premium, is a measure of the pure reward to supplying protection against volatility, and has been substantially lower in the post- than in the pre-crisis years.13
Like low interest rates, low volatility is a pre-crisis phenomenon that has reached new extremes. It is related to reaching for yield, as both express an increased supply of implicit liquidity puts at given prices. Stress conditions have a similar impact on option sellers and investors in down-in-credit bonds: both find themselves locked into positions that can only be exited at prices that have just changed sharply for the worse. Both volatility selling and reaching for yield can lead to discontinuous, “tantrum” behavior of markets.
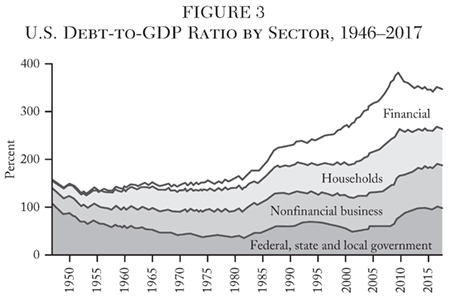
Leverage, finally, remains very high, just below pre-crisis levels. The financial sector has reduced debt levels, and households modestly, while the nonfinancial business and public sectors have increased borrowing (Figure 3). But the rapid increase in debt levels of the post-stagflation era hasn’t been reversed.
Yet there is also countervailing evidence on risk appetites. One indicator of high risk aversion is the same low real interest rates said to motivate reaching for yield. The flat yield curve, the strong demand for 100-year bonds, and the implied volatilities discussed above suggest strong expectations that nominal rates will remain low for the foreseeable future. Some of the factors that could be causing this decline are consistent with or point to risk aversion: a decline in growth and anticipated future real returns, and higher demand for safe assets.
Lower prospective growth and returns are consistent with a range of other observations. Rates of capital investment, the growth of labor productivity, new business formation, and growth of bank loans and leases, for example, are lower than before the crisis. There are alternative explanations for them (e.g., the shift to a service economy, measurement issues, and the role of technology), but these data are also quite consistent with low prospective returns.14
The demand for safe assets may also have increased in recent decades due to factors other than risk aversion, such as increased wealth and aging populations in both developed and developing countries. Some observers have also argued that the supply of safe assets has declined due to central bank purchases and the disqualification of securitized products considered low-risk prior to the crisis. The effect on collateral supply of central bank purchases is only partially offset by adding short-term safe assets in the form of reserves.
The persistence of risk aversion can be seen in corporate bond spreads over risk-free rates, which have tightened massively since the crisis, but are not at record lows. Similarly, Libor remains at a wider spread to overnight interest rate swap rates than before the crisis. Money-market credit spreads may also be kept wider by the combined impact of the LCR and MMMF reform, which has made banks less eager to receive deposits of corporate cash balances not intended for daily transactions, pushing them to government-only funds, and has made government paper relatively attractive. Issuance of commercial paper by U.S. banks other than FBOs has also declined.15
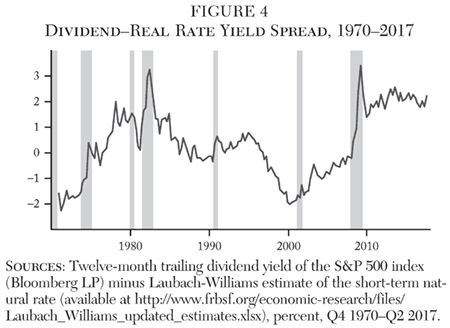
Risk aversion can be seen even in equity prices. Although some commonly cited measures, such as the Shiller CAPE, are high, they are in part an artifact of low interest rates.16 An alternative measure takes low rates into account by subtracting an estimate of the real interest rate from the current dividend yield. Both are real, rather than nominal rates, and the spread is a simple measure of the real equity excess return or risk premium, in effect treating equity as a bond that has both credit and cash-flow risk. The dividend-real yield spread is very high by historical standards, higher even than during the bear market of the late 1970s (Figure 4).17
But low interest rates may not be due only to low growth and pessimism about future returns. Persistent and surprisingly low inflation and inflation expectations are a large part of surprisingly low nominal rates. There is wide agreement that low inflation is a result of past success in anchoring expectation inflations and current low growth rates.18 But while different approaches to the relationship between low inflation and real rates point in the same direction for monetary policy, they point in opposite directions for an understanding of risk appetites.
In one view, the market rate is generally near the equilibrium real rate. Inflation is suppressed because both the real and nominal rates are near zero. Rather than inflation expectations dictating the gap between real and nominal rates, the low nominal rate, together with a real rate immune from longer-term policy influence, dictates low inflation expectations. In this view, pessimism and risk aversion are ascendant. In another view, and despite the evidence to the contrary provided by dormant inflation, the current market rate may be below the real rate. The relatively low market rate may then be an incentive to risk taking. Both views imply a similar policy conclusion: raise nominal rates. But the motivations are quite different: on the one hand, to provide room for inflation to rise, and thus permit at least a transitory rise in growth, and, on the other, to equalize the market to the real rate and tamp down financial excesses.19 The debate is related to the paradox of volatility, the likelihood that periods of unusually buoyant risk appetite, ample liquidity, and low volatility tend toward instability.
Arbitrage Failures and Other Anomalies
Many anomalies have appeared, primarily in the money markets, in which near-riskless arbitrage opportunities fail to disappear over time. Banks are apparently unwilling to lend at a virtually risk-free spread in these cases. These anomalies persist either because banks and other intermediaries aren’t devoting sufficient capital to exploiting them, or because of market frictions that are new or worse since the crisis.
Persistent arbitrage opportunities are not a new phenomenon. The arbitrage process is almost never entirely free of risk, and takes place slowly and incompletely due to various market frictions.20 Some arbitrage opportunities are astonishingly large and persistent, and preceded the crisis, such as the difference between estimates of future inflation rates expressed in nominal and indexed U.S. Treasury securities, and fixed rates of inflation swaps (see Fleckenstein, Longstaff, and Lustig 2014).
But the phenomenon of unexploited arbitrage has become more widespread and pronounced since the crisis, and derivatives markets are not always involved. We’ll examine a set of anomalies in the Eurodollar, fed funds, repo, and swap markets.
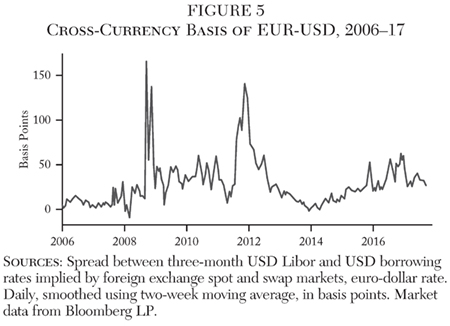
One prominent example has been occurring in foreign exchange markets. The cross-currency basis is the spread between the cost of borrowing U.S. dollars directly versus indirectly, by borrowing in local currency and engaging in a foreign exchange swap. Many non-U.S. entities, such as non-U.S. banks lending dollars to their own customers, want to fund in dollars, and may even be providing dollar funding to their own customers. However, they have less access to the U.S. money markets than U.S. banks, particularly to privileged funding sources such as insured deposits, and face transaction costs in obtaining dollar funding via the foreign exchange markets, so the cross-currency basis is generally positive, but small. The basis spiked at the onset of the global financial crisis and has been unusually wide since, though it should be reduced through a low-risk near-arbitrage carried out by U.S. banks with natural access to dollar deposits. Figure 5 displays the basis for the U.S. dollar against the euro, but it has appeared for a range of major exchange rates against the dollar.21
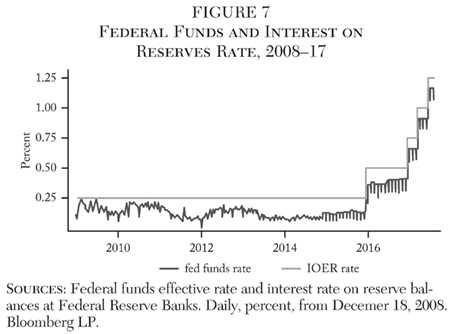
Another anomaly arose almost immediately after the Fed’s introduction of interest on reserves. Reserve balances at the Fed are free of credit risk, but federal funds transactions are unsecured. Banks should be unwilling to lend in the interbank market at an interest rate below that on reserves, which should therefore act, as originally intended, as a floor on the funds rate. With the money markets awash in liquidity, the fed funds rate has generally been well below IOER.
Some non-depository institutions, the housing-related government-sponsored enterprises (GSEs) Fannie Mae and Freddie Mac, and the Federal Home Loan Banks (FHLBs) may keep balances at the Fed, but may not earn interest on reserves. Currently, the limited activity in the fed funds market involves lending by the FHLBs of their large mortgage interest inflows until they are reinvested in new mortgages. The banks could borrow from the FHLBs in the funds market and receive interest on reserves at the Fed, earning a near-riskless spread.
The persistence of the spread has been attributed to regulatory changes, particularly those related to leverage, liquidity, and deposit insurance, as well as the potential stigmatization of banks seen to be borrowing heavily in the funds market. The asset-based deposit insurance fee adds costs to holding balances at the Fed for those banks subject to it. Most of the arbitrage activity is therefore carried out by FBOs, which are subject to different regulatory and accounting rules from U.S. banks, and now hold half of all reserve balances.
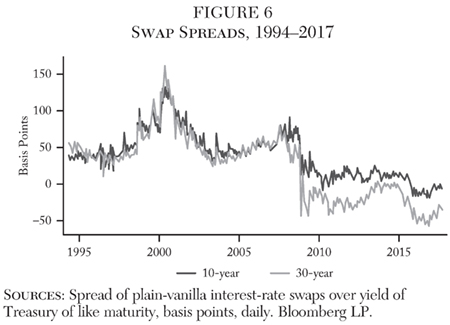
Another post-crisis anomaly is the prevalence of negative swap spreads. Interest-rate swap fixed rates are generally at least somewhat higher than on-the-run U.S. Treasury yields, since swaps have counter-party and liquidity risk premiums absent from the bond yields. Since the crisis, the 30-year spread has been negative, and more recently the 10-year spread has turned negative as well. The swap rates are driven lower in part by institutional investors’ strong demand for duration risk, part of the reaching for yield phenomenon discussed earlier.22
An arbitrage in which banks pay the fixed rate on swaps and establish government bond short positions in the repo market would bring a low-risk net positive cash flow from two sources, the spread between the swap rate and bond yield and the spread between the Libor floating rate paid on the swap and the repo financing rate of the bond short position (Figure 6).
U.S. repo markets are heavily impacted by many of the recent regulatory changes. The repo markets are also at the crux of efforts to normalize monetary policy without disruption. With the fed funds rate essentially disabled as a policy tool, the Federal Reserve has relied increasingly on repo markets to recreate scarcity in the money markets and signal and enforce its target money market rate. The target market-adjusted rate increasingly appears to be the GCF repo rate. The evolution dovetails with regulators’ desire to replace Libor, a set of indexes prepared by banks of interbank rates of different terms to maturity for different currencies, with a more purely market-based index. GCF repo rates have been suggested as replacements for both the fed funds rate as a policy rate and for Libor as a loan and derivative benchmark.23
Repo markets have displayed several anomalies in recent years. Repo lending is secured, and should therefore be executed at lower rates than funds trades. Repo rates have instead generally been above the funds rate in recent years, although the spread has diminished since the end of 2016 (Figure 7). Repo rates have also been quite volatile. Accounting and regulatory reporting constraints have long induced month- and quarter-end “window dressing” spikes in money market rates. These have grown more pronounced for GCF repo. European banks are subject to quarter-end rather than daily average reporting, and are particularly inclined to withdraw from lending on reporting dates. Quantitative restrictions, in which intermediaries show reluctance to accept investors’ cash near reporting dates, are reportedly also appearing.
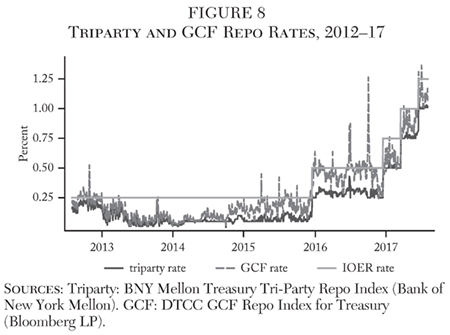
GCF repo trades at a persistent spread above tri-party repo. Tri-party repo can be viewed as the marketplace in which the dealers seek funding for this business from MMMFs and other providers of short-term wholesale funding, while GCF repo can be viewed as the marketplace in which dealers trade among themselves and offer repo to hedge funds and other market participants taking positions in securities. In this sense, the GCF-tri-party repo spread has been likened to the bid-ask spread of the repo market. This spread is wide and fluctuates quite a bit, particularly at month-end. It ought to be contained by arbitrage, since the trades through which the spread is earned are low in risk (Figure 8).24
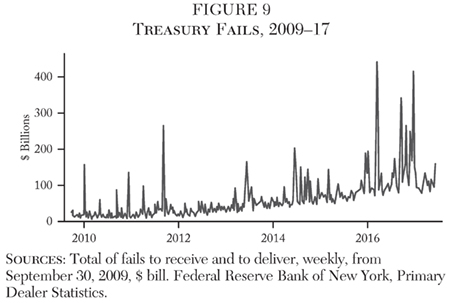
Since the crisis, the incidence of fails in the repo market has greatly increased (Figure 9).25 Fails occur when borrowers of securities don’t return them to the lenders and take back the cash they lent, therefore forgoing interest on it. They can occur for operational reasons, or because there are large short positions in the specific securities borrowed, among other reasons, and are a longstanding phenomenon in repo markets. The incentive to fail to deliver is greater with low interest rates, since the interest forgone on the cash lent is small. A fails penalty was introduced in 2010, but fails have increased greatly nonetheless. Occasionally, they spike briefly to extreme levels. The increase may be due not only to low interest rates but also to the large share of Treasury securities now held on the Fed’s balance sheet and thus out of the market.
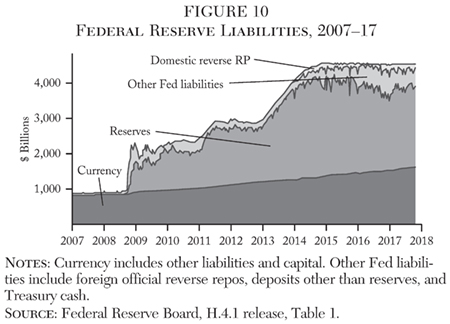
Some of the anomalies we’ve looked at have become somewhat attenuated during 2017, though they haven’t disappeared or returned to the pre-crisis state. One possible reason may be a decline in the Treasury’s General Account deposit balances as the federal debt limit nears. Since the asset side of the balance sheet is being held constant as a matter of policy until the pace of reinvestment is slowed as part of normalization, another Fed liability position must rise. Banks’ reserve balances, which had been declining since 2014, have increased moderately, adding to the supply of liquidity (Figure 10).
Arbitraging these anomalies requires considerable balance sheet and in the presence of a potentially binding leverage ratio, it has been argued, additional balance sheet has a high cost of capital. But the arbitrage is quite low in risk, so the hurdle rates should not be assumed frozen at high levels. Adding very low-risk activities should lower them.26 Rates of return bank equity investors currently seek are based on current equity levels and asset mix. Just as relying more on equity funding would induce a lower market-clearing return on equity, so also would a lower-risk asset mix. The argument that the regulatory capital and liquidity constraints raise the required return on capital above the hurdle rate doesn’t therefore fully explain the phenomenon. One explanation may be debt overhang, a situation in which firms are so highly levered that at least part of the return to profitable equity-financed activities accrues to debt holders.
Conclusion
“Inadequate liquidity” may not be the best way to describe the phenomena we currently see. The anomalies and conflicts we’ve described indicate a larger underlying disfunction. Each anomaly is hard to trace back to a specific regulatory change. Not only have there been major regulatory changes, but the monetary policy response to the crisis, the crisis itself, the continuation of pre-crisis trends, and the financial industry’s adaptation to these also influence market functioning. But taken as a whole, they indicate a general decline in market responsiveness.
Liquidity currently seems ample, but perhaps only because market participants don’t urgently need it right now. The market appears persistently less able to withstand large shocks. Disruptive shocks are likely in the years to come, especially sudden changes in expectations that increase the desire for liquidity, but also cause it to disappear. There are many potential sources that have been of concern for some time: policy normalization, conflict risks, and problems in a number of specific large countries. Overseas reliance on U.S. dollar funding is as great as ever, while the intermediation channels by which it is obtained remain as fragile as ever.
The slowness and difficulty of arbitrage is important. While slow arbitrage is normal, and exceptionally slow arbitrage was part of the crisis, arbitrage is a key mechanism through which shocks and surprises are absorbed. If it’s impaired, the ability to adjust is impaired, and disruptions are more likely to take the form of large price swings, reductions in credit, and other typical crisis phenomena. The banking system remains at the core of the arbitrage process, but is still highly leveraged and dependent on public-sector support in severe stress.
One potential source of shocks and surprises is the anticipated normalization of monetary policy and gradual reduction in central bank balance sheets or in the pace of new purchases. There are potential disruptions if normalization goes forward as expected, and others that might result from much faster or slower normalization than expected. Even in the absence of major surprises in the pace of normalization, the Fed’s new tools for raising rates might not work as expected, resulting for example in money market rates failing to rise with higher targets, or opening wider spreads among money markets. This has not been the case for the first 75 basis points of hiking: market rates have risen in tandem with policy rates, and the ON RRP floor has held, albeit with larger volumes than initially anticipated. But it remains a risk.
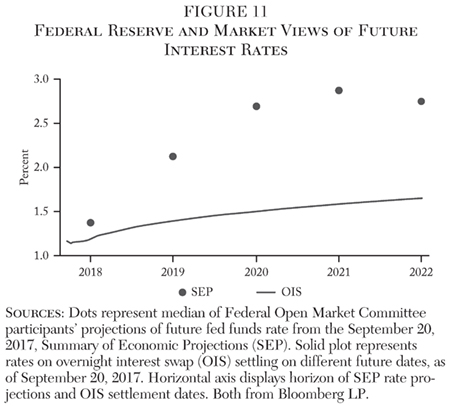
The contrast between market expectations of future rates and the expectations reported by Federal Reserve officials parallels the contrast between indicators of risk aversion and risk appetite. Figure 11 displays future overnight rates from a recent Summary of Economic Projections (SEP), alongside an implied forecast of the overnight rate drawn from money market derivatives markets. Several years out, the gap between market expectations and Fed projections is well over 200 basis points. The projected pace of increases and longer-term market rates have both fallen since the SEP was introduced, but the size of the gap has been remarkably persistent.
This tension will have to be resolved somehow, and it may not be resolved without market disruption. Normalization is needed, but itself poses risks. Future rates closer to Fed projections would surprise markets, while future rates closer to those implied in markets would validate their pessimism. Surprises in either direction could result from the use of new operational tools in drastically transformed markets. Low interest rates may also move discontinuously, amplifying the extensive revaluations that can be expected to accompany a rise in rates.
Low interest rates and volatility, sustained over a long period time, are apt to contribute to a further tightening of financial conditions in response to adverse shocks. The paradox of volatility suggests that hard-to-detect imbalances are growing that are apt to correct themselves disruptively, perhaps as pockets of leveraged investing turn sour. Microeconomic anomalies and evidence of market fragility increase the likelihood of disruptive market events with surprising loci and timing, exacerbating the effects of rising rates and volatility.
References
Aaron, M.; Demers, A.; and Durr, S. (2015) “The Effect of Regulatory Changes on Monetary Policy Implementation Frameworks.” Bank of Canada Review (Autumn): 39–49.
Acharya, V. V., and Schnabl, P. (2010) “Do Global Banks Spread Global Imbalances? Asset-Backed Commercial Paper during the Financial Crisis of 2007–09.” IMF Economic Review 58 (1): 37–73.
Admati, A. R.; DeMarzo, P. M.; Hellwig, M. F.; and Pfleiderer, P. (2013) “Fallacies, Irrelevant Facts, and Myths in the Discussion of Capital Regulation: Why Bank Equity Is Not Socially Expensive.” Working Paper No. 2065 (October), Stanford Graduate School of Business.
Adrian, T.; Fleming, M.; Shachar, O.; and Vogt, E. (2017) “Market Liquidity after the Financial Crisis.” Staff Report No. 796 (June), Federal Reserve Bank of New York.
Baklanova, V.; Copeland, A.; and McCaughrin, R. (2015) “Reference Guide to U.S. Repo and Securities Lending Markets.” Staff Report No. 740 (December), Federal Reserve Bank of New York.
Bao, J.; O’Hara, M.; and Zhou, A. (2016) “The Volcker Rule and Market-Making in Times of Stress.” Finance and Economics Discussion Series No. 2016–102, Board of Governors of the Federal Reserve System.
Basel Committee on Banking Supervision (2011) Basel III: A Global Regulatory Framework for More Resilient Banks and Banking Systems (June), Bank for International Settlements.
__________ (2013) Basel III: The Liquidity Coverage Ratio and Liquidity Risk Monitoring Tools (January), Bank for International Settlements.
Bollerslev, T.; Tauchen, G.; and Zhou, H. (2009) “Expected Stock Returns and Variance Risk Premia.” Review of Financial Studies 22 (11): 4463–92.
Borio, C. (2016) “Revisiting Three Intellectual Pillars of Monetary Policy.” Cato Journal 36 (2): 213–38.
Borio, C.; McCauley, R.; McGuire P.; and Sushko, V. (2016) “Covered Interest Parity Lost: Understanding the Cross-Currency Basis.” BIS Quarterly Review (September): 29–41.
Boyarchenko, N.; Gupta, P.; Steele, N.; and Yen, J. (2016) “Trends in Credit Market Arbitrage.” Staff Report No. 784 (July), Federal Reserve Bank of New York.
Bullard, J. (2016) “Permazero.” Cato Journal 36 (2): 415–29.
Caballero, R. J.; Farhi, E.; and Gourinchas, P. (2017) “The Safe Assets Shortage Conundrum.” Journal of Economic Perspectives 31 (4): 29–46.
Calomiris, C. W. (2009) “A Recipe for Ratings Reform.” The Economists’ Voice 6 (11): 1–4.
Committee on the Global Financial System (2015) “Regulatory Change and Monetary Policy.” CGFS Paper No. 54 (May), Bank for International Settlements.
European Commission (2017) Drivers of Corporate Bond Market Liquidity in the European Union. Available at https://ec.europa.eu/info/sites/info/files/171120-corporate-bonds-study_en.pdf.
Federal Reserve Bank of New York (2017) Domestic Open Market Operations during 2016. Available at www.newyorkfed.org/medialibrary/media/markets/omo/omo2016-pdf.
Fleckenstein, M.; Longstaff, F. A.; and Lustig, H. (2014) “The TIPS-Treasury Bond Puzzle.” Journal of Finance 69 (5): 2151–97.
Foucault, T.; Pagano, M.; and Roell, A. (2013) Market Liquidity: Theory, Evidence, and Policy. New York: Oxford University Press.
Greenwood, R.; Hanson, S. G.; and Stein, J. C. (2015) “A Comparative-Advantage Approach to Government Debt Maturity.” Journal of Finance 70 (4): 1683–1722.
__________ (2016) “The Federal Reserve’s Balance Sheet as a Financial-Stability Tool.” Economic Policy Symposium Proceedings, Federal Reserve Bank of Kansas City: 335–97.
Gromb, D., and Vayanos, D. (2010) “Limits of Arbitrage.” Annual Review of Financial Economics 2: 251–75.
Ihrig, J. E.; Meade, E. E.; and Weinbach, G. C. (2015) “Rewriting Monetary Policy 101: What’s the Fed’s Preferred Post-Crisis Approach to Raising Interest Rates?” Journal of Economic Perspectives 29 (4): 177–98.
International Organization of Securities Commissions (2017) “Examination of Liquidity of The Secondary Corporate Bond Markets.” Available at www.iosco.org/library/pubdocs/pdf/IOSCOPD537.pdf.
Kim, S.; Plosser, M. C.; and Santos, J. A. C. (2017) “Macroprudential Policy and the Revolving Door of Risk: Lessons from Leveraged Lending Guidance.” Staff Report No. 815 (May), Federal Reserve Bank of New York.
Mizrach, B. (2015) “Analysis of Corporate Bond Liquidity.” Research Note, FINRA Office of the Chief Economist. Available at www.finra.org/sites/default/files/OCE_researchnote_liquidity_2015_12.pdf.
New England Asset Management (2017) “2016 Investment Highlights: Historic and Future.” Perspectives (July).
Shleifer, A., and Vishny, R. W. (1997) “The Limits of Arbitrage.” Journal of Finance 52 (1): 737–83.
__________ (2011) “Fire Sales in Finance and Macroeconomics.” Journal of Economic Perspectives 25 (1): 29–48.
1Foucault, Pagano, and Roell (2013) is a general introduction to market liquidity risk.
2Shleifer and Vishny (2011) is an overview and Acharya and Schnabl (2010) a case study of the role of funding liquidity risk in crises and its relation to market liquidity risk.
3Baklanova, Copeland, and McCaughrin (2015) is an introduction to repo.
4The identification problem also makes it difficult to estimate the compliance cost of new and revised regulation, which often leads to different ways of conducting business, not just additional staff and systems.
5Ihrig, Meade, and Weinbach (2015) is an overview of the Fed’s new policy tools and its choices for an exit from crisis policies.
6See Aaron, Demers, and Durr (2015) for an overview of the leverage and liquidity rules and the likely direction of their impact. The Basel capital and liquidity standards are stated in Basel Committee on Banking Supervision (2011, 2013), among other standards documents.
7The shift in demand was also reflected in a widening of spreads between commercial paper and Treasury bills, and of term spreads in the unsecured interbank lending market, which have since been reversed.
8Kim, Plosser, and Santos (2017) describe some of the problems arising from reliance on guidance in supervision.
9An inverse argument is presented by Greenwood, Hanson, and Stein (2016), who propose the Fed maintain a large balance sheet for the foreseeable future. Its liabilities would substitute for private-sector money-like assets that are vulnerable to runs. The authors argue this would be a better-aimed method for averting such runs than the SLR. They address the concern about flight into Fed liabilities by limiting expansion during stress periods.
10Caballero, Farhi, and Gourinchas (2017) is a recent survey. The authors take the view that the effective lower bound in interest rates can prevent the market for safe assets from clearing, leading to elevated risk premiums and forcing the market to clear via a reduction in economic activity.
11See, for example, Mizrach (2015), Adrian et al. (2017), and International Organization of Securities Commissions (2017). Anecdotal evidence from portfolio managers, as well as a report on European corporate bond market liquidity (European Commission 2017), is decidedly more negative on the state of corporate bond market liquidity.
12 See Bao, O’Hara, and Zhou (2016).
13See Bollerslev, Tauchen, and Zhou (2009) and subsequent literature. A simple measure of the variance premium is the difference between the VIX and an exponentially weighted moving average measure of S&P 500 index return volatility (using a decay factor of 0.94). The average daily difference in annualized volatilities from January 1990 to the onset of the crisis at the end of February 2007 was about 4.25 percentage points. The average difference from late September 2011, when the “hot” phase of the crisis can be said to have calmed down, to present was about 2.75 percentage points.
14Two examples: The entry rate of new establishments—places of business—in the United States fell from an average of 12 percent in the decade before the crisis to 10 percent since the crisis, at times below the exit rate (U.S. Census Bureau, Business Dynamics Statistics). Loans and leases in bank credit have grown about 5 percent annually over the past 5 years, a period starting 3 years after the last NBER business cycle trough, compared to about 8 percent over the entire postwar era and over the 20 years prior to 2007 (Federal Reserve H.8 release).
15The lows in the BofA Merrill Lynch U.S. Corporate Master Option-Adjusted Spread (OAS) data are in 1997, and a substantially higher pre-crisis low was reached in March 2005. As of early October 2017, OAS for all ratings, as well as the BBB-AAA quality spread, were higher than their March 11, 2005, levels. Astonishingly, even in the eurozone, where the quantitative easing policy has included large-scale purchases of corporate bonds, the Bloomberg Barclays Euro-Aggregate Corporates OAS is three times as high as in March 2005. The BofA Merrill Lynch Euro High Yield Index OAS is also materially higher than its mid-2007 low.
16The Shiller CAPE is currently over 30, its highest value since the decline in 2000–01.
17This observation is another way of seeing the safe asset shortage.
18Apart from survey data and yields on inflation-indexed U.S. Treasury securities, the anchoring of inflation expectations can be seen in the strongly positive correlation between stock market returns and changes in government bond yields. The correlation had been negative during the 1970s, turned positive around 2000, and increased sharply during the crisis.
19These views can be compared in a recent issue of the Cato Journal. The so-called neo-Fisherian view that inflation may be suppressed by low nominal rates is summarized in Bullard (2016); the view that the equilibrium real rate may be higher than a low inflation rate might lead one to believe in Borio (2016).
20See Shleifer and Vishny (1997) and a more recent survey, Gromb and Vayanos (2010).
21See Du, Tepper, and Verdelhan (2017) and Borio et al. (2016).
22The excess of credit default swap premiums over corporate bond spreads to plain-vanilla swap rates, described in Boyarchenko et al. (2016), is a similar phenomenon.
23See Committee on the Global Financial System (2015) for an overview of anomalies in money markets in relation to the implementation of monetary policy in several advanced economies. Federal Reserve Bank of New York (2017) provides an update for the U.S. as part of its discussion of the effectiveness with which policy rate increases have been passed through to money markets generally.
24Greenwood, Hanson, and Stein (2016) attribute negative swap and the wide GCF-tri-party spread to the SLR.
25The figure omits the extremely large increase in fails during the worst part of the crisis in 2008 and 2009.
26The argument is analogous to that in favor of much higher equity ratios (see Admati et al. 2013).