The Economic Freedom of the World (EFW) index was first published by the Fraser Institute in 1996 and featured data in five-year increments from 1975 to 1995 (Gwartney, Block, and Lawson 1996). Subsequent editions of the EFW index (e.g., Gwartney, Lawson, and Hall 2016) have included data for 1970 and annually since 2000. The EFW index has become a useful tool for empirical researchers studying how institutions consistent with economic freedom correlate with various socioeconomic indicators (Hall and Lawson 2014); this is especially true with respect to economic growth (De Haan, Lundstrom, and Sturm 2006).
This article uses newly gathered and available data and autoregressive methods to create an economic freedom index for the 1950s and 1960s for up to 95 countries. The resulting index allows not only for a longer time series but also for a larger sample of countries than has been previously available.
It is critically important that the new index we develop be reasonably consistent with the existing EFW index. For this reason, we use two methods to mesh the new data we have collected with the existing EFW data. First, we collect data for 1950–80, in five-year intervals, using newly gathered and available data to create a new index. The overlap from 1970 to 1980 will later allow us to parameterize weights. This new index (EFWNEW) is designed to mirror the structure of the current EFW index but because of limited data includes only 8 components rather than 24.1 Second, we use the 1990–2013 EFW ratings to create an autoregressive model to back cast the EFW data to 1950. Because there are more countries available after 1990, this allows us to create index estimates (EFWHAT) for a much larger set of nations than is available in the current EFW index. Finally, the EFWNEW and EFWHAT ratings for 1970, 1975, and 1980 are regressed against the actual EFW ratings. The coefficients from this regression are then used to generate economic freedom ratings for 1950–65 based on the EFWNEW and the EFWHAT ratings for 1950–65.
The development and importance of institutions, variously defined, are an important topic in economic history (see, e.g., Chor 2005; Johnson and Koyama 2017). But most literature evaluating the historical evolution of liberalism is narrative, not quantitative. A notable exception is De La Escosura (2016), who mirrors the EFW index back to 1950 for OECD countries. A working paper by Murphy and Stansel (2017) attempts to do so for individual U.S. states by decade in the 19th century. The broader question of how institutions play a role in the very long run has been addressed, in part, using measures such as colonial deaths (Acemoglu, Johnson, and Robinson 2001) and legal origins (La Porta et al. 1997; Glaeser and Shleifer 2002; La Porta, Lopez-De-Silanes, and Shleifer 2008). Narratives with a focus on the institutional history and economic freedom in the United States include Higgs (1987) and Holcombe (2002), and historical property rights in the United States for women can be found in Geddes and Tennyson (2013) and Lemke (2016). Narratives regarding economic freedom and the development of liberal market institutions in the international context can be found for Australia (Berg 2015), China (Wang and Coase 2012), Czech Republic (Sima and Nikodym 2015), Denmark (Kurrild-Klitgaard 2015), Georgia (Burakova and Lawson 2014), Guatemala (Marroquin and Thomas 2015), India (Manish et al. 2015), Korea (Choi and Yoon 2016), Lebanon (Mardini 2015), Mexico (Kuchar 2016), Poland (Mateusz 2015), Spain (Fradejas 2015), the Spanish colonies (Hough and Grier 2015), Venezuela (Faria and Filardo 2015), and former Yugoslav nations (Prokopijević and Tasić 2015). A general narrative regarding economic freedom around the world at approximately the same years we cover here is found in Yergin and Stanislaw (1998). Our data we hope can complement these narratives and provide more opportunities for economists to test hypotheses in a historical context.
Constructing a New Economic Freedom Index (EFWNEW), 1950–80
We identified eight variables that mirror the components of the current EFW index for a relatively large number of countries for 1950–80. Table 1 lists these eight components.
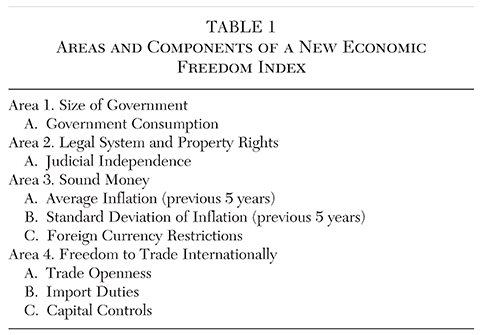
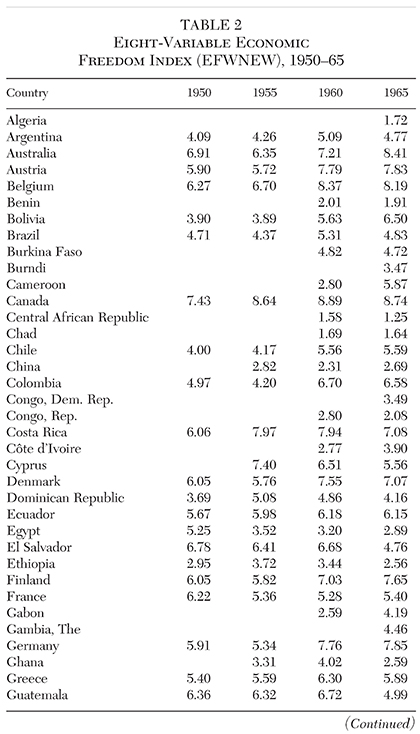
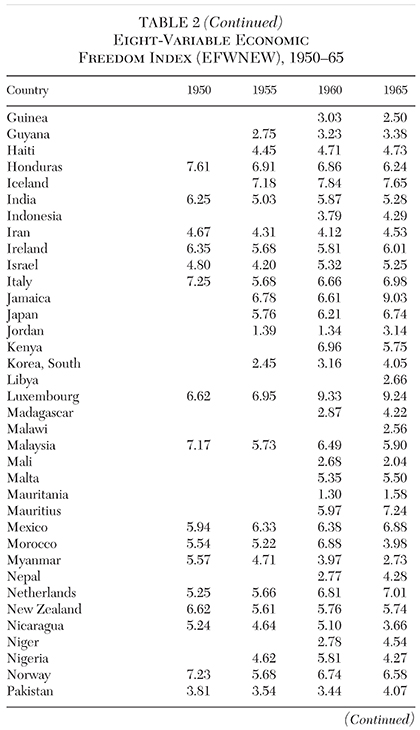
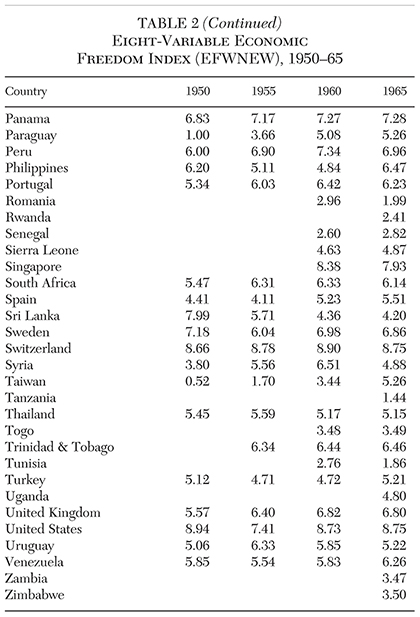
Table 2 shows the new index (EFWNEW) ratings for all countries from 1950–80 based only on these eight components. The entire dataset, including all the components, is available from the authors. A description of each variable and the method for computing the 0–10 index rating is described below.
Component 1A: Government Consumption. This component is government consumption as a share of total consumption from the national accounts. The rating is equal to (Vmax − Vi) / (Vmax − Vmin) multiplied by 10. Vi is the country’s actual government consumption as a proportion of total consumption, while Vmax and Vmin were set at 40 and 6 respectively. Data were gathered from the World Development Indicators, Penn World Tables, and Summers and Heston (1984). This component corresponds to Component 1A in the EFW index.
Component 2A: Judicial Independence. Data from Linzer and Staton (2015) on judicial independence were used to construct 0 to 10 ratings, by simply multiplying their 0 to 1 ratings by 10. This component corresponds to Component 2A in the EFW index.
Component 3A: Average Inflation; and 3B: Standard Deviation of Inflation. Both 3A and 3B use data for the previous five years (e.g., 1955 corresponds to 1951–55, except for 1950, which is 1948–50). The rating is equal to (Vmax − Vi) / (Vmax − Vmin) multiplied by 10. Vi represents the actual value (the average inflation rate for 3A or the standard deviation of inflation for 3B). The values for Vmin and Vmax were set at 0 percent and 50 percent for average inflation, and 0 percent and 25 percent for the standard deviation of inflation. The data source is “Consumer Price Index, All Items, Percent Change, Corresponding Period Previous Year, Percent” in International Financial Statistics. These components correspond to Components 3C and 3B in the EFW index, respectively.
Component 3C: Foreign Currency Restrictions. This component measures two dimensions related to foreign currency restrictions: “Free Ownership of Currency within Country” and “Bank Balances Abroad.” The rating was assigned 0 if “no” for both, 5 if “yes” for one, and 10 if “yes” for both. Data are from various issues of Pick’s Currency Yearbook. This component corresponds to Component 3D in the EFW index.
Component 4A: Trade Openness. This component is a binary variable (0/10) of trade openness as compiled by Sachs and Warner (1995). This component has no exact corresponding component in the EFW index, but broadly corresponds with EFW Area 4.
Component 4B: Import Duties. This component is “Import Duties Over Imports” as compiled by Clemens and Williamson (2004). The rating is equal to (Vmax − Vi) / (Vmax − Vmin) multiplied by 10. Vi is the country’s actual government consumption as a proportion of total consumption, while Vmax and Vmin were set at 30 percent and 0 percent respectively. This component corresponds to Component 4A in the EFW index.
Component 4C: Capital Controls. This component is based on two dimensions associated with capital controls: “Free Ownership of Foreign Securities” and “Free Export of National Currency.” The rating was assigned 0 if “no” for both, 5 if “yes” for one, and 10 if “yes” for both. Data are from various issues of Pick’s Currency Yearbook. This component corresponds to Components 4Di and 4Dii in the EFW index.
Back Casting the EFW Index to 1950 to Create EFWHAT
The second approach we use is to estimate the following autoregressive models for each of the five EFW areas:
(1) AREAt = β0 + β1AREAt+5 + β2AREAt+10 + ε
(2) AREAt = β0 + β1AREAt+5 + ε
In the interest of avoiding overfitting, the model was estimated using data from only 1990–2013. Using multiple models allows us to increase our country coverage as some country areas have only recently come online and did not have a full 10 years available. Table 3 presents the 10 regression models estimated.
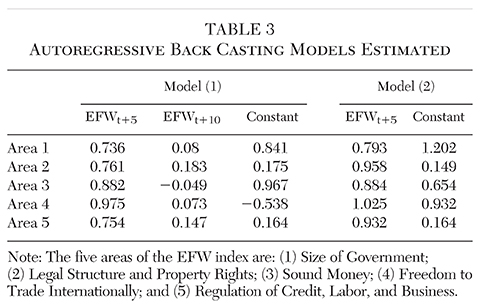
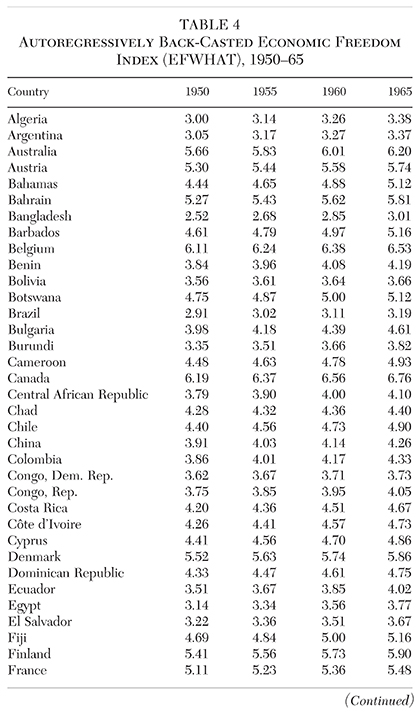
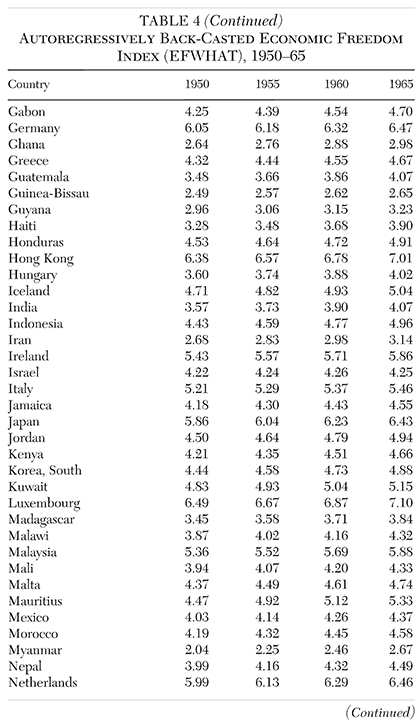
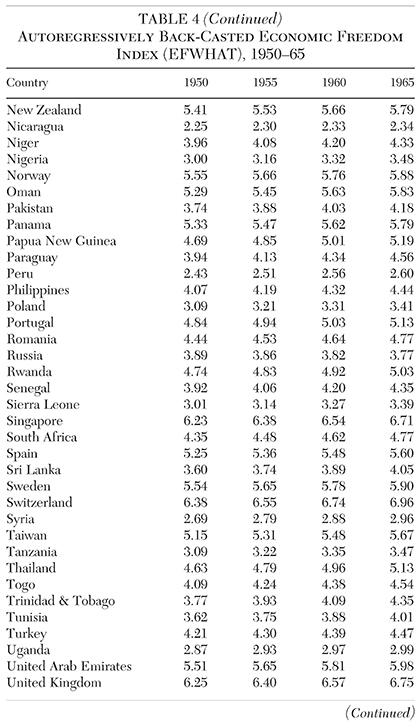
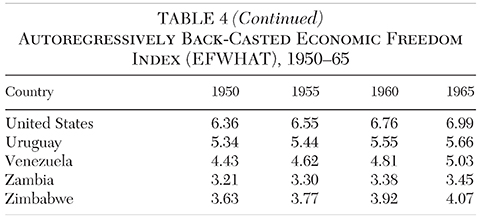
Next, we used the coefficient results from these auto-regressions to back cast the Area EFW ratings, which were then averaged to create a summary economic freedom index (EFWHAT) back to 1950. Thus under Model (1), the estimated rating for 1980 is based on the actual EFW ratings in 1985 and 1990; the 1975 estimated rating was based on the estimated 1980 rating and actual 1985 rating; the 1970 estimated rating was based on the estimated 1975 and 1980 ratings, and so on back to 1950. Table 4 shows these estimated index (EFWHAT) ratings for all countries for 1950–65.
Combining the EFWNEW and EFWHAT Data to Create Economic Freedom Ratings for 1950–65
At this point we have two different sets of economic freedom ratings for 1950–80. One version, EFWNEW, is based on a set of just eight components while the second version, EFWHAT, is based on autoregressively back casted data from the regularly published EFW index. The correlation coefficient between EFWNEW and EFWHAT is 0.58, which indicates that the eight-variable index correlates reasonably well with the back casted index. The simplest way to combine the two would be to take a simple average, but we want the ultimate index to be as comparable as possible with the regular EFW index. Thus, we estimated a final model:
(3)EFWt = β0 + β1EFWNEWt + β2EFWHATt + ε
The time period, t, is years of overlapping data, 1970, 1975, and 1980, and the estimated equation is: EFWt = 1.389 + 0.22 × EFWNEWt + 0.56 × EFWHATt, with an Adj R2 = 0.67. Both coefficients were statistically significant. The estimated coefficients from this model were used to combine the EFWNEW and EFWHAT ratings into a single combined EFWFINAL rating for 1950, 1955, 1960, and 1965. For instance, in the United States in 1950, EFWNEW had a value of 8.94 and EFWHAT 6.36, yielding a value of 6.90 for EFWFINAL. In a very different institutional context, China in 1960 had a value of 2.31 for EFWNEW and 4.14 for EFWHAT, yielding a value of 4.20.
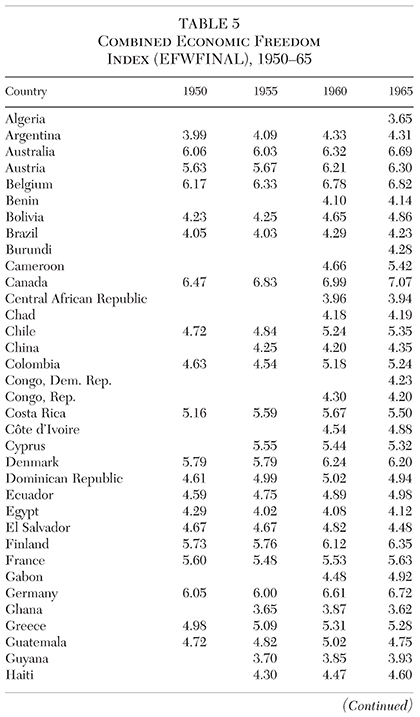
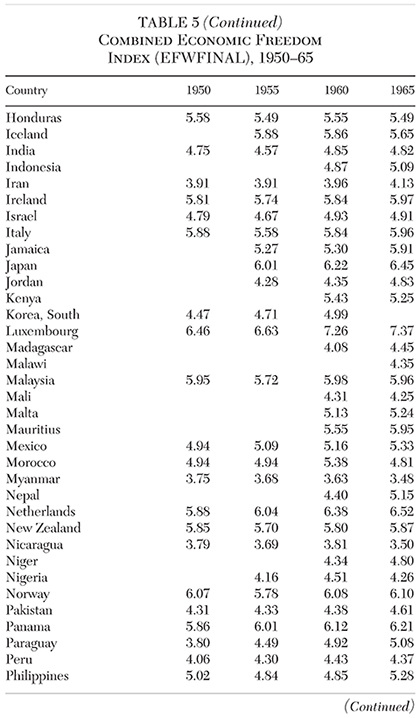
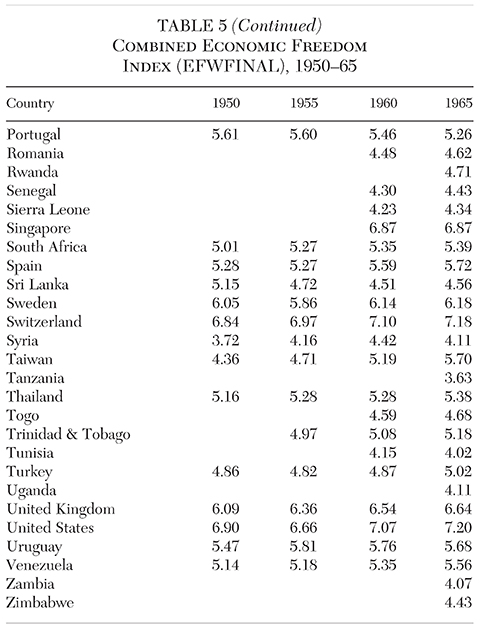
At the end of the day, this approach uses information from later periods along with contemporaneous data to generate economic freedom ratings for the 1950–65 period. Table 5 shows this final combined EFWFINAL index for all the countries and years we have compiled.
Discussion
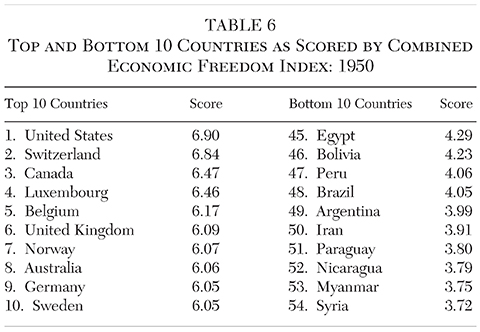
The top 10 and bottom 10 countries as scored by EFWFINAL in 1950 are listed in Table 6. All 10 are Western or Northern European countries and their offshoots (United States, Canada, and Australia). Among countries immediately outside the top 10 are Malaysia (11th) and Panama (14th). The lowest ranking European country as of 1950 is Greece (31st). Taiwan stands out in ranking (43rd), its score being driven by a very low score in EFWNEW. Neither Singapore nor Hong Kong, the longtime leaders in contemporary EFW, is scored for 1950, and due to data limitations Hong Kong is never scored by EFWFINAL.
The United States falls in the rankings in 1955 as data on currency restrictions and capital controls come online, falling behind Switzerland and Canada. There is sufficient data to score Japan starting that year, and it is ranked ninth among 66 countries. China also appears for the first time and ranks 56th (and a very low score of 4.25). Just ahead of China while first appearing is South Korea (50th). Ghana (66th), Guyana (63rd), and Nigeria (58th) all appear for the first time and all fall in the bottom 10 for 1955.
Luxembourg moves into the top spot in 1960, with the United States remaining in third place. Singapore appears for the first time, ranking fifth out of 83 countries, held down somewhat by a middling Judicial Independence score. Mauritius, which in the future would make the top 10 of all countries in EFW, appears first in 1960 and ranks 28th. Most countries added for 1960 appear toward the bottom of the rankings. Among those that are also in the bottom 10 are Central African Republic (82nd), Madagascar (81st), Benin (80th), and Tunisia (79th).
Another nine countries are added for 1965, all of which are in Africa. They are Rwanda (62nd), Zimbabwe (71st), Malawi (73rd), Burundi (77th), Democratic Republic of the Congo (80th), Uganda (87th), Zambia (89th), Algeria (93rd), and Tanzania (94th). Countries that had appeared in the top 10 in 1950 and had fallen out of it as of 1965 were Sweden (16th) and Norway (17th). Among the East Asian Tigers, the data show Taiwan as improving, up to 26th by 1965, but not yet with South Korea, ranked 49th in 1965.
While much of the time series variation in EFWFINAL is driven by EFWHAT, we can focus on the largest movements in EFWNEW from 1950 to 1965 instead. Those that moved up most quickly by EFWNEW are, in order, Taiwan, Paraguay, Luxembourg, Bolivia, and (West) Germany. Those that had fallen the most are, in order, Sri Lanka, Myanmar, Egypt, El Salvador, and Nicaragua. One driver of this variation is the Sachs-Warner data. Of the five improving countries, all except Paraguay did so in part by becoming one of the open economies. Sri Lanka, El Salvador, and Nicaragua fell in part due to becoming one of the closed economies.
Overall, this systematic scoring and ranking reveals a few surprises while conforming sufficiently to the stylized facts of history to be credible. Taiwan and South Korea, regardless of their political alliances, had a very, very low institutional starting point at midcentury. Second, it is Luxembourg, not Singapore, that appears to be the city-state most championing liberal economic policy during this period, setting aside Hong Kong, due to the data limitations.
Conclusion
This article has presented a new economic freedom index for many countries for the 1950–65 period using a small set of eight variables (EFWNEW). This index in turn was combined with a back casted economic freedom index (EFWHAT) based on the regularly published EFW index to create an economic freedom index (EFWFINAL) for these early years. The availability of this index should improve our ability to conduct panel studies over longer periods of time.
References
Acemoglu, D.; Johnson, S.; and Robinson, J. A. (2001) “The Colonial Origins of Comparative Development: An Empirical Investigation.” American Economic Review 91 (5): 1369–1401.
Berg, C. (2015) “Classical Liberalism in Australian Economics.” Econ Journal Watch 12 (2): 192–220.
Burkova, L., and Lawson R. A. (2014) Georgia’s Rose Revolution: How One Country Beat the Odds, Transformed Its Economy, and Provided a Role Model for Reformers Everywhere. Guatemala: The Antigua Forum.
Choi, Y. B., and Yoon Y. J. (2016) “Liberalism in Korea.” Econ Journal Watch 13 (1): 100–28.
Chor, D. (2005) “Institutions, Wages, and Inequality: The Case of Europe and Its Periphery (1500–1899).” Explorations in Economic History 42 (4): 547–66.
Clemens, M. A., and Williamson, J. G. (2004) “Why Did the Tariff-Growth Correlation Change after 1950?” Journal of Economic Growth 9 (1): 5–46.
De Haan, J.; Lundstrom, S.; and Sturm J.-E. (2006) “Market-Oriented Institutions and Policies and Economic Growth: A Critical Survey.” Journal of Economic Surveys 20 (2): 157–91.
De La Escosura, L. P. (2016) “Economic Freedom in the Long Run: Evidence from OECD Countries (1850–2007).” Economic History Review 69 (2): 435–68.
Faria, H. J., and Filardo, L. (2015) “Venezuela: Without Liberals, There Is No Liberalism.” Econ Journal Watch 12 (3): 375–99.
Fradejas, F. H. (2015) “Liberal Economics in Spain.” Econ Journal Watch 12 (2): 221–32.
Geddes, R. R., and Tennyson, S. (2013) “Passage of Married Women’s Property Acts and Earnings Act in the United States.” Research in Economic History 29: 145–89.
Glaeser, E., and Shleifer, A. (2002) “Legal Origins” Quarterly Journal of Economics 117 (4): 1193–1229.
Gwartney, J.; Block, W.; and Lawson, R. A. (1996) Economic Freedom of the World: 1975–1995. Vancouver: The Fraser Institute.
Gwartney, J.; Lawson, R. A.; and Hall, J. (2016) Economic Freedom of the World: 2016 Annual Report. Vancouver: The Fraser Institute.
Hall, J., and Lawson, R.A. (2014) “Economic Freedom of the World: An Accounting of the Literature.” Contemporary Economic Policy 32 (1): 1–19.
Higgs, R. (1987) Crisis and Leviathan: Critical Episodes in the Growth of American Government. New York: Oxford University Press.
Holcombe, R. G. (2002) From Liberty to Democracy: The Transformation of American Government. Ann Arbor: University of Michigan Press.
Hough, J. F., and Grier, R. (2015) The Long Process of Development: Building Markets and States in Pre-Industrial England, Spain, and Their Colonies. New York: Cambridge University Press.
Johnson, N. D., and Koyama, M. (2017) “States and Economic Growth: Capacity and Constraints.” Explorations in Economic History 64: 1–20.
Kuchar, P. (2016) “Liberalism in Mexican Economic Thought, Past and Present.” Econ Journal Watch 13 (1): 129–67.
Kurrild-Klitgaard, P. (2015) “Classical Liberalism and Modern Political Economy in Denmark.” Econ Journal Watch 12 (3): 400–31.
La Porta, R.; Lopez-De-Silanes, F.; Shleifer, A.; and Vishny, R. W. (1997) “Legal Determinants of External Finance.” Journal of Finance 52 (3): 1131–50.
La Porta, R.; Lopez-De-Silanes, F.; and Shleifer, A. (2008) “The Economic Consequences of Legal Origins.” Journal of Economic Literature 46 (2): 285–332.
Lemke, J. (2016) “Interjurisdictional Competition and Married Women’s Property Acts.” Public Choice 166 (3): 291–313.
Linzer, D. A., and Staton, J. K. (2015) “A Global Measure of Judicial Independence, 1948–2012.” Journal of Law and Courts 3 (2): 223–56.
Manish, G. P.; Rajagopalan, S.; Sutter, D.; and White, L. H. (2015) “Liberalism in India.” Econ Journal Watch 12 (3): 432–59.
Mardini, P. (2015) “The Endangered Classical Tradition in Lebanon: A General Description and Survey Results.” Econ Journal Watch 12 (2): 242–59.
Marroquin, A., and Thomas, F. (2015) “Classical Liberalism in Guatemala.” Econ Journal Watch 12 (3): 460–78.
Mateusz, M. (2015) “Liberal Economics in Poland.” Econ Journal Watch 12 (2): 233–41.
Murphy, R. H., and Stansel, D. (2017) “Subnational Economic Freedom of the U.S. States in the Nineteenth Century.” O’Neil Center for Global Markets and Freedom Working Paper, Southern Methodist University.
Prokopijević, M., and Tasić, S. (2015) “Classical Liberal Economics in Ex-Yugoslav Nations.” Econ Journal Watch 12 (2): 260–73.
Sachs, J. D., and Warner, A. (1995) “Economic Reform and the Process of Global Integration.” Brookings Papers on Economic Activity 26: 1–118.
Sima, J., and Nikodym, T. (2015) “Classical Liberalism in Czech Republic.” Econ Journal Watch 12 (2): 274–92.
Summers, R., and Heston, A. (1984) “Improved International Comparisons of Real Product and Its Composition: 1950–1980.” Review of Income and Wealth 30 (2): 207–19.
Wang, N., and Coase, R. (2012) How China Became Capitalist. New York: Palgrave Macmillan.
Yergin, D., and Stanislaw, J. (1998) The Commanding Heights: The Battle between Government and the Marketplace That Is Remaking the Modern World. New York: Simon & Schuster.
1For a complete listing of the areas, components, and subcomponents of the 2016 EFW index, see Gwartney, Lawson, and Hall (2016: 3).
About the Authors
