The worst pandemic in 100 years has hit the United States at a time when economic thinking has become more comfortable with high public debt, facilitating an aggressive response in public spending for relief that has reached a remarkable 27 percent of GDP.1 One reason for the receptiveness to large spending has been the perception that the fiscal stimulus in the Great Recession of 2007–2009 erred on the side of excessive caution and left an aftermath of unduly slow growth. More fundamentally, low real interest rates in recent years have shifted the center of gravity in macroeconomic analysis away from concern about chronic deficits and rising debt toward a certain benign neglect of debt as a problem. In early 2021, Paul Krugman wrote:
… there is now widespread agreement among economists that debt is far less of a problem than conventional wisdom asserted. Among other things, while the level of federal debt may seem high, low interest rates mean that the burden of servicing that debt is actually very low by historical standards.
The political sphere has been quick to seize on the new view. As Thomas Friedman (2021) wrote in the New York Times, “a powerful consensus … has taken hold on both parties”—“we are in a new era of permanently low interest rates, so deficits don’t matter .…”
Among economists, the new nonchalance about debt is by no means unanimous. The Congressional Budget Office (2021c: 5) emphasizes the risks associated with debt on track to exceed 200 percent of GDP by 2051:
Debt that is high and rising as a percentage of GDP boosts federal and private borrowing costs, slows the growth of economic output, and increases interest payments abroad. A growing debt burden could increase the risk of a fiscal crisis and higher inflation as well as undermine confidence in the U.S. dollar.
Likewise, the Committee for a Responsible Federal Budget (2021) has consistently been among the most vocal critics of the outlook for rising public debt. Moreover, Treasury Secretary Janet Yellen stated in 2017 that the United States was on an “unsustainable debt path,” and in confirmation hearings, she reiterated that “there are long-term budget challenges” (Yellen 2021: 26).
In contrast, Furman and Summers (2020: 28, 31) argue that “CBO‘s forecasts of net interest as a share of GDP have been systematically biased toward being too high” and that “policymakers should put relatively little weight on projections for ten years or more in the future.”
A core problem with ignoring debt because of low interest rates is rollover risk. Upon maturity, a federal note or bond must be refinanced with new borrowing. As the debt to GDP ratio climbs, at some point financial markets are likely to demand higher interest rates—as seen in the “taper tantrum” of 2013 when rates reacted sharply to the announcement that the Federal Reserve would wind down “quantitative easing” purchases of federal debt. Even though in principle the United States could always inflate away its real debt because it borrows in its own currency, the prospect of a need to do so would widen the inflation risk premium. Moreover, because of likely political intolerance to inflation high enough to make a sharp reduction in outstanding real debt, financial markets could begin to incorporate a credit-default risk premium.
The causes of the near-zero real 10-year Treasury rate in recent years remain the subject of debate. The hypotheses include rising inequality (combined with a higher marginal saving rate of the rich), the rise in China’s contribution to the global pool of savings, heightened risk aversion in the wake of the Great Recession (and now the pandemic) and a corresponding rise in demand for safe assets, a long-term decline in growth, a shift to new technologies requiring less capital, and others (Mankiw 2020). As discussed below, the Congressional Budget Office has attempted to model the various influences causing the low rates, and finds that, even taking such trends into account, the path of rising debt relative to GDP brings the real 10-year rate back up to 1.4 percent by 2031, an average of 1.6 percent in 2032–2041 and 2.3 percent in 2042–2051, and 2.7 percent by 2051 (CBO 2021b; 2021c: 34, 43).
This article takes the approach of setting a “prudential” floor for the real interest rate in projecting federal debt. It first calculates the ex post realized real interest rate (RRIR) on the 10-year Treasury note over the past six decades. It then sets the prudential floor for the RRIR at 1 percent, the 33rd percentile in the past distribution of real rates. Using a simple accounting model that estimates the interest obligation on each future vintage of new borrowing, I find that a real rate of 1 percent by 2025 causes a path of interest burden that is close to the historical average of 1.9 percent of GDP by that time, and that reaches 4.7 percent of GDP by 2050.2 Incorporation of the impact of rising debt on the real interest rate raises the projection further to 5.8 percent of GDP by 2050. A sizable persistent primary deficit of about 3 percent of GDP, rising to over 4 percent, thus yields a dangerously high long-term debt burden whether measured by the ratio of interest or debt to GDP.
At a real interest rate of 1 percent, classic Maastricht fiscal targets would shift from 60 percent of GDP for the debt to GDP ratio to about 130 percent, and from 3 percent of GDP to 4 percent for the fiscal deficit. However, even these more lenient targets would not be met unless primary deficits are cut to about 1 to 2 percent of GDP, well below their current path rising from about 3 percent of GDP to 4.5 percent by the 2040s as social security and especially health outlays escalate.
The broad finding of this study is that the U.S. debt burden is on a long-term path to unprecedented heights even when measured by interest payments, despite the low interest rates of recent years. This diagnosis remains valid for an alternative metric of real debt service (interest plus amortization) relative to real GDP. Curbing primary deficits will be necessary to moderate this precarious path.
Real Interest Rate versus Growth and Debt Sustainability
Low real interest rates in recent years have focused attention on the analysis of public debt sustainability in the “r − g” framework: the race between debt build-up from interest paid on outstanding debt and growth in the GDP base available to service the debt. In 2003 I set forth such a framework in analyzing debt sustainability for Argentina after its default in 2001 (Cline 2003, Annex A). The primary (noninterest) fiscal surplus needed to keep the debt to GDP ratio from rising, as a fraction of GDP, turned out to be the real interest rate minus the real growth rate, multiplied by the initial ratio of debt to GDP, and all divided by unity plus the real growth rate plus inflation.3 With low real interest rates equal to or less than the growth rate, the principal policy inference has been that public debt is not much of a problem.4 Cline (2021, Appendix A) sets forth the basic equations of the “r − g” debt dynamics.
A major practical problem with such an inference is that, when there are large structural primary deficits, a zero contribution to a rising debt ratio from the standpoint of interest on inherited debt does not suffice to prevent brisk escalation in the debt ratio. A central implication of this fact is that policy initiatives that have the effect of locking in new ongoing primary deficits can cause debt problems even when the interest rate is at or below the growth rate. The discussion of structural primary spending trends below considers the magnitude of the primary deficit problem.
The Long-Term Trend toward Lower Real Interest Rates
Despite the low interest rates in recent years, it would be imprudent to ignore actual levels of real interest rates in recent decades in designing fiscal policy. The best measure of federal borrowing costs is the rate on the 10-year note. Average residual maturity on federal debt has been about 6 years since 2013, about the length that would be expected if all debt were issued with 10-year maturities.5
Measuring the real interest rate is not straightforward. Treasury Inflation-Protected Securities (TIPS) were not introduced until the late 1990s, and data series on 10-year TIPS only begin in 2003. Moreover, TIPS account for only about 9 percent of outstanding debt (CBO, pub. 56165: 6). However, a correct measure of the real interest rate eventually realized on a nominal 10-year note cannot be calculated simply by deducting the inflation rate from the 10-year interest rate for the year of issuance. The reason is that the real interest burden depends on the subsequent time path of inflation in comparison to the steady year-of-issuance nominal interest payments.
I calculate the 10-year RRIR as the internal rate of return on an investment purchased in year 0, paying annually over each of the subsequent 10 years the average coupon rate of 10-year government obligations issued year 0, and returning principal in the 10th year. The stream of return is deflated by the PCE (personal consumption expenditure) price index.6
Figure 1 shows the resulting estimates of RRIR on the 10-year Treasury note, from 1962 through 2011 actual (solid line) and then expected for 2012–2020 (dotted line). (The actual realized rate for the Treasury note purchased in 2015, for example, will not be known until 2025). The expected path for 2012–2020 applies PCE inflation as projected in CBO (pub. 56442).7
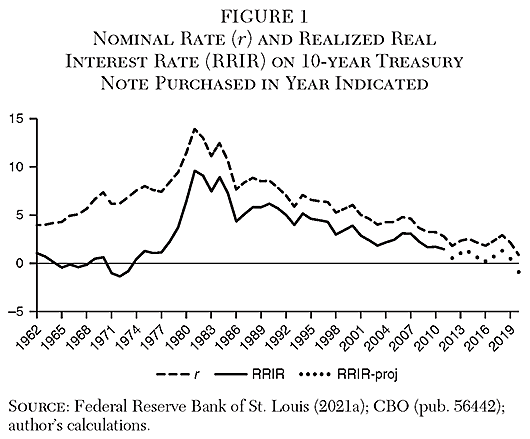
The importance of deflating the stream of payments by actual realized inflation, rather than simply subtracting the current-year inflation rate in the year of issuance to arrive at the real interest rate, is illustrated by both the late 1960s–early 1970s, and the early 1980s. In 1970, for example, the nominal 10-year rate was 7.35 percent. PCE inflation was 4.68 percent. Deducting the current year inflation to arrive at the real rate would yield 2.67 percent as the real rate. However, because of much higher inflation over the years that followed, the realized real interest rate for 10-year notes issued in 1970 turned out to be only 0.63 percent. In contrast, for a 10-year note issued in 1981, the nominal rate was 13.92 percent. PCE inflation in 1981 was 8.96 percent. The naïve real rate calculated as the difference would have been 4.96 percent; the RRIR instead turned out to be 9.59 percent. The slowdown in inflation over the life of the 10-year note meant that the real return was much higher than implied when deflating by inflation in the year of issuance.
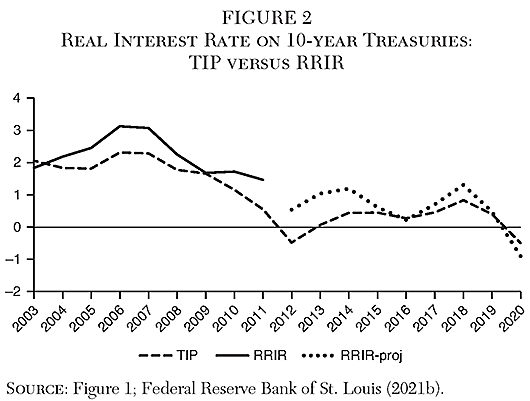
A time series for the Treasury Inflation-Protected (TIP) 10-year rate is available beginning in 2003 (Federal Reserve Bank of St. Louis 2021b). Figure 2 compares the RRIR reported in Figure 1 to the 10-year TIP rate, over the period 2003–2020. In this period, for the subperiod for which the outcome is already known (solid line), the RRIR stood at an average of 2.20 percent, whereas the TIP rate averaged 1.71 percent. On this basis, the TIP may understate the real cost of Treasury borrowing by about 50 basis points. The difference makes sense from the consideration that the TIP is a lower-risk investment than a Treasury note or bond, because it does not have inflation risk.
Identifying a Prudent Benchmark for the Real Interest Rate
Across the full 59 years for estimated realized real interest rates shown in Figure 1, the average RRIR is 2.69 percent; the median is 2.18 percent. Figure 3 shows a histogram of the RRIR estimates, with the number of years as the height of each column, placed into bins of 0.5 percentage point width. The mode is 8 years with RRIR between 1.0 percent and 1.5 percent. The 25th percentile year shows the RRIR at 0.61 percent; the 75th percentile, 4.34 percent. The 33rd percentile RRIR is 1.05 percent.
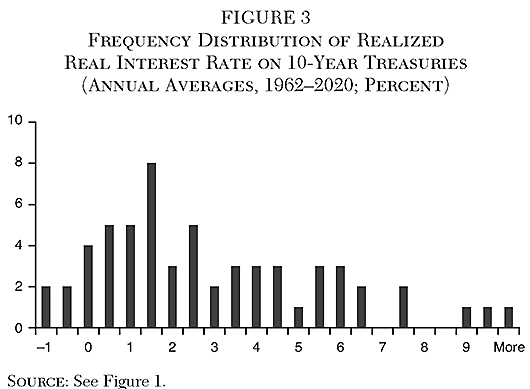
A prudent benchmark for the realized real interest rate for the 10-year note, and thus for federal debt, over the next three decades would be 1 percent, the 33rd percentile for the past six decades. Selecting this threshold takes some account of the persistent downward trend since the early 1980s, while limiting the risk of myopia associated with projecting the most recent experience into the indefinite future. The RRIR for 2020 was −0.9 percent, the third-from-lowest over the 59-year period in Figure 1.
In February 2021, the CBO (pub. 56965) projected that the rate of PCE inflation would be an average of 1.9 percent in fiscal years 2021–2025 and 2.1 percent in FY2026–2030. It projected that the nominal rate on the 10-year Treasury note would average 1.6 percent in FY2021–2025 and 3.0 percent in FY2026–2031. The resulting implied real interest rates would average −0.3 percent in FY2021–2025 and 0.9 percent in FY2026–2030. In the first five-year period, these projections are substantially below a prudential benchmark of 1 percent.
Mind the Primary
Concern about the level of the real interest rate stems from the first element in the “r − g” driver of debt dynamics. The primary (noninterest) fiscal balance needed to keep the debt to GDP ratio from rising, on the left-hand side of the stability equation, equals the existing debt ratio multiplied by “r − g” (interest rate minus growth rate).8 Most of the recent policy discussion has focused on the fact that “r” is low. However, a potentially larger problem is that there is a sizable structural component of the primary deficit.
As shown in Figure 4, from 1962 through 2007 the primary balance was usually only a small deficit or a surplus. The primary deficit exceeded the interest deficit only 13 percent of the time. Moreover, the primary balance was in surplus in 20 of these 46 years, especially in 1995–2001. In contrast, since 2007 the primary deficit has exceeded the interest deficit in all but 2 of the 13 years. The CBO projects that the primary deficit will continue to be larger than the interest deficit for the next 15 years. (Note that, although Figure 4 shows the large surge in primary spending in fiscal 2020 associated with pandemic expenses, its primary spending is understated by about 6 percent of GDP for FY2021 and about 3 percent for FY2022 because it excludes likely spending under the American Rescue Plan Act.)
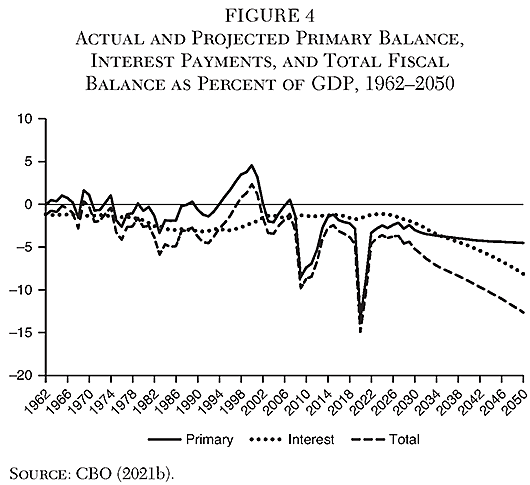
The large primary deficits were unavoidable in 2008–2009 in the face of revenue loss and the need for fiscal stimulus in the Great Recession, and again in 2020–2021 with the Covid-19 shock. However, structural trends have worsened the primary balance and are on track to continue doing so.
As shown in Table 1, mandatory expenditures on social security rose from 4.1 percent of GDP in 2007 to 5.2 percent in 2020 and are projected to reach an average of 6.3 percent of GDP by the 2040s. Mandatory spending on major health programs (mainly Medicare and Medicaid) stood at 4.5 percent of GDP in 2007, rose to 6.6 percent in 2020, and is projected to average 9 percent of GDP by the 2040s. From 2019 to 2050 spending on social security and major health care programs is projected to rise from 10.8 percent of GDP to 17.0 percent, with about half of the increase coming from an aging population and the other half from “excess cost growth” in health care (CBO, pub. 56516: 3).
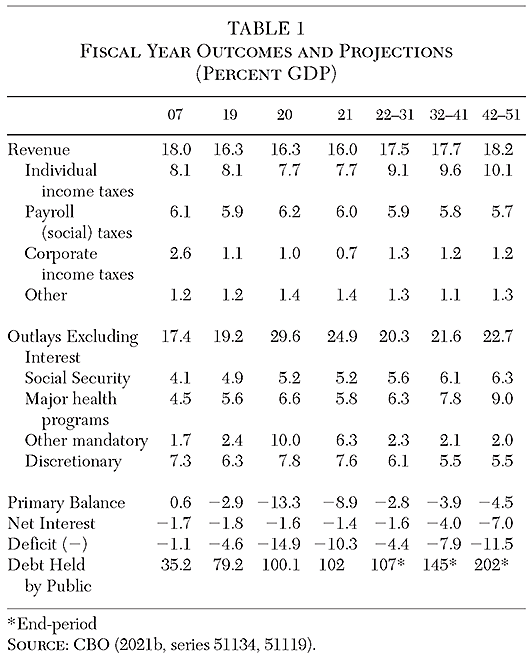
The overall result including other noninterest spending is that the primary balance is on track to swing from a surplus of 0.6 percent of GDP in 2007 to a deficit averaging about 3.5 percent of GDP in the 2020s and 2030s, and 4.5 percent of GDP in the 2040s. In 2000–2019 real growth averaged 2.14 percent (CBO 2021b). Over this period the 10-year RRIR averaged 1.75 percent (Figure 1). The average ratio of debt to GDP was 55 percent (CBO 2021b). Average inflation was 1.84 percent annually (PCE index; Federal Reserve Bank of St. Louis 2021c). So a slight primary deficit (0.21 percent of GDP) would have been consistent with holding the debt to GDP ratio unchanged.9 Instead, the average primary deficit was 2.05 percent of GDP (CBO 2021b).
Going forward, in September 2020 the CBO (pub. 56516) projected average real GDP growth in 2021–2050 at 1.85 percent. Starting from a 2020 debt to GDP ratio of 100 percent, and applying the prudential benchmark of 1 percent for the real interest rate, the primary balance needed to hold the debt ratio constant would be a deficit of 0.8 percent of GDP. Instead, even excluding 2021 because of the pandemic spending surge, the average primary balance is projected by the CBO at a deficit of 3.8 percent of GDP. Compared with the past two decades, the benefit of a reduction in the real interest rate from 1.75 percent to the benchmark 1 percent, or 0.75 percentage point, is more than offset by the increase in the primary deficit from 2.05 percent of GDP to 3.8 percent, or by 1.75 percentage point. The slightly more advantageous race between the real interest rate and growth is swamped by the rise in the primary deficit.
Interest Burden versus Debt Ratio
The heart of the new benign neglect of debt is the proposition that the rise in the ratio of debt to GDP has overstated the rising burden of the debt, because the price of the debt—the interest rate—has fallen. By implication, a measure of debt burden based on interest payments rather than debt is needed.
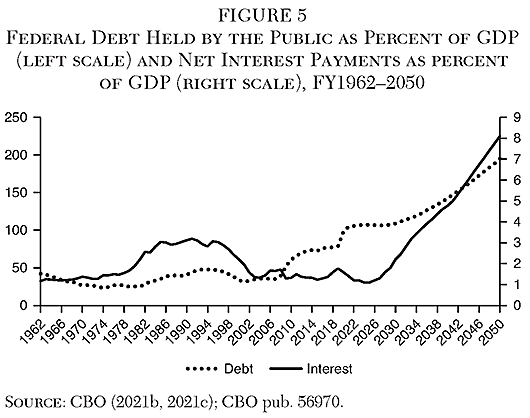
It is certainly true that the path of interest payments as a percent of GDP has been far more benign than the path of debt as a percent of GDP in recent years. Figure 5 shows federal debt held by the public as a percent of GDP on the left axis (dotted line) and net interest payments as a percent of GDP on the right axis.10 Whereas the debt ratio has risen from 25 percent of GDP in 1981 to 79 percent in 2019, 100 percent in 2020, and a projected 102 percent in 2021 (before the $1.9 trillion American Rescue Plan legislation), the interest burden actually fell from a high plateau of about 3 percent of GDP in 1985–1996 to a low plateau of about 1.5 percent of GDP in 2002–2020.
The CBO projections show a further widening of the gap between the debt burden as measured by the ratio of debt to GDP versus interest payments relative to GDP during 2021–2026, thanks to the legacy of debt borrowed at extremely low real interest rates in 2012 and after (see Figure 1 above). However, for the period 2027–2050 the CBO’s projections show a sharp upward turn for the interest ratio, which rises from about 1.6 percent of GDP in 2027–2028 to 8.1 percent by 2050—far above the previous peak of 3.1 percent in 1991. The interest-burden path catches up once again with the debt-ratio path by the early 2040s, and thereafter surpasses it.
Debt Simulations Based on the CBO Long-Term Projections
For debt sustainability analysis, the bottom line is that by 2050 the CBO’s long-term projections indicate a sharp escalation in the burden of debt, whether measured by the ratio of debt to GDP or the ratio of interest payments to GDP. A key question, however, is whether a new normal of “low interest rates forever” would mean that the long-term debt burden would be much lower than that projected by the CBO on either metric.
CBO Long-Term Projections
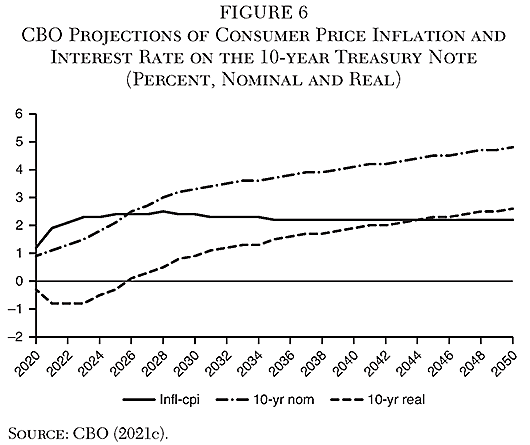
A major influence boosting the interest burden in the CBO’s long-term projections is the rise in the real interest rate. As shown in Figure 6, the real rate on the 10-year Treasury note is placed at about −0.5 percent in 2021–2023, rises above zero only by 2026, but then proceeds to rise steadily, reaching 0.9 percent by 2030, 1.9 percent by 2040, and 2.6 percent by 2050.11 As discussed below, the driving force in the rising long-term real interest rate is the CBO’s modeling in which a rising ratio of debt to GDP causes the real interest rate to rise.
Cline (2021, Appendix C) develops an “accounting” or “direct effects” simulation model to examine the sensitivity of the CBO projections to the interest rate. An economic, as opposed to accounting, model could incorporate feedback from alternative projections of interest rates to alternative levels of GDP, inflation, and primary deficits. The central tests here boost the interest rate above the CBO baseline in the 2020s, but place it lower than that baseline in the 2040s and 2050s. The lesser increase in the interest rate would tend to boost economic growth in the 2030s and 2040s by raising capital investment and output potential, reinforcing the finding below that the CBO estimates may understate the burden by 2030 but overstate it by 2050.
Impact of the Prudential Benchmark Interest Rate
Figure 7 shows the CBO projections of net interest payments as a percent of GDP for 2020–2030 (Panel A) and for the full period 2020–2050 (Panel B) (CBO 2021a, 2021c). The path “sim0” shows the replication of the CBO projections using the model set forth in Cline (2021, Appendix C).12 The first major sensitivity simulation replaces the CBO’s time path of real interest rates with this study’s benchmark 1 percent rate for 2025–2050, with an initial phase-in for 2022–24.13 The nominal rate equals the real rate plus the CBO’s baseline for PCE inflation.14
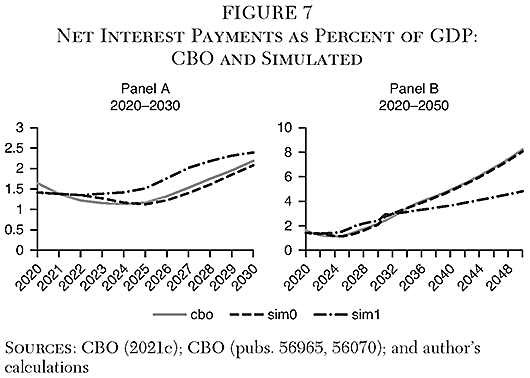
As shown in Figure 7, Panel A, with the return to 1 percent real for the 10-year Treasury note by 2025, net interest payments reach 1.8 percent of GDP by 2026, almost the same as the 1.9 percent average over 1962–2019. The interest burden reaches 2.4 percent of GDP by 2030.
Whereas the prudential 1 percent real interest rate path places the interest burden significantly above the CBO path during the 2020s, by the 2030s and especially 2040s the CBO projections rise above the 1 percent benchmark path, as shown in Panel B. The interest burden reaches 8.2 percent of GDP in 2050. Even if the real 10-year rate is held instead at the prudential minimum of 1 percent real, the interest burden reaches 4.7 percent of GDP by 2050, or 2.5 times as high as the average over the past six decades.
Sensitivity Tests
To examine the influence of the interest rate and the primary balance on the debt burden, Figure 8 shows the paths of the debt to GDP ratio (Panel A) and net interest to GDP ratio (Panel B) under three alternative scenarios for each of these two key variables, resulting in nine (32) cases. The base case—scenario “s11”—is that of the CBO long-term projections, altered by adding $1.9 trillion to pandemic relief spending to the primary deficit in FY2021 (about two-thirds) and FY2022 (the rest).15 As shown in Table 1 above, the primary deficit stood at 2.9 percent of GDP in FY2019 but surged to 13.3 percent in 2020 from pandemic relief spending and revenue loss. For 2021, without additional relief spending the primary deficit was to fall to 8.9 percent of GDP. Setting the new baseline to include an extra $1.9 trillion spending, the primary deficit would instead reach 14.6 percent of GDP in FY2021 and 6.6 percent in FY2022.16
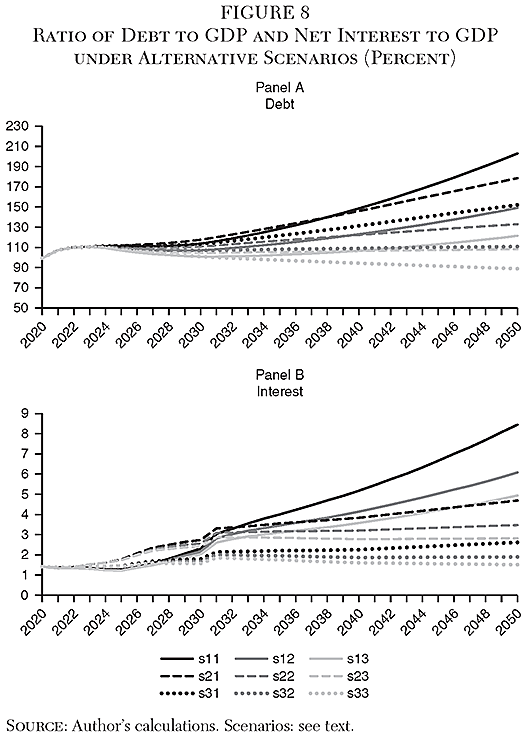
For each of the other scenarios (“s”), the first digit refers to the interest rate and the second refers to the primary balance. For the first digit (interest rate), “1” refers to the CBO baseline; “2” indicates the prudential benchmark 1 percent real interest rate; and “3” refers to a real interest rate of zero. For the second digit (primary balance), “1” refers to the CBO baseline, “2” refers to a primary deficit of 2 percent of GDP (the average outcome in 2000–2019), and “3” refers to a primary deficit of 1 percent of GDP.17 In Figure 8, the solid lines refer to case 1 (CBO) for the interest rate path; the dashed lines, case 2 (real interest rate at 1 percent by 2025 and after); and the dotted lines, case 3 (real interest at zero by 2025 and after). Table 2 reports the results of the simulations for 2020, 2021, 2025, 2030, 2040, and 2050.18
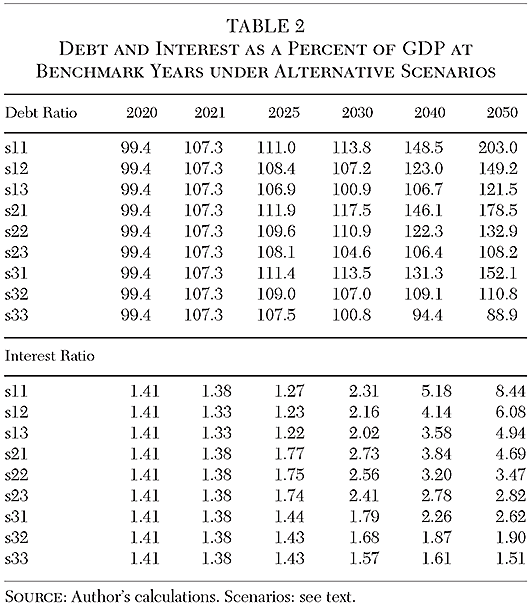
The broad picture that emerges from the simulations is that the debt burden is on a rising long-term path, whether measured by the debt to GDP ratio or the ratio of interest payments to GDP. Only the most extreme favorable case (s33) shows the debt ratio lower in 2050 than at present. For the interest/GDP metric, all of the scenarios except the two most favorable (s32, s33) show the burden higher by 2050 than the average 1.9 percent over the past six decades. A moderately optimistic variant of the “prudential interest rate benchmark” case (1 percent real interest rate, 2 percent of GDP primary deficit, case s22) still leaves the interest burden at 3.5 percent of GDP by 2050.
The results do show a strong influence of controlling the primary balance on curbing the long-term explosion of the debt ratio and the interest ratio. In the CBO baseline (adjusted to include the American Rescue Plan, case s11), the average primary balance in 2022–2050 is a deficit of 3.9 percent of GDP. When the CBO interest rates are unchanged but the primary deficit drops to 2 percent of GDP (case s12), by 2050 the debt ratio reaches only 149 percent of GDP instead of 203 percent. If the primary deficit is cut further to 1 percent of GDP, again with no change from the CBO interest rate path (case s13), by 2050 the debt ratio is only 122 percent. A principal message of the simulations is thus that curbing the primary deficit will be needed to curb the debt burden over the longer term.
As shown in Panel B of Figure 8 (as well as Figure 7 above), another key message is that the low ratio of interest payments to GDP in 2021–2025 is a transitory phenomenon that depends heavily on the CBO’s assumption of negative real rates until 2025. The recently popular view that low interest rates mean policymakers do not need to worry about rising debt implicitly endorses the CBO’s near-term projections but ignores the CBO’s longer-term projections.
Impact of Rising Debt on the Interest Rate
The prevailing nonchalance about debt thanks to near-zero real interest rates implicitly assumes either that there is no influence of rising debt on the interest rate the government must pay, or that the long-term forces that have reduced the rates will strengthen and reduce rates further by enough to offset a rise in rates that could be expected from rising debt. However, leading quantitative estimates suggest that further rate reductions by secular forces are likely to be far smaller than the upward pressure on rates if the debt rises by anywhere near as much as the CBO long-term projections indicate.
Gamber (2020: 26, 39, 49–50) summarizes these opposing forces in the CBO model as follows. Declining labor force growth reduces the marginal product of capital and the interest rate. A rising domestic and foreign saving rate increases the supply of saving and drives down the interest rate. Falling total factor productivity growth reduces the return to capital and the interest rate. A rise in the risk premium, or rising preference for safe assets, reduces the interest rate the government needs to pay on borrowing. Against these forces, however, a rise in the ratio of public debt to GDP boosts the rate the government must pay. In addition, a rise in the capital share of income raises the rate of return to capital and the interest rate. Table 3 shows the impact parameter for each of these influences, and indicates the contribution of each one to the change from a base period of 1995–2004 to either 2032–2035 or 2046–2050.
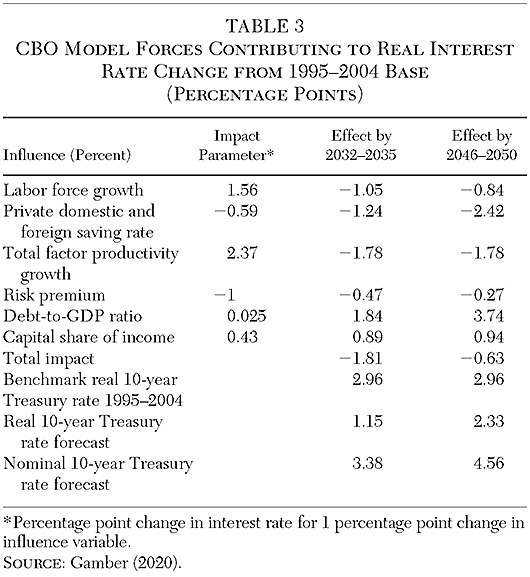
The largest secular force reducing the interest rate is estimated to be the rising saving rate, from a 1995–2004 benchmark of 21.9 percent to 24 percent by 2032–2035 and 26 percent by 2046–2050.19 The rise in middle-aged workers relative to younger workers has increased the share of the labor force in the phase of high saving for retirement, and increasing lifespans increase the needed saving rate. Moreover, a slowdown in expected income growth has reduced the “time preference” discount rate.20 The higher saving rate reduces the real interest rate by 1.24 percentage point from benchmark by 2032–2035 and by 2.42 percentage point by 2046–2050. Next is total factor productivity growth, which was 1.86 percent annually in the benchmark period but is projected at 1.11 percent in both of the forecast periods.
The slowdown in productivity growth reduces the interest rate by 1.78 percentage point. The other large contributor to the falling interest rate is the slowdown in labor force growth, from 0.95 percent annually in 1995–2004 to 0.28 percent by 2031–2035, but which partially recovers to 0.41 percent by 2046–2050. The four negative secular forces on interest rates (including risk premium) add up to a reduction from the benchmark interest rate by 4.54 percentage points by 2032–2035. By 2046–2050, their combined interest-reducing force reaches 5.31 percentage points.
There is a large countervailing source of upward pressure on the interest rate from the large increase in the ratio of debt to GDP, however. As set forth in Cline (2021, Appendix D), a standard “Cobb-Douglas” model of production indicates that, if the capital stock is reduced, the marginal product of capital will rise, driving up the interest rate. Fiscal deficits that divert saving away from private investment will have this effect. With this effect represented by the ratio of public debt to GDP, Gamber and Seliski (2019) find that a rise in debt by 1 percent of GDP boosts the 10-year Treasury rate by 2.5 basis points, based on a review of literature as well as new statistical estimates. Rachel and Summers (2019a: 22) place this impact even higher, at 3.5 basis points as their inferred consensus estimate in the literature.21
Gamber (2020: 49) places the average benchmark (1995–2004) debt ratio at 38 percent of GDP, and cites the CBO (pub. 56516) projections of an average of 112 percent in 2032–2035 and 188 percent in 2046–2050. Applying the impact parameter of 2.5 basis points per percentage point in the debt ratio, the effect of rising debt is to boost the interest rate above the benchmark by 1.84 percentage point in 2032–2035 and by 3.74 percentage points in 2046–2050. The other influence raising the rate is the rise in the capital share, which shows the responsiveness of output to additional capital.22 An increase in this share from 33.2 percent in the benchmark period to 35.26 percent in 2032–2035 and 35.38 percent in 2046–2050 contributes an additional 0.89 percentage point to the interest rate in the first forecast period and 0.94 percent in the second.
By 2032–2035 the CBO projects the net effect of the secular changes to reach −1.81 percentage point change in the real 10-year rate from the 1995–2004 benchmark. By 2046–2050 the further increment in the positive change from the rising debt ratio and capital share exceeds the further reduction from the four negative secular forces, reducing the net change from benchmark to −0.63 percentage point. With the benchmark real rate at 2.96 percent, the real 10-year rate stands at 1.15 percent by 2032–2035 and 2.33 percent by 2046–2050.
A major question in the estimates of secular trends is the extent to which interest rates in the 2010s were only temporarily low because of the long shadow of the Great Recession. Gamber (2020: 13) notes estimates indicating that the three episodes of quantitative easing reduced the 10-year Treasury rate by about 100 basis points. Gauti Eggertsson has argued that the secular trend estimates are quite sensitive to assumptions, and that a plausible alternative to a secular stagnation hypothesis (constant shortfall of private investment demand from private saving supply) is the view that “the fall observed in natural rates is only temporary and due to the global financial crisis and its aftermath.”23 Indeed, Summers (2021) has argued that the stimulus of the American Rescue Plan was so large that it could raise inflationary pressures and interest rates (and by implication, real interest rates).
Overall, the Gamber (2020) estimates judge that the near-zero real interest rate in recent years has been a temporary phenomenon because upward pressure on the interest rate from rising public debt will swamp further downward pressure from demographic, productivity, and other secular factors. He moreover hints that unbridled increases in the debt ratio as in the CBO long-term baseline could begin to add a sovereign-default risk premium to the rate demanded by investors.24
Incorporating Feedback from Debt to the Interest Rate
A major implication of the main calculations in Table 2 and Figure 8 above is that, if even a moderate floor of 1 percent is set for the real 10-year Treasury rate, the idea that looking at the interest burden instead of the debt burden makes the debt problem disappear is misguided. Yet more specific attention to the influence of the debt ratio on the interest rate suggests that the prudential 1 percent real rate used in this study could well err on the low side.
In Cline (2021, Appendix D), I find that, at the present level of the capital/output ratio (3.43), the impact of a 1 percentage point increase in the debt to GDP ratio on the interest rate would be 1.88 basis points with complete crowding out, or 0.94 basis points with 50 percent crowding out. Figure 9 shows what happens to the debt/GDP and interest/GDP projections if, in addition to setting a prudential floor of 1 percent for the real interest rate, the calculations incorporate such a feedback to the interest rate, assuming 50 percent crowding out. In particular, in the main projection scenario s21, debt held by the public rises by 67 percentage points of GDP from 2025 to 2050. Such an increase would cause the real interest rate to rise from the prudential benchmark 1 percent to 1.63 percent.
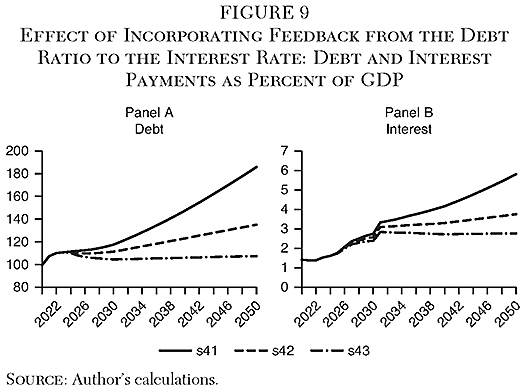
Figure 9 shows the results of incorporating feedback from the debt ratio to the interest rate. The first scenario digit, “4,” refers to this incorporation in addition to the projections of the main scenario of this study (“s2”). As before, the second digit refers to the primary deficit (1 = baseline, 2 = ceiling of 2 percent of GDP, 3 = ceiling of 1 percent of GDP). As shown in Figure 9, adding feedback from the debt ratio to the interest rate boosts the debt ratio by 2050 from 178 percent of GDP (s21 in Figure 8 and Table 2) to 186 percent (s41), and correspondingly raises the interest/GDP ratio from 4.7 percent to 5.8 percent. Although the qualitative finding of a baseline less severe than that projected by the CBO would remain unchanged, the finding of a major increase in both the debt and interest burden despite the recent comfort from low interest rates would be sharpened further. The figure also shows once again the strong influence of cutting the primary deficit on achieving greater fiscal sustainability on both the debt/GDP and interest/GDP metrics.
Reconsidering Debt Targets
A central policy question is whether traditional fiscal targets should be changed to take account of lower interest rates. The predominant fiscal target framework for advanced economies has been the Maastricht criteria, adopted in February 1992 by the European Monetary Union (INSEE 2021).
Maastricht Mutatis Mutandis
The Maastricht criteria set a target of no more than 60 percent of GDP for the ratio of public debt to GDP, and a parallel target of a fiscal deficit no more than 3 percent of GDP. Implicitly these targets represented a normal state in which the nominal interest rate would be something like 5 percent, the real growth rate 3 percent, and the inflation rate 2 percent. Under these conditions, and with the primary balance at zero, nominal debt would grow at 5 percent (the interest rate). Nominal GDP would also grow at 5 percent (real growth plus inflation), so the debt ratio would remain unchanged. For its part, the fiscal deficit would also remain unchanged at 3 percent of GDP, because the 5 percent interest rate applied to the debt at 60 percent of GDP would generate a deficit of 3 percent of GDP. With the interest rate equal to the growth rate, the debt ratio would remain unchanged with a primary balance of zero (the “r − g” condition).
In the actual circumstances of the time, the three fiscally best-performing EMU economies (Germany, France, and the Netherlands) had the following average outcomes in the 6 years leading up to Maastricht (1986–1991): real growth, 3.38 percent; inflation, 2.04 percent; and government long-term interest rate, 7.85 percent.25 So the real interest rate stood at about 5.8 percent. Holding the debt ratio at 60 percent of GDP would have required primary surpluses amounting to 1.54 percent of GDP.26
It is informative to consider the U.S. fiscal experience against the Maastricht criteria. As shown in Figure 10, the debt ratio remained comfortably below 60 percent of GDP for the half-century preceding the Great Recession (Figure 5 above). However, the Great Recession boosted debt from 35 percent of GDP in 2007 to 61 percent in 2010, and the combination of the tax cuts in the Trump administration and the Covid-shock recession brought the debt ratio to 100 percent of GDP at the end of fiscal 2020. For their part, fiscal deficits reached successive recession-cum-stimulus peaks at 5.9 percent of GDP in 1983, 8.7 percent in 2008, and 14.9 percent in 2020 (likely to be followed by an even larger deficit in 2021).
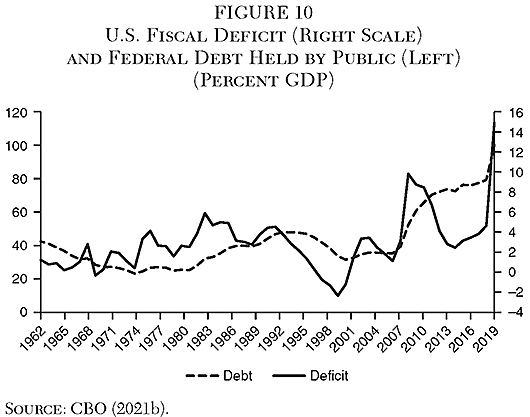
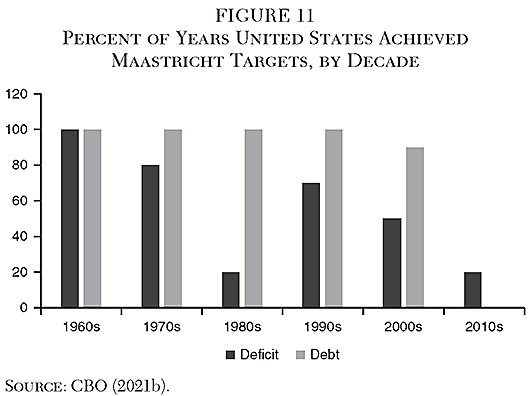
Figure 11 shows the corresponding percent of years in each of the past six decades that the United States has met Maastricht fiscal targets. The debt target was fully met in the first four decades, 90 percent met in the aughts, but completely missed in the 2010s (from 2011 to 2020). In the 2010s the deficit target was met in only 2 of 10 years, the same outcome as in the 1980s.
If one recognizes the long-term decline in interest rates but adopts a prudential benchmark of 1 percent for the real 10-year Treasury rate (the 33rd percentile in the distribution over the past six decades), a mutatis mutandis adjustment of Maastricht fiscal targets might be as follows. Considering that the median RRIR was 2.2 percent over the past six decades, and under a main premise that the burden of debt is proportionate to the real interest rate, a first approximation shift in the debt target would be to 132 percent of GDP (= 60 / [1/2.2]). This approach could risk erring on the side of an excessive debt ceiling, however, because as the real interest rate approaches zero it would imply that the ratio of debt to GDP can safely reach infinity. Yet an infinite debt ratio is almost certainly associated with an infinite probability of debt default because rollover becomes impossible.
A similar parametric shift for the Maastricht fiscal deficit ceiling might be as follows. If the benchmark real interest rate declined by 1.2 percentage point (from median 2.2 percent to prudential floor 1.0 percent), by implication the increase in the inflationary “water” in the interest burden amounts to 1.2 percentage point. So a ceiling of 3 percent of GDP for the deficit could arguably be boosted to 4.2 percent of GDP deficit ceiling. Such a target would have been met 50 percent of the time in the 2010s instead of only 20 percent (Figure 10). The deficits projected by the CBO (pub. 56977) would come close to meeting such an amended Maastricht target in the 2020s, but would far exceed this target in the 2030s and 2040s (Table 1 above).
In the simulations shown in Figure 8 above and summarized in Table 2, the baseline using a prudential 1 percent real interest rate (scenario s21) yields debt and interest burdens that would exceed these adjusted Maastricht targets. By 2050, debt reaches 178 percent of GDP. Interest reaches 4.7 percent of GDP, and adding the CBO’s baseline 2050 primary deficit of 4.5 percent of GDP would place the fiscal deficit at 9.2 percent of GDP. The adjustment path of s22, limiting the primary deficit to 2 percent of GDP (compared to the average of about 4 percent over 2022 to 2050 in the CBO baseline), would approximately meet the adjusted-Maastricht debt target (the debt ratio would reach 133 percent in 2050) but not the adjusted deficit target (the deficit in 2050 would stand at 5.5 percent of GDP, comprising 2 percent primary and 3.5 percent interest). The more aggressive adjustment path of s23, cutting the primary deficit to 1 percent of GDP, would decisively meet the adjusted debt target (holding debt to 108 percent of GDP in 2050) and would also meet the adjusted fiscal target (yielding a 2050 deficit of 3.8 percent of GDP, from 1 percent primary plus 2.8 percent interest).
Alternative “Real” Metrics
Furman and Summers (2020) have suggested that only the “real” interest burden should be considered in designing an interest-burden metric. They define real interest as nominal interest minus inflationary erosion of debt. This erosion is calculated as the current year’s inflation rate multiplied by the debt stock at the end of the previous year. This numerator, nominal interest minus real debt erosion, is then divided by nominal GDP. This metric will be designated FSRIR (Furman-Summers Real Interest Ratio) in the following discussion.
Furman and Summers (2020) argue that the usual measure of the debt burden, the ratio of debt to GDP, errs by comparing a stock in the numerator to a flow in the denominator. They observe that converting GDP to a stock would require calculating the present discounted value of future GDP, essentially a chimeric task. Yet they make a key exception to their case against considering debt stock by including real erosion of the stock by current-year inflation. However, their preference for a real flow measure implies they should instead only give credit for this year’s realized debt erosion—namely, erosion of the debt actually repaid this year in amortization. Moreover, a real flow measure should then deflate not only the numerator but also the denominator, comparing real annual debt service to real annual GDP.
The FSRIR measure of the debt burden can be extremely volatile.27 Moreover, it shows the change for a single year, rather than the ongoing potential burden of the debt. Indeed, by this measure, not only will the U.S. public debt burden be lower in 2022 than it was in 2019, it will be negative, falling from 0.39 percent of GDP to −0.6 percent of GDP. Yet the Covid-19 shock added about 30 percent of GDP to the ratio of debt to GDP (including the American Rescue Plan of 2021). The measure is thus highly misleading at present and gives undue comfort to running up even more debt.
The FSRIR fails to capture the lingering burden when large amounts of new debt and maturing old debt need to be refinanced in the future at more normal interest rates. One root problem is that negative real interest rates tend to reflect pathological economic conditions. In the 1970s the illness was high inflation; in the 2010s it has been abnormally low interest rates in the long aftermath of the Great Recession followed by the Covid-19 shock. Another root problem is that the metric does not include the new debt from primary deficits in the current year, a serious omission at present.
Technical issues with the FSRIR include the following. First, by seeking a “real” value for the interest burden numerator while applying a nominal value to the GDP denominator, the measure double-counts inflationary debt relief. It not only deducts inflationary erosion of the stock in the numerator, but also further shrinks the burden by allowing inflation to balloon the denominator (rather than using real GDP in the denominator). Second, the FSRIR mixes stock adjustment in the numerator with flow in the denominator. Yet conflating stocks and flows is one of the critiques Furman and Summers raise in questioning the meaning of the debt to GDP ratio, the usual metric of debt burden, because debt is a stock and GDP is a flow.
Third, even if the FSRIR is used as the metric, the Furman-Summers policy ceiling for it at 2 percent was reached in only two years out of the past six decades (1986 and 1998; calculated from CBO 2021b). The median was 0.60 percent of GDP, and the average, 0.67 percent. The prudential approach used in this study for the real interest rate itself, the 33rd percentile of the annual outcomes over that period, would imply setting the allowed ceiling for the real interest burden measure to the 67th percentile. That level turns out to be 1.07 percent of GDP. In the adjusted CBO baseline (s11 above), the Furman-Summers real interest burden measure reaches 0.98 percent of GDP by 2029, 1.23 percent by 2030, 3.78 percent by 2040, and 6.54 percent by 2050. The prudential threshold on this measure would be exceeded by 2029, and the measure would reach more than twice even the Furman-Summers 2 percent ceiling by 2040 and more than three times that ceiling by 2050.
I propose an alternative “real” measure of the debt burden: the ratio of real debt service (interest plus amortization) to real GDP. This Real Debt Service Ratio (RDSR) measure does not deduct this year’s inflation multiplied by the entirety of last year’s debt. Indeed, it does not subtract anything; instead, it deflates everything to constant real values.28 Figure 12 shows this measure over the past six decades, on the left scale.29 In comparison, the figure shows the FSRIR on the right scale.
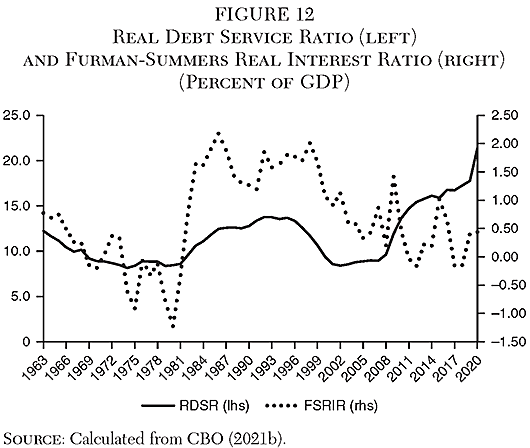
The real debt service ratio shows far less volatility than the Furman-Summers Real Interest Ratio. By construction, it shows no instances of negative debt burden. The RDSR does tend to follow the FSRIR with a lag, up until about 2014. Thereafter the two measures diverge. By the late 2010s, the sharp rise in debt (Figure 5 above) tends to weigh substantially on amortization and thus the RDSR, while providing a larger base upon which inflationary erosion of debt reduces the FSRIR.
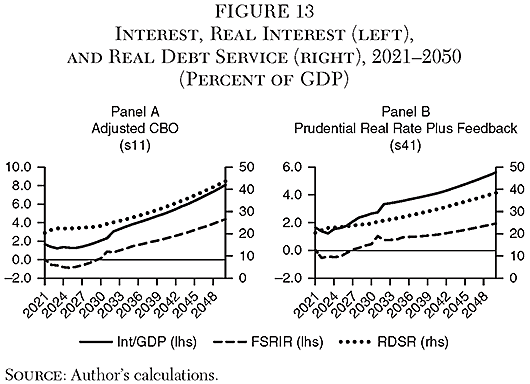
Going forward, the two alternative real metrics broadly parallel the path of the main metric used in this study, the ratio of nominal interest payments to nominal GDP. In Figure 13, Panel A shows these three measures for the (adjusted) CBO (s11) baseline projections. Panel B shows the corresponding projections for case s41 above, constraining the real interest rate to 1 percent plus feedback from the rising debt ratio to the interest rate. Especially for 2033 to 2050, the three alternative measures show similar sharp upward trends in the debt burden, reflecting the high path of primary deficits in the CBO baseline. Attention to the “real” interest rate, or real debt-service ratio, does not change the qualitative diagnosis provided by the main metric of this study.
Conclusion and Policy Implications
Despite the low interest rates of recent years, there is no fiscal free lunch forever. Although the low rates warrant taking the interest burden into account in addition to the debt burden in designing fiscal policy, a prudent benchmark for the real interest rate at 1 percent yields debt paths (and interest burden paths) that are well above past averages by 2030 and reach extremely high levels by 2050. Yet 1 percent is arguably a prudential floor, as it is the 33rd percentile of the real rate on the 10-year Treasury note over the past six decades based on the ex post RRIR measure developed in the first section of this study.
A fundamental analytical problem with nonchalance about rising debt ratios on grounds of low interest rates is that there are strong theoretical and empirical reasons to think that a rising ratio of debt to GDP causes an increase in the interest rate, making the combination of permanently low rates alongside ever-rising debt ratios an oxymoron (barring a fully offsetting further deepening of secular trends bringing rates down).
A more prosaic yet central problem with a benign neglect of dramatically rising debt ratios is that the analytical construct that has popularized the downplaying of debt—the “r − g” dynamics—assumes away debt problems caused by large primary deficits rather than high interest rates or low growth. The implicit argument is that if the interest rate (r) is not much higher than the growth rate (g), the debt to GDP ratio can always be stabilized by swinging the primary deficit to a surplus equal to the difference between r and g. But reducing the primary deficit from its prospective long-term path of 3 to 5 percent of GDP to zero—or even a deficit of 1 or 2 percent of GDP—will be a major political challenge, especially in an environment in which there is a broad-based demand for more rather than less spending for social, anti-poverty, infrastructural, and environmental purposes. A direct implication is that increases in such “permanent” spending categories should be paid for through permanent revenue increases rather than by additional borrowing.
An exercise adjusting the 1990s Maastricht fiscal targets to fit the benchmark 1 percent real interest rate boosts the permissible debt ceiling from 60 percent to 132 percent of GDP, and raises the fiscal deficit limit from 3 percent to 4.2 percent of GDP. The central simulations show that, with the 1 percent real interest rate, it would be necessary to limit the primary deficit to 1 percent of GDP to meet both of these targets, far below the CBO’s baseline average of about 4 percent during 2022 to 2050. Consideration of real interest and real debt service measures of the debt burden does not change the long-term implications from the findings based on the ratio of nominal interest to nominal GDP.
An ultimate challenge is that, in the absence of reducing prospective primary deficits, perceived default risk could eventually begin to raise the cost of federal borrowing. The hypothetical ability to inflate away debt rather than default because the debt is denominated in U.S. currency is no guarantee against perceived default risk if investors judge that the potential inflation needed would be politically unacceptable.
References
Blanchard, O. (2019) “Public Debt and Low Interest Rates.” American Economic Review 109 (4): 1197-229.
Cline, W. R. (2003) “Restoring Economic Growth in Argentina.” World Bank Research Working Paper No. 3158. Washington: World Bank.
__________ (2014) Managing the Euro Area Debt Crisis. Washington: Peterson Institute for International Economics.
__________ (2021) “U.S. Debt Sustainability under Low Interest Rates and after the Covid-19 Shock.” Economics International Inc. Working Paper No. 21–01 (June).
Committee for a Responsible Federal Budget (2021) Analysis of CBO’s March 2021 Long-Term Budget Outlook. Washington: CRFB.
Congressional Budget Office (CBO) (2021a) The Budget and Economic Outlook: 2021 to 2031. Washington: CBO (February).
__________ (2021b) Budget and Economic Data. Washington: CBO (February).
__________ (2021c) The 2021 Long-Term Budget Outlook. Washington: CBO (March).
Engen, E. M., and R. G. Hubbard (2005) “Federal Government Debt and Interest Rates.” In M. Gertler and K. Rogoff (eds.), NBER Macroeconomics Annual 2004, Vol. 19, 83–138. Cambridge, Mass.: MIT Press.
Federal Reserve Bank of St. Louis (2021a) “10-Year Treasury Constant Maturity Rate (DGS10).” St. Louis: FRED (January).
__________ (2021b) “10-Year Treasury Inflation-Indexed Security, Constant Maturity (DFII10).” St. Louis: FRED (January)
__________ (2021c) “Capital Stock at Constant National Prices for United States” (RKNANPUSA666NRUG). St. Louis: FRED (February).
Friedman, T. (2021) “Capitalism and Socialism, American-Style.” New York Times (January 27).
Furman, J., and L. Summers (2020) “A Reconsideration of Fiscal Policy in the Era of Low Interest Rates.” Available at www.piie.com/system/files/documents/furman-summers2020-12–01paper.pdf.
Gamber, E. N. (2020) The Historical Decline in Real Interest Rates and Its Implications for CBO’s Projections. Congressional Budget Office Working Paper No. 2020-09. Washington: CBO.
Gamber, E. N., and Seliski, J. (2019) The Effect of Government Debt on Interest Rates. Congressional Budget Office Working Paper No. 2019-01. Washington: CBO.
Goodhart, C., and M. Pradhan (2020) The Great Demographic Reversal: Ageing Societies, Waning Inequality, and an Inflation Revival. London: Palgrave Macmillan.
INSEE (Institut National de la Statistique et des Études Économiques) (2021) “Convergence Criteria” (Maastricht Treaty). Paris: INSEE.
International Monetary Fund (IMF) (1992) International Financial Statistics Yearbook. Washington: IMF.
__________ (2021) Fiscal Monitor Update 2021. Washington: IMF.
Krugman, P. (2021) “Four Rules That Should Guide Bidenomics.” New York Times (January 15).
Laubach, T. (2009) “New Evidence on the Interest Rate Effects of Budget Deficits and Debt.” Journal of the European Economic Association 7 (4): 858–85.
Mankiw, N. G. (2020) “The Double-Edged Sword of Low Interest Rates.” New York Times (December 6).
Rachel, L., and Summers, L. H. (2019a) “On Falling Neutral Real Rates, Fiscal Policy, and the Risk of Secular Stagnation.” Brookings Papers on Economic Activity (March): 1–68. BPEA Conference Drafts, March 7–8.
__________ (2019b) “On Secular Stagnation in the Industrialized World.” Brookings Papers on Economic Activity (Spring): 1–54.
Ramsey, F. P. (1928) “A Mathematical Theory of Saving.” Economic Journal 138 (52): 543–59.
Summers, L. H. (2021) “The Biden Stimulus Is Admirably Ambitious. But It Brings Some Big Risks, Too.” Washington Post (February 4).
Yellen, J. (2021) “Finance Committee Questions for the Record.” U.S. Senate Committee on Finance. Available at www.finance.senate.gov/hearings/hearing-to-consider-the-anticipated-nomination-of-to-be-the-honorable-janet-l-yellen-to-secretary-of-the-treasury.
Notes
1 The IMF (2021: 3) estimates that the assistance legislated in March and April of 2020 amounted to $3.1 trillion (14.8 percent of GDP). Another $900 billion in federal spending was legislated in December 2020, and an additional $1.9 trillion in March 2021, for a total of $5.9 trillion, or 26.9 percent of estimated 2021 GDP.
2 As discussed below, the CBO projects lower real interest rates in the 2020s but higher rates in the 2030s and especially the 2040s, yielding an interest burden of 8.1 percent of GDP by 2050.
3 The formulation for Argentina added a term for depreciation of the currency multiplied by the share of debt in foreign currency. A decade later I set forth a similar formulation in examining the euro area debt crisis (Cline 2014: 39–40).
4 Blanchard (2019: 1197) provided a particularly influential analysis to this effect: “Put bluntly, public debt may have no fiscal costs.”
5 CBO (pub. 56165: 8–9). If all debt were originally 10-year maturity, and if outstanding debt were constant, average residual maturity would be 5 years. With rising debt, the average residual maturity is longer. Note however that average residual maturity fell as low as 4 years in 2008 because of heavy borrowing in Treasury bills in the Great Recession (p. 8). CBO publications identified by their five-digit numbers can be accessed at www.cbo.gov/publication/, followed by their number. For detailed titles, see Cline (2021: 39–40).
6 Thus, the real interest rate r* is calculated as:

where “IRR” is the internal rate of return (equating present value to zero), r is the nominal coupon interest rate (expressed as a fraction), t is the year, and p is the price index normalized to unity in the year of purchase. (The Excel function IRR is used in this calculation.)
7 See footnote 5 for accessing CBO publications by their numbers.
8 More precisely, the initial coefficient is the existing debt ratio divided by unity plus the inflation rate plus the growth rate.
9 See Cline (2021, Appendix A, equation A5).
10 Data are from CBO (2021b, series 51134) for 1962–2019; CBO (2021a) for 2020–2031; and CBO (2021c) for 2032–2050.
11 Note that the real rate in Figure 5 deflates using the consumer price index and so is about 30 basis points lower than the real rate deflating by the PCE index (as in Figure 1).
12 These projections take account of the $900 billion pandemic relief legislation of December 2020 but not the pending $1.9 trillion American Rescue Plan Act (CBO 2021b).
13 The real rate is set at 0.25 percent in 2022, 0.5 percent in 2023, and 0.75 percent in 2024.
14 For 2041–2050 only consumer price inflation is available in the CBO projections. In this period the nominal rate is set at the rate of CPI inflation plus unity minus 0.29 percentage point (the average annual excess of CPI inflation over PCE inflation in the 2020–2030 projections).
15 The CBO estimates that 64 percent of the $1.9 trillion American Rescue Plan would be spent in FY2021, another 22 percent in FY2022, and the remainder spread over the next six years (CBO, pub. 57012).
16 The CBO’s February and March projections (CBO 2021a, 2021c) provide the basis for s11. In July the CBO (pub. 57263) issued updated projections showing higher growth and revenue and incorporating the American Rescue Plan. The update shows a lower path for the debt/GDP ratio than scenario s11 in Table 2 (106.4 percent by 2031 instead of 113.8 percent by 2030) but a higher path for the interest/GDP ratio (2.7 percent versus 2.31 percent, respectively). The diagnosis of a sharp increase in debt from the pandemic shock remains unchanged.
17 The changes are phased in from 2022 to 2025 for the real interest rate and 2024 to 2025 for the primary deficit.
18 For 2020, s11 estimates (Table 2) are slightly lower than the actual outcomes (100.1 percent for the debt ratio and 1.64 percent for the interest ratio: CBO 2021a).
19 In contrast, Goodhart and Pradhan (2020: 132, 135) argue that demographic change in advanced economies will reduce saving as households count on old-age benefits rather than increasing their life-cycle savings for greater longevity, and as health costs of an older population rise. Combined with lower global saving from especially an aging China, and with little rise in public saving, the consequence will be rising real long-term interest rates.
20 The classic Ramsey (1928) discount rate equals the rate of “pure” time preference for myopia plus the product of the elasticity of marginal utility and the expected growth rate of income.
21 Engen and Hubbard (2005) and Laubach (2009) have found that, from the late 1970s through the early 2000s, an increase in the CBO’s projected ratio of federal debt to GDP by 1 percent of GDP induced an increase of about 3 to 4 basis points in forward long-term interest rates.
22 In the Cobb-Douglas function, the capital share is the “output elasticity,” or proportionate responsiveness, to capital.
23 Comment on Rachel and Summers (2019b: 58).
24 “Projections of such levels of debt raise the possibility that rates could go much higher than CBO forecasts if investors began to have doubts about the ability or the willingness of the pubic to meet significantly higher debt-service obligations or of the Federal Reserve to keep inflation near its 2 percent target” (Gamber 2020: 21).
25 Calculated from IMF (1992, 2021).
26 Applying equation A5 from Cline (2021, Appendix A). But Germany came relatively close to a nominal interest rate of only 5 percent in 1986–1988, averaging 5.9 percent (IMF 1992).
27 Thus, in 1980 interest payments were 1.9 percent of GDP, but inflation was 13.6 percent. Debt at the end of 1979 had been 25 percent of GDP, causing inflationary erosion to exceed interest payments and placing the FSRIR at −1.2 percent of GDP. In contrast, following the “Volcker shock” to interest rates in 1981, by 1983 the FSRIR rose to 2.2 percent of GDP (see Figure 12).
28 The measure is RDSRt = [(intt + amzt)/pc,t]/[Yt/pY,t] where RDSR is the real debt service ratio, int is interest payments, amz is amortization, Y is nominal GDP, pc is the consumer price index, pY is the GDP deflator price index, and t is the year.
29 Annual amortization data are not available. Amortization is estimated as 20 percent of prior-year debt outstanding.

This work is licensed under a Creative Commons Attribution-NonCommercial-ShareAlike 4.0 International License.