Two hundred forty-five years after the publication of Adam Smith’s An Inquiry into the Nature and Causes of the Wealth of Nations, economists continue to debate the causes of disparities in wealth among the countries of the world. Some scholars focus on the role of climate, natural resources, proximity to markets, or access to technology. Others study human capital, capital accumulation, the use of comparative advantages and economies of scale, and institutional and legal frameworks. We believe that another factor must be considered as well: the economic attitudes and causal beliefs (henceforth, “mentality”) of the population. While a growing body of research shows a clear association between economic growth and the institutions of economic freedom, those institutions can be quite fragile if the population does not have a clear understanding of what makes a country prosperous. To measure popular attitudes toward economic values, we have created the Global Index of Economic Mentality (GIEM).
Everyone has ideas and assumptions about how an economic system works best. At one extreme are those who think that the market should operate in a decentralized manner and that the free action of economic agents maximizes the generation of goods and services and promotes growth. In their opinion, individuals are motivated by the benefits they expect from their activities and therefore try to produce goods and services that consumers want. The role of the government is to provide a set of rules that facilitate competition and exchange, thus ensuring that the factors of production are used efficiently. In that framework, there is limited room for state action, either through the creation of public companies or through controls on voluntary exchanges, whether affecting prices, the quality or characteristics of goods, or outright prohibitions. Advocates of that philosophy also believe in the benefits of international trade, in order to profit from comparative advantages across borders. That perspective is not necessarily incompatible with the acceptance of certain income redistribution mechanisms, although attention is paid to ensuring that they do not generate inefficiency or incentives for opportunistic behavior. That set of beliefs can be defined as a free market mentality.
On the other end of our economic mentality spectrum are those who think that government has an active role to play in the production and distribution of wealth and goods. They believe the state must regulate, direct, and control economic activity in order to protect individuals and society as a whole. Although they do not necessarily deny that private initiative is useful, they believe its role should be limited, and that in many activities state enterprises should be preferred, since they take into account social needs and costs. In that paradigm, individuals are expected to behave altruistically and without taking personal profits into consideration. That mentality—expecting the state to play a paternal role in ensuring the well-being of the members of society—can be called interventionist or socialist. At the extreme are those who advocate a pure communist system, where there is no room for private firms as all economic activity is fully directed by the organs of the state.
Most people prefer some mixture of the two models described. In virtually every country there are people who passionately defend free markets, while others have very interventionist mentalities. Between those extremes innumerable combinations exist: conservatives, moderate socialists, liberals, reformist communists, social democrats, etc. An ideological range is often present among members of the same political party, churches, clubs, unions, or business associations, though one would expect, for example, that the average economic mentality of an organization of entrepreneurs dedicated to foreign trade would be more favorable to free markets than that presented by the members of a union of farmers who produce for local consumption. In a similar way, countries present ideological “averages” that allow us to make differentiations among those that are more aligned with a free market mentality and those aligned with an interventionist mentality.
In generating scores for countries, GIEM provides an empirical tool for pursuing a line of research considered important by renowned academics. Economic historian Douglass North was awarded the Nobel Prize in Economic Sciences for shedding light on the role of institutions in enabling the industrial revolution. North gradually changed his initial position, which considered institutions and their evolution as a result of the action of maximizing political agents, and moved toward a greater consideration of the persistence of mental models transmitted between generations (see also Zweynert 2009). North (2005) acknowledged that good institutions were ultimately based on the shared mentality that predominates in a specific society at a given moment. If a population’s culture was supportive of a market system, this would have strong practical effects because economic freedom provided the conditions for economic growth.
The famed Russian-born historian Alexander Gerschenkron (1962) focused on the preconditions for economic development in his book, Economic Backwardness in Historical Perspective. In particular, he pointed to the negative impact on economic development from public hostility toward entrepreneurs and markets. He stated that adverse dominant social attitudes could significantly affect economic growth (which for him meant industrialization) if they crystallized into governmental action affecting institutions. For Gerschenkron, there was a “crying need” for further research on the topic, especially relating what he called the “coefficient of changeability” of a society—that is, the extent to which some communities seem stuck in a particular mental framework and others evolve in light of changing circumstances or evidence.
The founder of modern business strategy theory, Michael Porter (2000), holds that the basis for institutional frameworks favorable for growth is popular support for competition, openness to globalization and international trade, an understanding that free markets benefit a majority of society, and an awareness of the pernicious effects of government favoritism. Without those beliefs, he argues, it is probable that an alternate view may take root—a view that is more favorable to the existence of noncompetitive rents, such as those granted by protectionist economic policies. A similar point has been made by the distinguished economist and historian Deirdre McCloskey (2016), herself a student of Gerschenkron at Harvard. McCloskey shows the importance of “articulated ideas about the economy” or, more precisely, “about the sources of wealth, about positive-sum as against zero-sum economic games, about progress and invention” (McCloskey 2016: 503).
The dominant economic mentality in societies manifests itself not only in the norms and cultural expressions of the people, but also in the actual laws and regulations that stipulate the role of the state in economic matters. That occurs particularly in democratic systems where political parties and leaders tend to express the prevailing ideas of their constituents in their platforms and actions. In such processes there are surely other relevant factors, such as the action of pressure groups—for example, business people sheltered by tariffs, trade unions protected by restrictions on labor mobility, and public officials whose jobs are secure. It should be noted, however, that the existence of such groups is more likely if they operate in a cultural environment that embraces government intervention.
The different institutional frameworks existing in the various nations have been and are measured by various metrics that are published periodically, including the Economic Freedom of World index prepared by the Fraser Institute (Gwartney et al. 2020) and The Index of Economic Freedom of The Heritage Foundation (Miller, Kim, and Roberts 2020). The data used as inputs of those rankings include indicators of business freedom, of the development of capital and labor markets, of monetary stability, of the size of government, of protection of property rights (including ease of transfer), of reliable enforcement of contracts, and of impediments to international trade. In general, institutional quality, as measured through these rankings, is strongly correlated with per capita income and development (De Haan, Lundström, and Sturm 2006). Those studies confirm that adequate institutional frameworks favor capital accumulation, realization of gains from trade, and efficient use of the factors of production.
Is it possible to quantify the values people hold through survey data? A common argument against the use of surveys is that true preferences are revealed only by observable actions. However, preferences over institutions and policy frameworks are different from preferences in goods and services. The former preferences are revealed in political choices, such as elections, in which the individual has virtually no reason to expect that his or her choice will have an effect on the outcome. Therefore, “elections are surveys” (Caplan 2006: 132). Moreover, elections rarely offer choices that cleanly differentiate between economic mentalities. When it comes to values regarding institutions and policies, surveying people’s opinions is arguably more useful than measuring particular behaviors.
Once surveys are accepted as useful sources on values, they can be quantified in a quite straightforward way by asking how strongly people support or oppose a certain idea or opinion—a well-established methodology in social psychology. Indeed, a quantitative examination of “culture” has contributed much to the understanding of economic development and the evolution of institutions (Alesina and Giuliano 2015).
Czeglédi and Newland (2018a) constructed a Free Market Mentality Index using as inputs some of the questions included in the World Values Survey (WVS 2015) and European Values Study (EVS 2011).1 Both of those projects attempt to measure the evolution of values and beliefs of the population in many countries, by means of periodic surveys (generally every four years). The EVS began studying attitudes in Europe in the late 1970s, and the WVS was launched as a global project in 1981. The two studies complement, and are compatible with each other, as most of the questions that are asked are equivalent. The two databases are combined and are referred to here as the EVS/WVS database. The recent release of the data corresponding to the seventh wave of the World Values Survey and the fifth wave of the European Values Study (EVS/WVS 2020a) taken during the period 2017–2020 has presented an opportunity to generate a new and more complete version of GIEM.
GIEM quantifies the extent to which people prioritize private initiative, free competition, and personal responsibility, as opposed to greater government intervention, income redistribution, and a supportive government. It can be seen as an attempt to measure the Overton Window (Lehman 2018)—the idea that there is a range of policy alternatives considered “politically acceptable” in a society at a given moment—as it relates to overall economic ideology of a country.
Like its predecessors, GIEM measures popular support for economic freedom, but is limited by the questions that are available in EVS/WVS (2020a). That means that the multidimensional nature of support for (or rejection of) free markets is imperfectly captured in the GIEM. Table 1 presents the six questions we utilized from the EVS/WVS, grouping them into three variables.
- The first variable, efficiency, explores the extent to which people believe private ownership and competition between firms produce desirable economic results. The original scales of both questions have been reversed so that the higher number signals a more pro-market view.
- The second variable, redistribution, evaluates the extent to which people are in favor of a redistributive state. Should the government redistribute income to create more equal outcomes? The two questions for this variable concern whether an ideal democratic government would tax the rich to give it to the poor. This variable therefore shows people’s views on what the government should do without much regard to whether it is able to do it. The scaling of these two questions also has been reversed so higher values align with the capitalist perspective that taxation for the sake of redistribution is not economically beneficial.
- The third variable, responsibility, quantifies the extent to which people believe that the individual is responsible for his or her own well-being, as contrasted with a view that the government should directly take action against poverty and in favor of income equality. This variable differs from the second one inasmuch as this one considers the tradeoffs that a choice between a more or less market-based economic order would involve. These two questions raise the question of whether people think that more government intervention negatively or positively affects incentives to behave responsibly.

Constructing GIEM
GIEM is constructed to create high values when people do not prefer government to play a major role in directing or regulating economic activity, or in redistributing income. As of March 2021, the number of political units2 included in EVS/WVS joint database3 was 79 with the average number of respondents from a country being 1,400.
After standardizing the question scales so that the highest value on each 1–10 scale corresponded with a free market point of view, an average score for each country is created (ignoring the “don’t know” and missing answers). In order to aggregate the six questions, the data are normalized, rescaling country averages between roughly 0 and 1, showing the distance of a particular country’s answers from the minimum and maximum values within the range of all answers for the question.
There are two reasons for this approach. First, since the idea is to aggregate the six questions into three variables and then into a single index, the answers for the questions must be comparable. What would it mean to take the average of a 2 given for the ownership question and a 4 given for the competition question? When, however, both answers are normalized, their average makes sense. Second, the standardization approach rejects the idea of an absolute minimum and maximum of free-market thinking. It makes the scale relative, showing a position between the most and least market-friendly responses.
The standardization is done according to the following procedure. The standardized score for a question of country i becomes
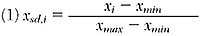
where xi is the country’s average on the original 1–10 or 0–10 scale, and
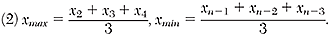
In the equations above, x2, x3, and x4 are the second, third, and fourth highest country averages, while xn−1, xn−2, and xn−3 are the second, third, and fourth lowest. Meanwhile, x1 and xn are considered outliers, and their standardized values are set to be 1 and 0. The scores of the three variables are calculated as simple averages of the standardized scores of the two questions that belong with each variable.
Finally, the overall GIEM score is calculated as the simple average of the three variables. GIEM therefore reflects an average relative position of a country, which results from the distribution of the original answers of the respondents over the 10-unit scales. For example, for the ownership question, xmax = 6.70 and xmin = 4.28. An initial uniform distribution of answers (10 percent of people choosing the answer 1, and another 10 percent answer 2, etc.) would then imply that, if every respondent gave a one-unit higher answer, the country’s standardized ownership score would be 0.37 points higher.4
General Results
There are 79 political units in the joint EVS/WVS 1.0 version (EVS/WVS 2020a) of the database used, of which we use 76 countries5 in the first part of this section.
Summary Statistics
The summary statistics of the three main variables (efficiency, redistribution, and responsibility) and the final GIEM scores for the 76 countries are given in Table 2.
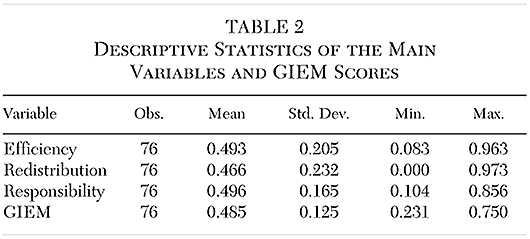
Table 2 shows that the averages of our three variables are quite similar, which is a consequence of the standardization. However, the ranges over which the three variables run is much broader. Redistribution has a much larger range of scores than does the overall GIEM score, for example.
At first glance, a puzzling feature of Table 2 is that the standard deviation of GIEM is smaller than those of the three variables whose averages are taken to get it. This reflects that our three variables are not correlated positively. After cutting the sample into two halves, we observe a negative correlation between the efficiency scores and redistribution scores among those countries whose GIEM is above 0.5, and between the efficiency scores and responsibility scores among those whose GIEM is below 0.5.
The negative correlation between the variables produces a range of overall GIEM scores that is smaller than the range of the variables that are averaged out. For example, New Zealand, the top-ranked country on the overall GIEM scale has an efficiency score of 0.820, while its responsibility score is only 0.589. Other countries have even greater extremes between the component variables of GIEM. Chile, with the tenth lowest rank overall, maintains a fairly high score on the redistribution variable (0.51) while scoring very low (0.16) in the measure of responsibility. By contrast, Vietnam is ranked number 20 overall in GIEM, and it has the opposite problem of Chile. The country scores low on redistribution (0.09) but very high on responsibility (0.856). Whether a claim on the government to redistribute greatly, while providing a large scope for private ownership, is an inconsistency depends on the perception of the quality of governance.6 Scandinavian governments seem to be able to perform such a task (Murphy 2019).
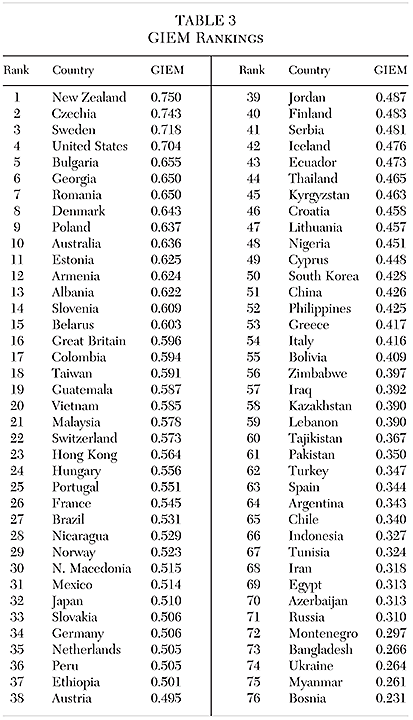
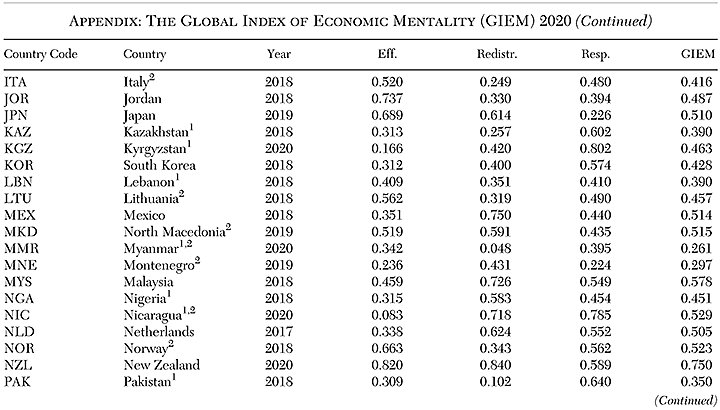
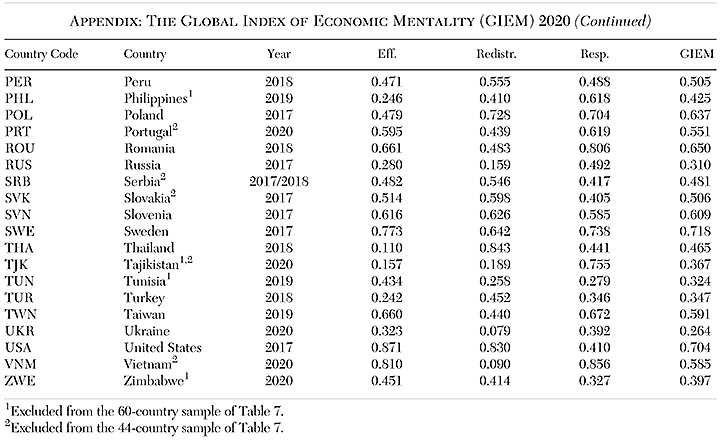
GIEM Rankings for Countries
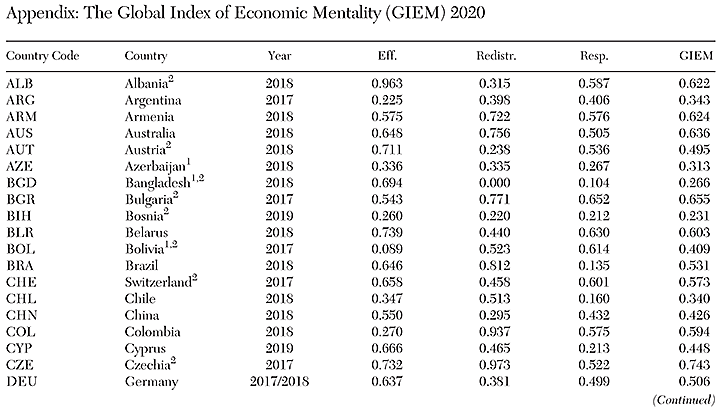
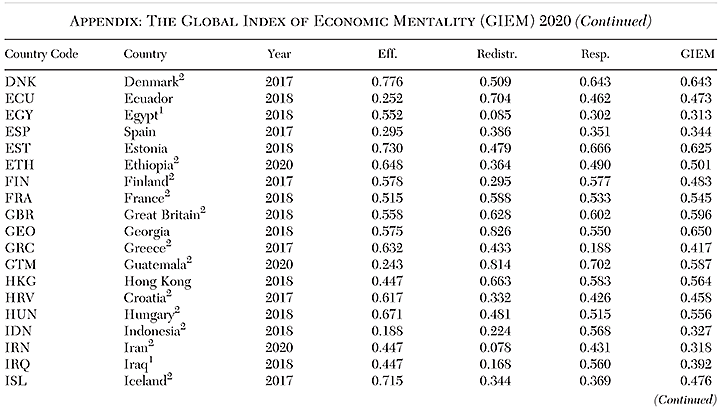
GIEM rankings for individual countries are presented below (Table 3) according to their overall scores, while the Appendix provides variable scores as well as the overall scores of all the countries in our sample, listed alphabetically. The four countries at the top of Table 3 have been dubbed “Market Leaders,” given the high support their populations grant to a free market economy. Two of the Market Leaders—New Zealand and the United States—belong to what is often called the Anglosphere (Britain and former colonies that retain many of its cultural characteristics). Two others belong to Europe: Czechia and Sweden. All these countries enjoy high economic productivity (reflected in their income per capita) and efficient institutions.
GIEM Rankings for Conglomerates
To facilitate global analysis, we group countries according to geographic categories, which are displayed along with their mean values for GIEM and its components in Table 4.
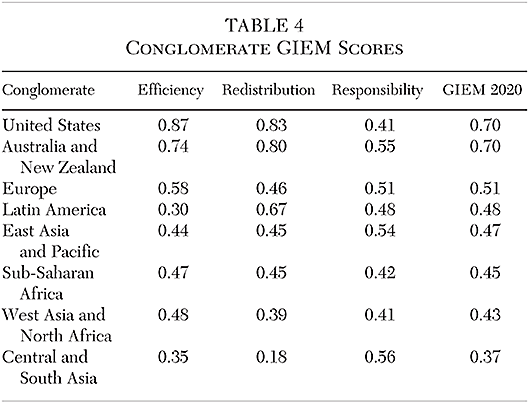
United States (0.70). Because of the unavailability of current data from Canada,7 this cluster includes only one country, the United States, which happens to be one of the Market Leaders. The people of the United States value private competition and do not prize income transfers. The scores are somewhat lower in the category of personal responsibility.
Australia and New Zealand (0.70). This conglomerate includes New Zealand, with the highest GIEM value in the sample. The economic culture seems to be similar to the United States, with the population valuing private competition, not prizing income transfers, and scoring lower in the category of personal responsibility.
Europe (0.51). This is a conglomerate with a diverse set of countries and regions. It includes two GIEM Market Leaders: Czechia (the Czech Republic) and Sweden. GIEM values among members of this region are greatly dispersed. Czechia, one of the most successful and richest countries of postcommunist Eastern Europe, is ranked number 2. The fact that it is Sweden that is ranked third in GIEM might be a surprise to those who associate the welfare state with that country. It is, however, precisely its high level of economic freedom that allows Swedes to sustain its welfare state (Bergh 2013). At the bottom of the GIEM scale one finds Ukraine and Bosnia. Ukraine had been part of the Soviet Union for 70 years before 1991. Bosnia, too, has had a stormy modern history since it went through ethnic clashes and a war in the 1990s after communist Yugoslavia broke up. GIEM scores tend to be higher in Northern Europe and lower in Southern Europe. Interestingly, several former communist countries in Eastern Europe present high GIEM values. Finally, important countries Russia, Spain, Greece, and Italy exhibit very low GIEM scores.
Latin America (0.48). This cluster includes countries that mix southern European and indigenous cultures. It does not include any GIEM champion. Colombia and Guatemala lead the region; Argentina and Chile present the lowest values. Although Latin America is one of the most unequal regions in the world, scores on this variable generally show less interest in income redistribution than we see in other regions. At the same time, populations in this region show lower enthusiasm for private initiative or competition.
East Asia and Pacific (0.47). This conglomerate is also a diverse group that includes many countries influenced by Chinese and Indic cultures. The region, an extraordinary and dynamic part of the globe, is quite homogeneous in its valuation of the market economy. Two outliers exhibiting rather low scores are Indonesia and Myanmar, the latter being one of the least free countries in the world with its recent history mostly dominated by dictatorship.
Sub-Saharan Africa (0.45). Data are currently available only for three countries in Sub-Saharan Africa. Based on this limited sample, we find African countries in the lower-middle section of our GIEM rankings.
West Asia and North Africa (0.43). This conglomerate includes what is commonly called the Middle East, but includes other nations of geographic proximity (e.g., Georgia and Armenia, which both score as market-friendly outliers) as well as the mostly Arab countries of northern Africa. Average values in this region are low across all variables, especially in the redistribution and responsibility categories.
Central and South Asia (0.37). All variables are low, especially in the redistribution and efficiency categories.
Economic Mentality of Younger and Older People
GIEM uses data from 2018 or 2017 for the 76 countries studied in our sample. The index cannot tell us much about the change in economic mentality. That is because the previous waves of the EVS/WVS do not include all the questions used to construct GIEM. Hence, longitudinal comparisons cannot be made between current scores and those of previous years. There is, however, at least one way to explore the change in economic mentality even when data are available for just one year—namely, by comparing GIEM for younger and older people. Such comparison is made possible by the fact that the EVS/WVS provides information on the age of the respondents.
To be able to make such a comparison, the samples of each country are divided into two groups: those who are at most 40 years old and those who are older than 40. This threshold age seems to be a good compromise between (1) the aim to focus on the young, whose ideas will probably shape the policies of the future, and (2) the need for enough observations for the calculations.
It can be noted that those born after about 1980 might not have living memories of the communist systems that collapsed around 1990, and this lack of experience with communism might be an important determinant of the differences in economic mentality between the older and the younger generations.
The views of the old and young may, however, differ not only because of a change in economic mentality in the long run; it might reflect simply the effect of the fact that young people tend to have different views on markets and government than do their elders. However, the selection of 40 as the threshold age may be high enough to diminish the effect of what some would term a youthful “hot-headedness.”
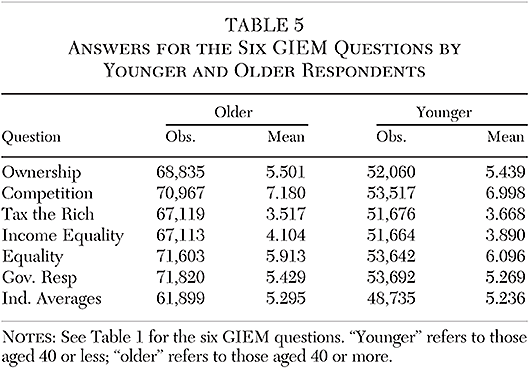
Table 5, which compares the average answers of the old and the young for the six questions used for GIEM (from Table 1), does not show many systematic differences between the two groups of people. For some questions (ownership, competition, income equality, government responsibility), older respondents are more pro-market, while, for the other two questions (tax the rich, equality), the younger respondents score higher in our index. On average the difference is rather small. The last line of the table (individual averages) shows the values that result from first taking the averages of the answers of each individual and then taking the averages of these individual average scores. This figure shows that the elder are a little more pro-market. This table exposes that age alone, independently of the country, does not lead to much difference in economic mentality.
To observe the differences between younger and older respondents for each country, GIEM scores are calculated using the same methodology as for the general GIEM. For the standardization, the minimum and the maximum values of the overall GIEM are used to make the GIEM scores for older and younger respondents comparable with the overall GIEM.
In looking at what is called “Young GIEM,” the ranking of countries is transformed in a rather surprising manner. Among the 10 highest-scoring countries,8 7 are from Eastern Europe. Moreover, developed countries of Western Europe and the Anglosphere generally rank lower in this measure as compared with the overall GIEM. New Zealand, the number 1 country in the overall index, is now ranked number 3, Sweden falls from 3 to 10, the United States from 4 to 16, France from 26 to 34, and Germany from 34 to 52.
This comparison of the Young GIEM and the overall GIEM suggests a kind of convergence of economic mentality. This is to say that, in those countries where the older generation is relatively more pro-market, the younger one will be less so, and vice versa (as is seen in Eastern Europe).
Figure 1 illustrates a test of this hypothesis. On the horizontal axis of the graph, the GIEM score is measured of the older generation while the vertical axis shows the GIEM differences between the older generation’s score and the Young GIEM. For example, New Zealand (NZL) is on the bottom right, which shows that the older generation has a very high GIEM (0.76) but the difference between the young and the old is negative (−0.07) meaning that the young have lower GIEM in New Zealand than do the old. In Russia (RUS, in the upper left), it is the other way around: older people have a quite anti-market mentality (0.25) but the difference between the younger and older is positive (0.13), meaning that younger Russians are relatively pro-market.
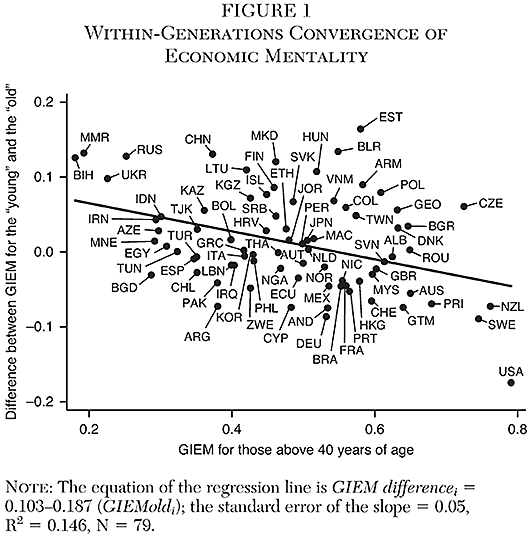
The trends mentioned above are also shown in Figure 1. Post-socialist countries are gathered in the upper middle of the graph, showing a more pro-market younger generation with Czechia and Estonia being notable outliers. Developed countries of the West are usually below the line with a notable outlier on the negative side being the United States. The United States has the top score when we narrow our analysis to older respondents (Old GIEM), but the economic mentality of younger Americans is significantly different, making the United States our biggest outlier on the negative side.
One of the most interesting features of Figure 1 is that the United States is an outlier—that is, compared to the economic mentality of those above 40, the economic mentality of those below 40 is unexpectedly anti-market. This finding is in line with other survey results (Newport 2018). It seems that the relatively big gap between the GIEM of younger and older people reflects “the socialist surge” (Glaeser 2019) in the opinions of younger voters (especially the millennials). This may foreshadow a significant shift in American politics unless this younger generation is presented with a compelling new case for economic liberty.
Statistically, there is indeed a convergence on Figure 1. The negative slope of the fitted line is statistically significant at the usual level of significance, but the fit does not seem that good. There seems to be much room for other factors, in addition to the convergence of the ideas of young people around the world, to explain why the views of the young differ from those of the elder.
Relation between Economic Mentality and Institutions
As mentioned earlier, one reason the GIEM is worthy of attention is that legal institutions and policies protecting economic freedom may be unsustainable if popular sentiment is trending in the other direction. Recent research (Alesina and Giuliano 2015; Mokyr 2018: 3–15) has confirmed the central proposition presented here, that ideas matter: the ideas that are broadly held in a country will help determine a country’s institutions and policies. An important takeaway from this discussion is that free markets cannot be sustained only by empirical arguments about economic efficiency (Clark and Lee 2017; Williams 1996). Free markets will be sustained if they are understood to produce outcomes that are morally, not just materially, good.
Since GIEM is an attempt to measure such a conviction, it can be expected that, when comparing two countries, the one with a higher GIEM score will have institutions and policies ensuring freer markets. Using statistical language, a positive correlation between GIEM and some measure of free-market institutions and policies in a cross section of countries can be expected. We do not, however, propose that the simple analysis that follows in any way proves that the causality runs from GIEM to institutions and policies (economic freedom), although that would be our preferred interpretation. The relationship between culture and institutions are usually found to be mutual (Alesina and Giuliano 2015) because culture itself has its own institutions that facilitate or prevent the spread of ideas (Mokyr 2018).9 Economic life can change culture, too, as reflected by the old idea of a doux commerce (Hirschman [1977] 2013), which is supported by some modern economic theory and empirics (Storr and Choi 2019).
GIEM might not be seen as a part of culture understood as norms or ethical rules (Voigt 2019), or “as those customary beliefs and values that ethnic, religious, and social groups transmit fairly unchanged from generation to generation” (Guiso, Sapienza, and Zingales 2006: 36, italics deleted). Rather it might be interpreted as a direct measure of the demand for more or less government intervention, as suggested by Aghion et al. (2010) arguing that trust (possibly a part of culture) affects the demand for government regulation with the latter being measured by some of the questions we use to construct GIEM.
A well-known measure of free-market institutions and policies is the Economic Freedom of the World (EFW) index published by the Fraser Institute (Gwartney et al. 2020). This annual report evaluates the economic policies and institutions of a large number of countries with an index running between 0 and 10, with 10 representing a relatively small government that secures property rights and does not hamper trade and business internationally or within its borders. The index aggregates 42 distinct variables grouped into five areas, such as the size of government, legal system and property rights, sound money, freedom to trade internationally, and regulation (Gwartney et al. 2020: 3–6). The EFW scores for 2018 run between 3.34 (Venezuela) and 8.94 (Hong Kong) for the 162 countries included. In our 76-country sample the summary index runs between 4.8 (Iran) and 8.94 (Hong Kong).
A problem that arises in examining the association between GIEM and EFW scores is the incongruence in the datasets. The most recent EFW data come from 2018, whereas the GIEM uses survey data collected between 2017 and 2020. In order to reduce the bias that might result from that, we adopted a rule of using 2017 EFW data in cases in which the GIEM survey was conducted in 2017. In other situations, in which GIEM data were collected in 2018 or later, we used the most recent EFW data from 2018.
Figure 2 illustrates the simple association between our GIEM and the overall EFW index for 76 countries.10 The simple correlation between them is 0.617; the coefficient of the GIEM as a dependent variable is clearly significant at the usually accepted 5 percent level. The correlation coefficient between the EFW index and our GIEM is higher than the correlation coefficient between any one of the five areas of EFW and any one of the three components of the GIEM.
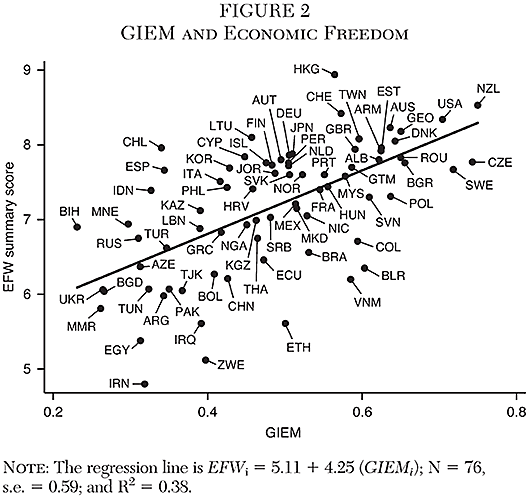
GIEM is strongly associated with economic freedom, and may in fact be a predictor of it. Figure 2, of course, does not tell anything about the direction of causality, but there are enough theoretical reasons, as is explained in the introduction, to presume an economic mentality influences the evolution of formal institutions. The predictive abilities of GIEM are far from established, as there are quite a few other factors determining economic freedom (Lawson, Murphy, and Powell 2020).
To understand the connection between GIEM and economic freedom, it is useful to look closer at some of the outliers in Figure 1. There are six countries lying outside the 95 percent confidence interval of the forecast: Zimbabwe, Iran, Hong Kong, Ethiopia, Vietnam, and Chile. Hong Kong and Chile, as Figure 1 shows, are predicted to have a much lower economic freedom than they actually have, while Zimbabwe, Iran, Ethiopia, and Vietnam are predicted to have much higher values of economic freedom.
By taking a look at these six countries, one fact stands out: these countries have autocratic political systems. Chile is the only exception, although it did have a nondemocratic or restrictive system in its recent past. This fact about these five outliers is in line with Lawson, Murphy, and Powell’s (2020) general conclusion that political freedom and civil liberties are among the most important determinants of economic freedom.
Chile’s institutions, according to Fraser’s index, are conducive to economic development and economic growth. However, the economic mentality of its population is not favorable to free markets. Chile’s GIEM score is one of the lowest in Latin America (and equivalent to populist Argentina). This situation is a result of legal frameworks and economic settings that did not derive from democratic processes but were imposed by a military government. The tensions between a population that believes in greater government intervention and the existence of a free competitive economy exploded in 2019, shifting political discussions in a direction that seems likely to bring public policies that may harm the economic future of Chile, after having been until recently a notable case of great economic success.11
By contrast, Vietnam is one of the few countries in the world that is still governed by a communist party. Although its institutional quality (according to the Fraser index) is low, the population is supportive of free markets. This suggests that, if its political system developed more democratic features, the population probably would elect politicians favorable to a free and competitive economy.
In addition to the lack of democracy and the path dependency of institutions, another factor causing discrepancies between GIEM and economic institutions may be related to what can be described as the width of the Overton Window. Even if the GIEM score is the same for two countries, the distribution of the individual responses may be different. A distribution with thicker tails (i.e., a higher standard deviation) can create a wider Overton Window, given that the population includes more divergent opinions than would a country with a “thin tail” distribution. This seems to be part of the story for the four outlier countries well below the regression line in Figure 1, as illustrated in Table 6.
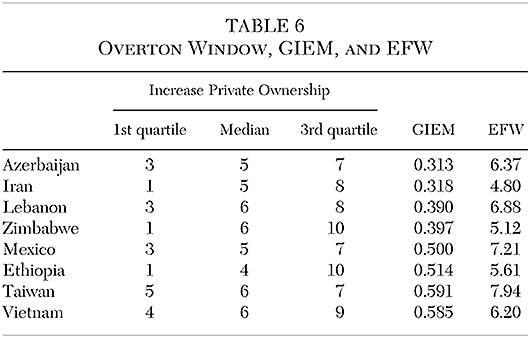
As an approximation of the width of the Overton Window, Table 6 shows the first quartile, the median, and the third quartile for the 10-unit scale of the “increase private ownership” question for eight countries. These three values cut the sample into four parts with equal number of respondents. For example, the fact that the first quartile for Mexico is 3 means that 25 percent of the respondents gave an answer of 3 or less for this question. The median being 5 means that half of the respondents said 5 or less, while the third quartile being 7 means that 75 percent said 7 or less.
It follows that 50 percent of the respondents answered the question with a number that is not lower than 3 and not higher than 7. If the Overton Window is imagined as including the opinions of the same number of people on both sides of the median voter, then the difference between the first and the third quartile is a reasonable measure of its width.
Table 6 shows these features of the distribution for four pairs of countries. In each pair the EFW of one of the countries (Azerbaijan, Lebanon, Mexico, and Taiwan) is very well predicted by its GIEM while the other (Iran, Zimbabwe, Ethiopia, and Vietnam) is an outlier on Figure 2. Lebanon (LBN), for example, is very close to the regression line on Figure 2 but Zimbabwe (ZWE), which has a very similar GIEM, is an outlier. In Zimbabwe, however, the Overton Window is much wider. Although the median is 6 for both countries, the interval that includes half of the respondents runs between 1 and 10 in Zimbabwe but only between 3 and 8 in Lebanon. Similarly, in Iran you need a +3/−4 interval around the median to find 50 percent of the respondents in it while in Azerbaijan it is only +/−2 around the same median. The Vietnam vs. Taiwan comparison is similar, too. In Ethiopia the Overton Window looks also wider than in Mexico, but it is defined around a one-unit lower median than in Mexico. The country comparisons of Table 6 and Figure 2 support the idea that the wider the Overton Window, the worse the GIEM is at predicting economic freedom.
GIEM Trends
Since not all of the questions used to create the GIEM in 2020 were asked in previous waves of the World Values Survey, a narrow index (GIEMn) was constructed to explore longitudinal trends. For this index only questions numbered E036 (private vs. state ownership of business), E037 (government responsibility), and E039 (competition is good or harmful) in the joint EVS/WVS database could be used. The methodology employed was otherwise identical to that used for the broader GIEM, whose correlation coefficient with GIEMn is 0.73.
Figure 3 shows the evolution of GIEMn for those 15 countries for which one can find an observation in each wave of the EVS/WVS project since 1989. The 15 countries are divided into two groups: those with relatively high average economic freedom scores for 2017 and 201812 and those with relatively low ones.13 The fact that the country group with a higher economic freedom in 2017–2018 had higher GIEMn in almost 30 years before might be an indication of the causality in one direction though in no way does it exclude other possibilities.

Figure 3 suggests, also, that scores have stabilized over the last two waves, after a previous decline (see also Czeglédi and Newland 2018b). The 2010–2014 wave seems to be exceptional in a sense that the decline that occurred as compared to 2005–2010 is temporary and followed by an increase in the last 5–10 years.
The above conclusions are drawn from the data of only the 15 countries with an observation in each wave since 1989. In order to see if they can be generalized, we compare the GIEMn scores of the current wave (2017–2020) to those of the 2010–2014 and the 2005–2010 wave for as many countries as made possible by the EVS/WVS data. The comparison is in Table 7.
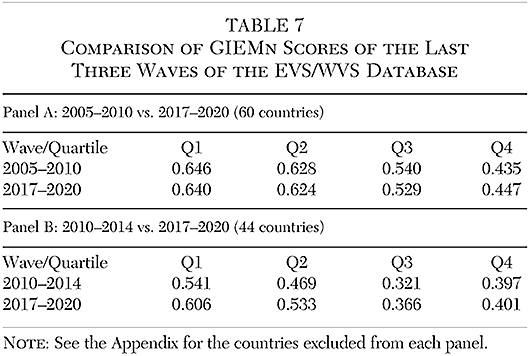
There are 60 countries14 with an observation in both the 2017–2020 and the 2005–2010 waves, which are grouped into four quartiles by their economic freedom scores in 2017–2018. Panel A of Table 7 allows us to make two observations: first, the higher economic freedom quartiles have higher GIEMn scores, and, second, there is not much change in any one of the quartiles, especially in the first two.
Panel B of Table 7, however, which compares the last two waves for 44 countries15 with GIEMn observation in both, shows significant increases in all four quartiles, and the GIEMn ranking of the lower two quartiles is less straightforward.
The conclusions from Table 7 support those that were suggested by the much narrower sample of Figure 3 for the last 15 years: GIEMn scores stabilized, but the years 2010–2014 mark a temporary decline.
Conclusion
In this article, we present a measure of economic mentality that captures the extent to which people in different countries support or reject the principles of a market economy. Our study uses survey data for views about competitive market economies (that rely on private ownership, without significant government interventions to regulate economic activity and redistribute income). The GIEM provides a ranking of countries according to their pro-free-enterprise mindset.
There is a high degree of correlation between GIEM scores and other rankings that measure economic freedom as embodied in laws and institutions, although this does not happen automatically. Cases exist where pro-market ideology is superior to existing institutions, which is a cause for optimism about future economic reforms. GIEM also provides a warning for those who value economic liberty. In several of the most pro-market nations, younger generations are losing faith in markets and are seeking greater levels of intervention by government to steer economic outcomes.
Some of the findings raise several questions for further research. Among them is the direction of causality between free market mentality and free market institutions and policies. The economic theory of “motivated beliefs” (Bénabou and Tirole 2016) predicts a two-way relationship between free market institutions and the belief in them, at least when it comes to institutions determining redistribution. Does the same logic apply for other areas of EFW and the other components of the GIEM? A deeper analysis of this relationship could answer this question.
Another area for future research is the determinants of GIEM scores. Is the intergenerational convergence of GIEM connected to better communications and higher mobility among younger people across borders, or is it explained mostly as a tendency of the younger generation to turn away from the values of their parents? Do the cross-country differences in GIEM result from long-run and deep historical factors, as suggested by some economic research (Roland 2020)? Or do the ongoing discussion and debate made possible by democratic institutions have a role in shaping it, as suggested by the association between economic freedom and democracy (Gwartney et al. 2020) and between economic freedom and GIEM?
This is a rich area for continued research with great relevance to improving the public understanding of sound economic principles and to creating greater economic opportunity for all people. Our hope is that the Global Index of Economic Mentality presented in this article will be a useful tool for researchers inspired to join this research agenda.
References
Aghion, P.; Algan, Y.; Cahuc, P.; and Shleifer, A. (2010) “Regulation and Distrust.” Quarterly Journal of Economics 125: 1015–49.
Alesina, A., and Giuliano, P. (2015) “Culture and Institutions.” Journal of Economic Literature 53: 898–944.
Bénabou, R., and Tirole, J. (2016) “Mindful Economics: The Production, Consumption, and Value of Beliefs.” Journal of Economic Perspectives 30: 141–64.
Bergh, A. (2013) “What Are the Policy Lessons from Sweden? On the Rise, Fall and Revival of a Capitalist Welfare State.” New Political Economy 19: 662–94.
Caplan, B. (2006) The Myth of the Rational Voter. Princeton, N.J.: Princeton University Press.
Clark, J. R., and Lee, D. R. (2017) “Econ 101 Morality: The Amiable, the Mundane, and the Market.” Econ Journal Watch 14: 61–76.
Czeglédi, P., and Newland, C. (2018a) “How Is the Pro-Capitalist Mentality Globally Distributed?” Economic Affairs 38: 240–56.
__________ (2018b) “Measuring Global Free Market Ideology 1990–2015.” In J. R. Gwartney, R. Lawson, J. Hall, and R. Murphy (eds.), Economic Freedom of the World: 2018 Annual Report, 189–211. Vancouver, B.C.: Fraser Institute.
De Haan J.; Lundström, S.; and Sturm, J. E. (2006) “Market-Oriented Institutions and Policies and Economic Growth: A Critical Survey.” Journal of Economic Surveys 20: 157–91.
EVS (2011) European Values Study Longitudinal Data File 1981–2008 (EVS1981–2008). GESIS Data Archive: doi: 10.4232/1.11005.
EVS/WVS (2020a) European Values Study and World Values Survey: Joint EVS/WVS 2017–2021 Dataset (Joint EVS/WVS). JD Systems Institute and WVSA. Dataset Version 1.0.0, doi:10.14281/18241.2.
__________ (2020b) European Values Study and World Values Survey: Joint EVS/WVS 2017–2021 Dataset—Variable Report (Documentation/Tables). Version: November 2020 (v.1). GESIS Data Archive, Cologne and JD Systems Institute, Madrid.
Gerschenkron, A. (1962) Economic Backwardness in Historical Perspective. Cambridge, Mass.:Harvard University Press.
Glaeser, E. L. (2019) “How to Talk to Millennials about Capitalism.” City Journal (Spring).
Guiso, L.; Sapienza, P.; and Zingales, L. (2006) “Does Culture Affect Economic Outcomes?” Journal of Economic Perspectives 20: 23–48.
Gwartney, J.; Lawson, R.; Hall, J.; and Murphy, R. (2020) Economic Freedom of the World: 2020. Vancouver, B.C.: Fraser Institute.
Hirschmann, A. ([1977] 2013) The Passions and the Interests: Political Arguments for Capitalism before Its Triumph. Princeton, N. J.: Princeton University Press.
Lawson, R. A.; Murphy, R.; and Powell, B. (2020) “The Determinants of Economic Freedom: A Survey.” Contemporary Economic Policy 38: 622–42.
Lehman, J. G. (2018) “The Overton Window and Free Speech.” Impact: The Magazine of the Mackinac Center for Public Policy (September/October): 4.
McCloskey, D. N. (2016) Bourgeois Equality: How Ideas, Not Capital or Institutions, Enriched the Modern World. Chicago: University of Chicago Press.
__________ (2021) “The Statist Neo-Institutionalism of Acemoglu and Robinson.” Rivista di Storia Economica 37: 151−89.
Miller, T.; Kim, A. B.; and Roberts, J. B. (2020) 2020 Index of Economic Freedom. Washington: Heritage Foundation.
Mokyr, J. (2018) A Culture of Growth. Princeton, N. J.: Princeton University Press.
Murphy, R. H. (2019) “The State Economic Modernity Index: An Index of State Building, State Size and Scope, and State Economic Power.” Economics of Governance 20: 73–101.
Newland, C. (2018) “Is Support for Capitalism Declining in the World? A Free-Market Mentality Index (FMMI) 1990–2012.” Independent Review 22: 1–15.
__________ (2019) “Los Orígenes de la Mentalidad Capitalista y los Agentes Económicos Activos: Una Hipótesis Global.” Cultura Económica 37: 11–30.
Newport, F. (2018) “Democrats More Positive about Socialism than Capitalism.” Gallup News (August 13).
North, D. C. (2005) Understanding the Process of Economic Change. Princeton, N. J.: Princeton University Press.
Porter, M. (2000) “Attitudes, Values, Beliefs and the Microeconomics of Prosperity.” In L. E. Harrison and S. P. Huntington (eds.), Culture Matters: How Values Shape Human Progress. New York: Basic Books.
Roland, G. (2020) “The Deep Historical Roots of Modern Culture: A Comparative Perspective.” Journal of Comparative Economics 48: 483–508.
Storr, V. H., and Choi, G. S. (2019) Do Markets Corrupt Our Morals? New York: Palgrave Macmillan.
Voigt, S. (2019) Institutional Economics: An Introduction. New York: Cambridge University Press.
Williams, W. E. (1996) “The Argument for Free Markets: Morality vs. Efficiency.” Cato Journal 15: 179–89.
WVS (2015) World Values Survey 1981–2014 Longitudinal Aggregate v.20150418, 2015. (World Values Survey Association (www.worldvaluessurvey.org). Aggregate File Producer: JDSystems Data Archive, Madrid, Spain.
Zweynert, J. (2009) “Interests versus Culture in the Theory of Institutional Change?” Journal of Institutional Economics 5: 339–60.
Appendix

This work is licensed under a Creative Commons Attribution-NonCommercial-ShareAlike 4.0 International License.