Some immigration opponents claim that immigrants import bad institutions and policies from their country of origin into their new home country. We argue just the opposite—namely, that immigrants are more likely to self-select into countries with better institutions than those in their home countries. Researchers have examined this issue in both a cross-country and within-country context. Their findings have been mixed. Although others have found small or nonexistent impacts of immigrants on state institutions, those papers assume that all immigrants are the same. Our approach is unique in that it divides immigrant populations in a variety of ways. We build on the previous literature that examines the relationship between immigration and institutions at the state level, where there are smaller inherent differences in economic institutions (compared to differences across countries). We do so by incorporating the regional diversity of immigrant populations, examining whether immigrants’ countries of origin matter for economic outcomes in their new home country. Controlling for the diversity of immigrant populations in a way that previous researchers have not done improves our ability to assess immigration opponents’ claims that immigrants from economically worse-off countries hurt U.S. economic institutions. We find virtually no evidence of an economically and statistically significant relationship between the levels of immigration we have experienced in recent decades and a decline in economic institutions in the United States, regardless of the region or economic conditions of recent immigrants’ home countries. The limited statistically significant evidence we do find is mixed and small in magnitude. Thus, one of the key rationales used to call for immigration restrictions is not supported by our findings.
Immigration and Economic Efficiency
The global efficiency gains literature argues that the current level of international immigration is suboptimal due to various immigration prohibitions, and that immigrants’ lives and broader macroeconomic environments would both be improved were these restrictions liberalized. Hamilton and Whalley (1984) argued that the reallocation of labor due to the removal of worldwide immigration restrictions could lead to as much as a 14.3 percent increase in world GDP. Since that time, numerous others have examined the quantitative welfare impacts of immigration. Docquier, Machado, and Sekkat (2015) have estimates that fall on the low end of the welfare gains spectrum, with efficiency gains of 7 to 18 percent of world GDP in the medium term, with a focal point around 12 percent. As Clemens (2011) details, the average estimates of welfare gains in the existing literature fall somewhere in the 50 to 150 percent of world GDP range. Though the precise estimates are fairly sensitive to particular modelling assumptions, even the more conservative models suggest staggeringly large efficiency gains as a result of the relaxation of mobility restrictions.
Still, there may be real reasons to be concerned about massive increases in international immigration. Clemens and Pritchett (2019) support a relaxation of current stringent immigration restrictions, but suggest that immigrants from poor countries might bring their low productivity with them to richer countries, thereby offsetting the substantial global efficiency gains found in Clemens (2011). They argue that there might therefore be a case for restricting this type of immigration, but clarify that current comprehensive restrictions are still inefficient. Though Collier (2013) does not run any empirical tests of his thesis, he posits that both migrants’ origin and destination countries may be adversely impacted by their decision to move. He suggests that the increased diversity in the host country as a result of immigration might lower the existing level of social cohesion and mutual trust in that society.
Borjas (2015) takes Collier’s argument a step further, and creates a model of the impacts of migration which incorporates these types of sociocultural externalities. In some simulations, the net gain to world GDP actually turns negative if enough people immigrate. According to Borjas (2015: 968), “For immigration to generate substantial global gains, it must be the case that billions of immigrants can move to the industrialized economies without importing the ‘bad’ organizations, social models, and culture that led to poor economic conditions in the source countries in the first place.”
However, Borjas’ argument hinges on the idea that immigrants will, in fact, bring these poor institutions with them. In many countries from which immigrants flee, those poor institutions were imposed by totalitarian dictators rather than chosen by the residents of those countries. So, it does not necessarily follow that immigrants would support implementing them in their new host countries. Indeed, the opposite seems more likely: that immigrants may self-select countries with better institutions than those in their home countries. Still, since Borjas provides no empirical evidence of this dynamic, we use this paper to provide a limited test of his thesis.
Migrating Attitudes
The other literature to which this paper contributes is the migrating attitudes literature, which argues that immigrants bring with them many of the ideas and convictions of their home country when they move to a new country. The widespread use of worldwide public opinion surveys in recent years has facilitated the development of this literature. It is widely accepted that countries with higher levels of social capital (generally proxied using survey questions related to trust) tend to perform better on a variety of economic measures (see, e.g., Coleman 1988; Putnam 1993; Knack and Keefer 1997; and Platteau 2000).
The migrating attitudes literature builds on this idea. Algan and Cahuc (2010), for example, argue that immigrants from low-trust countries are more likely to exhibit the attitudes consistent with those low-trust societies. This is problematic because, as Aghion et al. (2010) show, individuals from more distrustful societies are more supportive of extensive government regulation. They suggest that this phenomenon results from the fact that in low-trust societies, people consider mechanisms of self-regulation to be lacking, so they favor external regulation to keep untrustworthy businesses and individuals in check.
In a similar vein, Alesina and Giuliano (2014) find that, not only do societies with more familistic values tend to have lower levels of social trust, but also that migrants bring these familistic values with them when they move.1 Strikingly, they find that “family values inherited by children of immigrants whose forebears arrived in various European countries before 1940 are related to a lower quality of institutions and lower level of development today” (ibid.:179). More recently, Bologna-Pavlik, Lujan-Padilla, and Powell (2019) found that higher levels of immigration were not associated with higher levels of corruption, and in some cases were associated with lower corruption.
The migrating attitudes literature tends to examine historical attitudes’ effects on current economic outcomes, and shows how the historical attitudes of migrants influence modern institutions and development. If we can trace current economic outcomes to historical migration of immigrant attitudes, we might expect a similar trend to hold when examining more recent immigration tendencies. Alesina and Giuliano contend that historical migration patterns affect not only modern macroeconomic indicators, but also modern institutions. Here, we extend their work, and examine whether immigration trends of the recent past are related to a specific set of institutional characteristics in a cross-state context.
Immigration and Economic Freedom
This article ties most directly into the small subset of literature that examines the relationship between immigration and the policies and institutions consistent with economic freedom. Clark et al. (2015) were the first to examine this question empirically.2 Using country-level data from the Economic Freedom of the World Annual Report they found that immigration had at worst no impact on economic freedom in destination countries, and at best a small positive impact. Indeed, one specification found that an immigrant stock one standard deviation higher than that of the year 1990 increased economic freedom by 0.34 points 20 years later. (Note the economic freedom score is on a 0 to 10 scale.) Padilla and Cachanosky (2018) run a similar set of tests, but focus on the impact that international immigration to the United States has on U.S. economic freedom. They find no strong relationship between immigration and a deterioration in the quality of market liberal institutions broadly, though they find evidence of a slight negative impact on the narrower measure of labor market institutions.
Powell, Clark, and Nowrasteh (2017), and Powell (2017), take a different approach to examining the relationship between immigration and economic freedom. They examine the historical case of mass migration into Israel in the 1990s. Using a synthetic control approach, they find that Israel would not have seen such a substantial improvement in its level of economic freedom absent this mass migration. Using a similar approach, Nowrasteh, Forrester, and Blondin (2019) find that the large influx of refugees from the first Gulf War into Jordan played a substantial role in improving Jordanian institutions.
We build most directly on Padilla and Cachanosky (2018), whose work is the first to examine this relationship at the state level. We extend their work in a variety of ways. First, by lumping all immigrants together, their work assumes that all immigrants have the same impact on their new home country. We utilize more detailed data that enables us to drop that unrealistic assumption and instead evaluate whether the region of the world from which the immigrants came makes a difference in terms of economic or cultural impact. It may be the case, for example, that immigrants from regions with greater economic freedom have a positive impact on the institutional environments of their destination states, while immigrants from areas with less economic freedom have a negative impact, or vice versa. Our dataset allows us to examine those potential differences. Secondly, we use the Economic Freedom of the World index (Gwartney, Lawson, and Hall 2017) to control more precisely for the economic freedom scores of immigrants’ origin countries (as opposed to broader regions). This allows us to examine whether immigrants from countries with lower levels of economic freedom tend to affect their destination states differently than immigrants from countries with higher levels of economic freedom. Finally, we look at immigrants from poor countries and immigrants from autocratic countries.
Our measure of economic freedom in the U.S. states comes from the Economic Freedom of North America 2017 (EFNA) annual report (Stansel, Tora, and McMahon 2017), described in detail in the next section. We use the EFNA for two reasons. First, we are building on the existing literature that uses economic freedom to examine the impact of foreign-born populations on destination country or state institutions. Second, and more importantly, this measure of institutions has been found to be robustly related to a variety of beneficial outcomes in both a cross-country and cross-state setting.3
The vast majority of empirical studies that use economic freedom as a variable employ it as an independent variable. Only recently have scholars begun to consider what factors might cause economic freedom to vary across different locations.4 Since it is clear from the literature that economic freedom can be associated significantly with a variety of positive outcomes, determining what factors might impact a state’s environment for economic freedom could be helpful to policymakers.
Theoretically, the relationship between immigration and state-level economic freedom could be either positive or negative. We know from the literature that good institutional quality acts as a “pull” factor, attracting potential immigrants (Ashby 2007; Cebula and Clark 2011), and that poor institutional quality acts as a “push” factor, causing immigrants to leave their home countries (Beine, Docquier, and Schiff 2008). Though immigrants might actively choose to leave countries with dysfunctional economic institutions, they still might bring with them some of the poverty-causing institutional and cultural characteristics from their home countries (Collier 2013).
However, it might also be the case that immigrants who are escaping places with poor institutional quality work actively to avoid bringing these sorts of institutions; that is to say, they come to a new location specifically in order to escape those poor circumstances and benefit from the relatively better institutional environment. In fact, Alesina, Harnoss, and Rapoport (2016) find that immigrants have a strong positive effect on their destination countries, with their measure of “birthplace diversity” related to a variety of measures of economic prosperity. This builds on earlier work by Peri (2012), who finds a positive relationship between immigrants’ birthplace diversity and the relative productivity of their destination states in the U.S.; and Ager and Brückner (2013), who find a similar relationship in their study of the United States’ “age of mass migration”.5
Because the arrow of causality could run in either direction, we employ a variety of techniques to help mitigate any potential endogeneity concerns. In various specifications, we experiment with different structures of lagged independent variables, we employ changes instead of levels, and we control for the prior economic trend.
Econometric Model
To examine the relationship between immigration and institutional quality, we created a four-period panel reflecting the years 1980, 1990, 2000, and 2010.6 Our dependent variable is the economic freedom score of each U.S. state, drawn from the Economic Freedom of North America index (EFNA) (Stansel, Tora, and McMahon 2017). The EFNA measures “the extent to which the policies of individual provinces and states [are] … supportive of economic freedom, the ability of individuals to act in the economic sphere free of undue restrictions” (ibid.: v). We use the EFNA subnational index, which incorporates the policies of state and local governments, but not the federal government. The Appendix provides further explanation of this index. We measure each state’s overall economic freedom score as well as each of the three subcomponents of economic freedom included in the index: government spending, taxes, and labor market freedom. The latter is done to test whether any particular metric of economic freedom is driving our results.
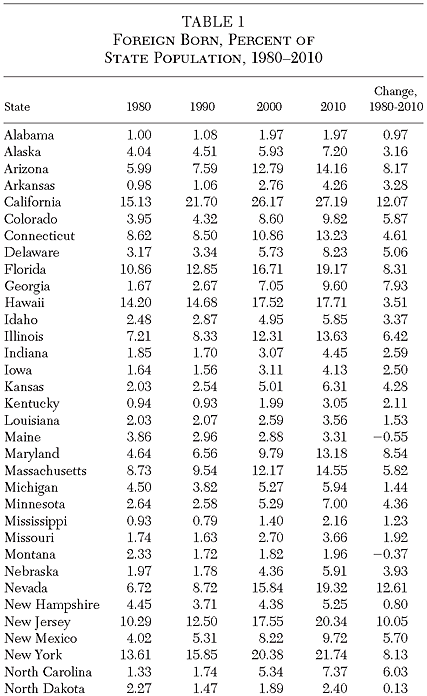
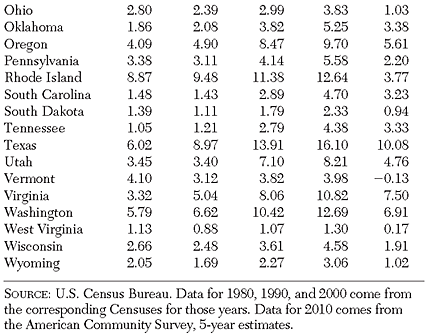
Our immigration data comes from the U.S. Census Bureau. The 1980, 1990, and 2000 figures come directly from the corresponding Census data for those years. Data for 2010 come from the 2010 American Community Survey’s 5‑year population estimates. We divide each state’s stock of immigrants for every year by the state’s total population, and use the foreign-born percentage of the population as our key independent variable of interest. As you can see in Table 1, only three states (Maine, Montana, and Vermont) saw a decline in their immigrant populations from 1980 to 2010. None saw any decline from 1990 to 2010. In 2010, the foreign-born population ranged from a low of 1.3 percent in West Virginia, to a high of 27.2 percent in California, and averaged 8.5 percent.
In addition to examining the relationship between overall immigrant populations and state institutions, we also account for the region from which those immigrants came. In order to give Borjas and other similar scholars the best chance of being right in their assertion that immigrants may harm host-country institutions, we divide our data in a number of different ways. We first examine immigrants as a share of each state’s population by their region of birth. The areas we include are Europe, Asia, Africa, South America, and North America (not including the United States). We use lagged independent variables in these first several specifications. To further address concerns about endogeneity, we use changes in immigration and economic freedom over a 10-year period in place of the level of immigration and economic freedom. We also regress the change in economic freedom on the lagged values of the change in our immigration variables. So, for example, we look at the relationship between the change in immigrants as a percent of state population from 1990 to 2000 and the change in that state’s economic freedom score between 2000 and 2010.
We next run several specifications that control for each state’s prior trend in economic freedom. Due to data availability, we are unable to use panel methods in our specifications that control for these trends. We use simple OLS, with the change in EFNA from 2000 to 2010 as the dependent variable, and both the level of EFNA in 2000 and the change in EFNA between 1980 and 2000 as key independent variables. We also use as independent variables immigrants from countries more than one standard deviation below the United States in terms of economic freedom, immigrants from poor countries (the percentage of immigrants from countries below median world income), and immigrants from autocratic countries.7
Due to data availability, five of our regression sets are simple cross sections.8 In the other six sets, we employ standard fixed effects panel methods in order to test the relationship between immigration and the institutions of economic freedom. Our basic model is:
efnai,t = α + β efnai,t‑10 + γ immi,t‑10 + δ Xi,t‑10 + ϕt + λi + εi,t
where efnai,t denotes the level of economic freedom in state i in period t. We control for each period’s initial level of economic freedom to reflect the fact that it is relatively difficult for a state to subsequently improve its economic freedom score if it starts out at an already high level. The lagged value of the economic freedom score for state i in period t is denoted by efnai,t‑10.9 The lagged value of immigration as a share of the population in state i in period t is denoted by immi,t‑10. This is our key independent variable of interest. In alternative specifications, we use the total share of immigrants and the share of immigrants by region of origin. Our vector of potential covariates is denoted by εi,t‑10. We include a full set of time and state fixed effects, denoted by ϕt and λi respectively. This allows us to control for both common trends over time that affect all states, and time-invariant factors that are specific to particular states. Our error term, εi,t, captures all omitted factors, and has an expected value of zero for all i and t.
We use the same set of control variables as Padilla and Cachanosky (2018). Our vector of controls, Xi,t‑10, is:
1. The logged value of real personal income per capita (in 2010 dollars);
2. A measure of state political ideology, drawn from Berry et al. (2010);
3. The percent of state population living in urban areas;
4. The percent of the population aged 25 and older with at least a high school diploma; and
5. The percent of the population that identifies as African American.
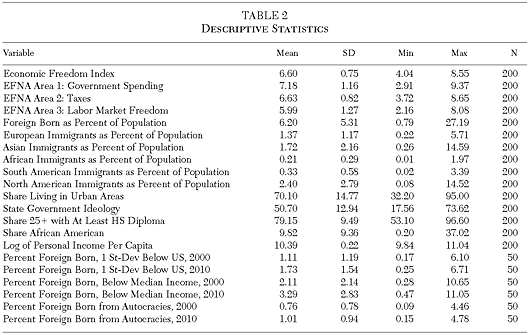
Our real personal income per capita data is drawn from the Bureau of Economic Analysis’ Regional Economic Accounts database. Following the convention in this literature, we use the logged value of this variable, and lag it by 10 or 20 years, depending on our specification. For our state political ideology variable, we use the NOMINATE ideology measure from the Berry et al. (2010) dataset. Unlike other metrics of ideology, this measure does not reflect any sort of self-identification, but is instead a measure of “operational ideology.” This measure helps draw finer ideological distinctions between states than a simple measure like vote counts or percent of the legislature controlled by Democrats would draw. Ideology is measured on a 0 to 100 scale, with more liberal states receiving higher values. The final three control variables are all drawn from the U.S. Census Bureau, with data for years 1980, 1990, and 2000 coming from the relevant decennial census, and data for the year 2010 coming from the American Community Survey’s 5‑year estimates. Hero and Preuhs (2007) maintain that variables reflecting the urban population and the share of the population 25 and older with at least a high school diploma reflect the relative cosmopolitanism of the different states. More cosmopolitan states are more likely to be more accepting of immigrants. They also find evidence that spending on welfare provisions is lower in states with larger African American populations. We include this as a control variable, since this could affect the “government spending” subcomponent of economic freedom. Descriptive statistics for all variables are reported in Table 2.
The economic impacts of immigration on native born populations have been studied extensively in the empirical literature. (This journal devoted its entire Fall 2017 issue to the topic.) For example, Akay, Constant, and Giuletti (2014) found a robust and positive effect of immigration on the subjective well-being of native populations, as measured by survey data from the German Socioeconomic Panel. Though there is some disagreement, the general consensus of the literature is that immigration is positively correlated with various measures of both subjective well-being and economic well-being (Leeson and Gochenour 2015; Kerr and Kerr 2011). Indeed, a recent meta-analysis of the literature by the National Academies of Sciences, Engineering, and Medicine (2016) found that the impact of immigrants on native wages and employment levels is small, and that immigrants have a largely positive effect on long-run U.S. economic growth. Furthermore, the report found that second- and third-generation immigrants tend to contribute more in taxes than either first-generation immigrants or native-born residents.
The link between immigration and recipient country institutions, however measured, has not been explored as extensively in the academic literature (Ashby 2007; Ashby 2010; Nejad and Young 2016; Clark et al. 2015; Powell, Clark, and Nowrasteh 2017; Padilla and Cachanosky 2018). Even assuming there are some (perhaps substantial) positive economic impacts of immigration, large levels of immigration might still be a net negative for destination countries if immigrants create significant negative impacts on host country institutions. Indeed, this is the concern of both Collier (2013) and Borjas (2014, 2015). According to Borjas, “For immigration to generate substantial global gains, it must be the case that billions of immigrants can move to the industrialized economies without importing the “bad” organizations, social models, and culture that led to poor economic conditions in the source countries in the first place” (2015: 968). Whether immigrants actually import their “bad” institutions, however, is ultimately an empirical question. That is the question we address in this paper.
This question is important because the concerns that Borjas and others raise—that immigrants from lower-GDP or developing countries will harm their new country’s socioeconomic institutions—are often used to justify increased restrictions on immigration. If we fail to find evidence that immigrants actually do import the bad institutions from their home countries, then the argument for immigration restrictions is weakened. We will discuss what previous researchers have found on this topic and then explain how we will test their hypotheses, and ours, empirically. We provide extensive econometric results and then conclude by discussing their implications.
Econometric Results: All Immigrants
Table 3 reports our results from our fixed effects panel regressions, with all independent variables lagged by 10 years. The panel is strongly balanced. The first specification uses a state’s overall economic freedom score as the dependent variable of interest. The next three use the three individual components that make up the index: Area 1 (government spending), Area 2 (taxes), and Area 3 (labor market freedom). We find a marginally significant and very weak negative relationship between the lagged values of the foreign born percent of states’ populations and states’ overall economic freedom scores ten years later. This is similar to what Padilla and Cachonosky (2018) found (though they found no relationship between immigration and economic freedom in some of their 10-year lagged specifications). A one-percent increase in the foreign born percent of state population is associated with only a 0.05 point decrease in the state EFNA score 10 years later.10 This is a very small change. It is only about 1/15th the size of the standard deviation of EFNA (0.75), and in most cases would not change a state’s overall U.S. economic freedom ranking by more than one place, if at all. For example, it would not move New York out of last place nor New Hampshire out of first place. While there is limited evidence of a statistically significant relationship, the magnitude of that relationship is so small that it is what we will refer to as economically insignificant, because in practical terms it is not significant.
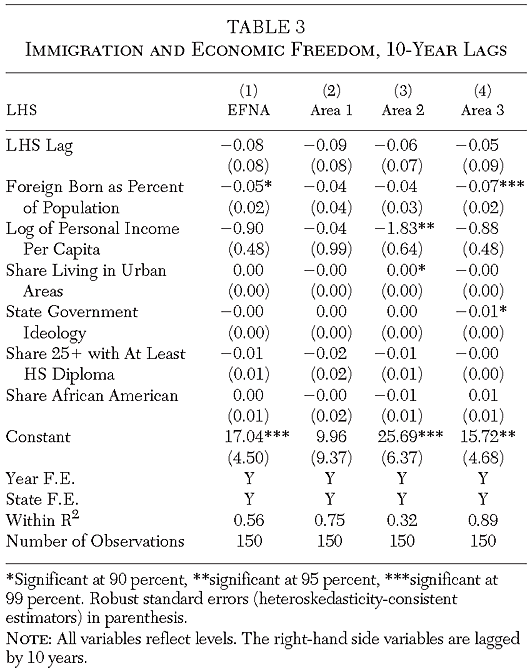
To examine whether one particular component of the EFNA index is driving these results, we use each of its three subcomponents as dependent variables. There is no statistically significant relationship between the foreign born percent of state population and either the government spending component (Area 1) or the tax component (Area 2) of economic freedom. Only in Area 3, the labor market freedom component, is there a statistically significant negative relationship with the foreign born percent of state population, though it too is very small in magnitude: A one percent increase in immigrants’ share of a state’s population is associated with a decline of 0.07 points in its labor market freedom score 10 years later. This change is only about 1/18th of a standard deviation of EFNA labor market freedom scores. Since this subcomponent is one-third of a state’s overall economic freedom score, it amounts to a change of only about 0.023 points in a state’s overall score—less than half the size of the already very small change discussed above from regression (1). This result is consistent with the findings of Padilla and Cachanosky (2018) who found a weak, but statistically significant, relationship between immigration and the subcomponent of economic freedom associated with labor market freedom (although the point estimates for this relationship were not statistically significant across all of Padilla and Cachanosky’s specifications).
Because it is unclear over what time horizon we should expect immigrants to impact a state’s institutional environment, we next run the same set of regressions using 20 year lags for our independent variables instead of 10 year lags. Using a different lag structure also allows us to see if immigrants impact state institutions differently over different periods of time. As Williamson (2000) notes, institutions are slow to change, with different sorts of institutions expected to change at different rates. Table 4 presents the results of our regressions with 20 year lags. Our results are quite similar.
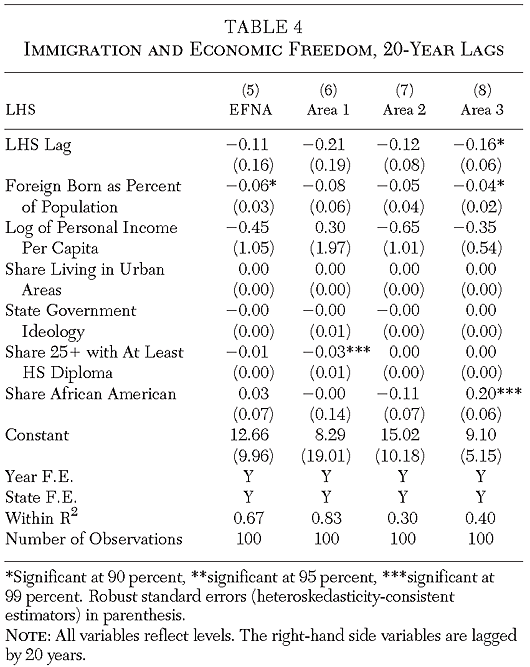
With respect to states’ overall economic freedom, the point estimate for the foreign born percent of state population is still negative, very small, and only marginally statistically significant. A one percent increase in the foreign born percent of state population is associated with an 0.06 point decline in its economic freedom score 20 years later, or only about 1/13th of a standard deviation of the overall economic freedom scores. As with the 10 year lag results, this fails to attain economic significance. That small of a change would move neither the top state out of first place nor the bottom state out of last place.
Once again, the only one of the index’s three subcomponents showing a statistically significant relationship with the foreign born percent of state population is labor market freedom (Area 3), but it is now even smaller and only marginally significant. A one percent increase in the foreign born share of state population is associated with an 0.04 point decline in its labor market freedom score. Since that component is one-third of the overall EFNA index, this represents a decline of only about 0.013 points in a state’s overall score.
Though our specifications in Tables 3 and 4 attempt to control for endogeneity by lagging all of our independent variables, and by using year and state fixed effects, we further attempt to control for endogeneity in Table 5 by using changes instead of levels as our dependent and independent variables. We once again lag all of our independent variables by 10 years. (For example, we compare the change in the foreign born percent of state population from 1990–2000 with the change in economic freedom from 2000–2010.)
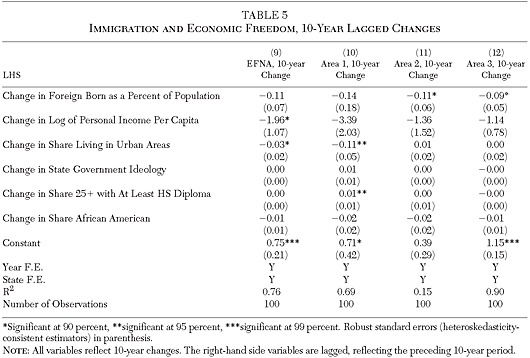
Unlike in Tables 3 and 4, the relationship between the lagged change in the foreign born share of state population and the change in its overall economic freedom score is not even marginally significant. When we examine the three subcomponents of the index, we do find a marginally significant relationship between immigration and both the tax and labor market subcomponents of economic freedom, but the coefficients are again very small.
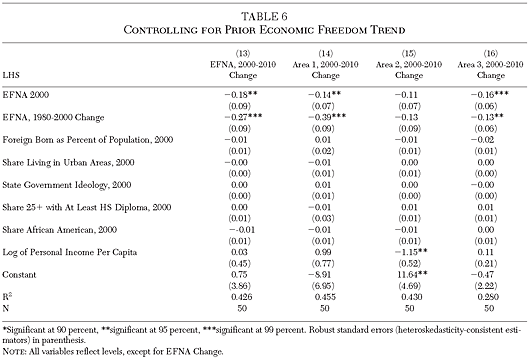
We attempt to further mitigate concerns about endogeneity by controlling for prior trends in states’ economic freedom scores. Here, our dependent variable is the change in EFNA between 2000 and 2010, and we include as a control variable both the level of state economic freedom in 2000 and the change in state economic freedom between 1980 and 2000. In Table 6, which uses the foreign born share of state population as the key variable of interest, we find no relationship between immigrant populations and changes in economic freedom.
Econometric Results: Immigrants by Region of Origin
We find that the overall foreign born share of a state’s population has essentially no economically significant relationship to the presence of policies and institutions that are consistent with economic freedom. However, unlike previous studies, we next examine whether or not immigrants’ region of origin matters in terms of states’ economic freedom. Tables 7–9 replicate the first three sets of results (Tables 3–5) by replacing the overall foreign born share of a state’s population with the percent of its population born in each of the following five regions: Europe, Asia, Africa, South America, and North America (not including the United States).
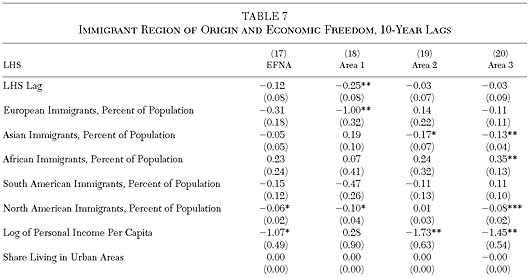
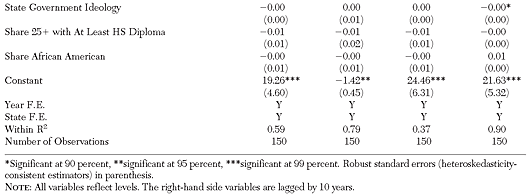
As Table 7 shows, of those five regions, the only one that has an even marginally statistically significant effect on a state’s overall economic freedom score is North America. As with the results discussed above, this marginal effect is very small. A one percent increase in immigrants from North America is associated with a 0.06 point decrease in states’ overall economic freedom scores 10 years later, a change too small to move the top state out of first place or the bottom state out of last place. This result seems to be driven by the highly significant but very weakly negative relationship between North American immigrants and states’ labor market freedom scores (Area 3). However, that relationship also fails to achieve economic significance due to its very small magnitude. Since Area 3 represents only one-third of a state’s overall EFNA score, the marginal effect here of a one-percent change in the foreign-born share of a state’s population on its overall economic freedom score is only 0.027. The relationship between immigration and government spending (Area 1) is marginally statistically significant, but also of very small magnitude.
While our main variable of interest is the 10 year change in a state’s overall economic freedom score, there were a few other marginally and moderately significant coefficients for the individual subcomponents of the EFNA index, all of which were quite small. The largest one shows that a 1 percent increase in the European born share of a state’s population is associated with a full one point decline in the EFNA’s government spending subcomponent (Area 1) ten years later. Because that subcomponent makes up only one-third of the overall economic freedom score, it is equivalent to a 0.33 point change in a state’s overall score. This would not change the rank of the overall least-free state (New York) but it would move the most-free state (New Hampshire) from first to fourth. In contrast, we find a positive relationship between the African born share of a state’s population and its labor market freedom score, with a one-percent increase in a state’s African born population associated with a 0.35 point increase in this area of the index. However, the implied 0.117 change in the overall EFNA score is too small to move the first and last state’s positions. The other two significant coefficients have even smaller marginal effects.
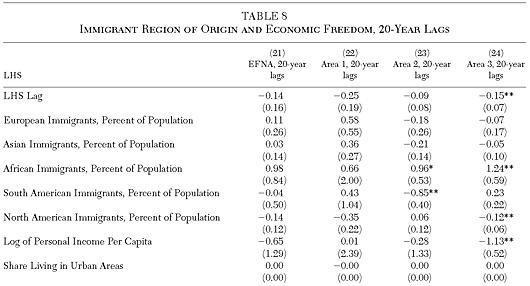
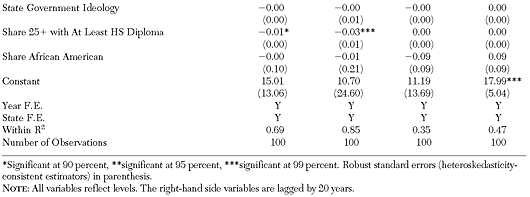
When we used a longer, 20 year lag (Table 8), we found no statistically significant relationship between a state’s economic freedom and its immigrant population from any of the five regions, and all but one of the significant results from Table 7 lost (or at least declined in) significance. That exception is that a one-percent increase in the African born share of a state’s population is associated with an even larger (and equally significant) increase in labor market freedom of 1.24 points twenty years later. The implied 0.41 change in the overall index score, the largest marginal effect that we found in all of our results, would be large enough (if negative) to move New Hampshire from the first to the fourth most free U.S. state, but would still not dislodge New York from the bottom spot. This positive coefficient for African immigrants was also found for tax freedom (Area 2), while an increase in South American immigrants yielded a negative point estimate for that area. Both these coefficients, if negative, imply a marginal effect large enough to move New Hampshire from first to fourth.
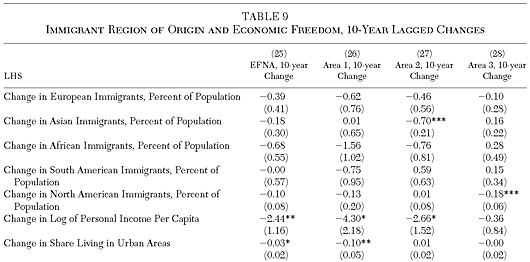
The regional results using 10 year lagged changes for our independent variables in Table 9 gave us similar results to those for the overall foreign born share of state population in Table 5. We found no evidence in any of the five regions of a statistically significant relationship between the lagged change in the foreign born share of a state’s population and the change in its overall economic freedom. We did find one region (Asia) to be significantly associated with a decline in tax freedom (Area 2) and one (North America) to be significantly associated with a decline in labor market freedom (Area 3). Neither of these were economically significant in the sense that their marginal effects would not have dislodged the top or the bottom state from its current position.
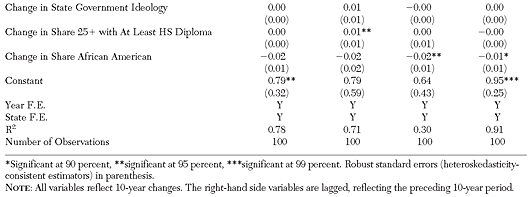
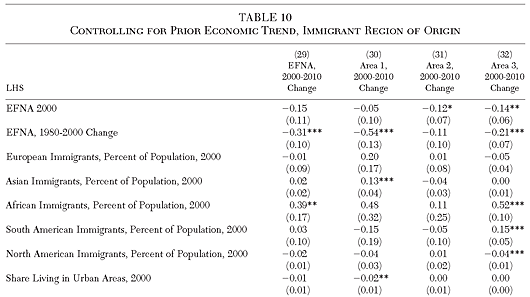
In Table 10, we attempt to further mitigate concerns about endogeneity by controlling for the prior trend in each state’s economic freedom. Here, our dependent variable is the change in a state’s EFNA score between 2000 and 2010, and we include as a control variable both its level of economic freedom in 2000 and the change in its economic freedom between 1980 and 2000. Only African immigrants have a significant relationship to the change in a state’s overall economic freedom between 2000 and 2010, and that relationship is strongly positive. Asian immigrants have a strongly positive relationship to the change in the subcomponent associated with government spending (Area 1); and both African and South American immigrants have a strongly positive relationship to the change in labor market freedom (Area 3). North American immigrants have a slight negative relationship to states’ labor market freedom scores, but the overall point estimate of this coefficient is very small.
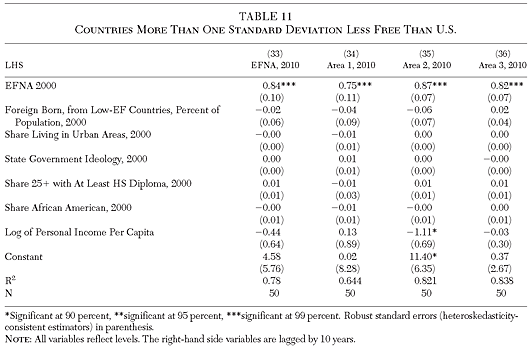
In Table 11, we examine the impact of immigrants from countries with very low economic freedom (more than one standard deviation below the United States), as measured by the Economic Freedom of the World index (Gwartney, Lawson, and Hall 2017). If immigration critics were correct, we would expect to see a large and statistically significant negative coefficient here. However, we find no significant relationship at all between an increase in immigrants from very unfree countries and the economic freedom of their new home states 10 years later.
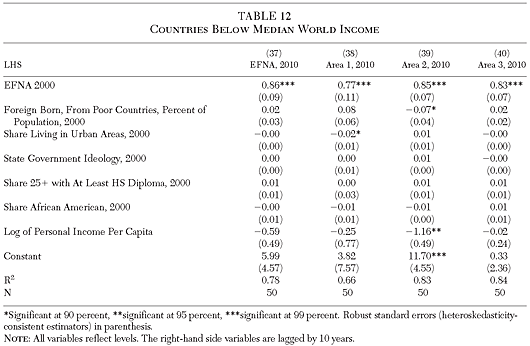
In Table 12, our key independent variable of interest is a state’s population of immigrants from countries with income levels below median world income. There is only a slight relationship between an increase in immigrants from these countries and the taxation subcomponent of economic freedom (Area 2). Once again, the point estimate is small; so, though we find statistical significance here, it is of little economic significance. As a robustness check, we also looked at immigrants hailing from countries with income levels below average world income (table omitted). The results were substantially the same.
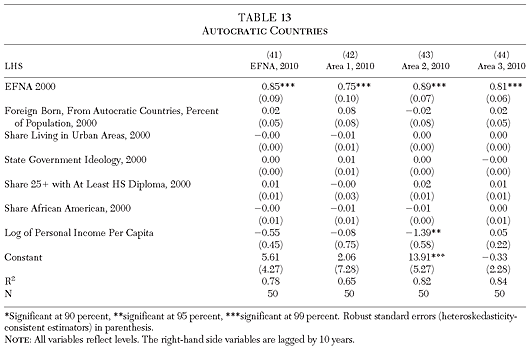
Finally, in table 13, we examine the impact of immigrants from autocratic countries on state-level economic freedom 10 years later. If immigration critics were correct, we would expect to see a large and statistically significant negative coefficient here. However, as is the case for countries with low economic freedom, we find no statistically significant relationship at all.
Conclusion
Some opponents of immigration suggest that immigrants will import the bad institutions and policies from their countries of origin into their new home countries. Researchers have tested that hypothesis at the national level and have generally found it lacking. In contrast, we argue that immigrants are more likely to self-select into countries with better institutions than those in their home countries. We build on Padilla and Cachanosky (2018), who were the first to test this hypothesis at the subnational level, by including several more refined measures of states’ immigrant populations. Rather than just using the overall foreign-born percentage of each U.S. state’s population, which assumes that all immigrants have the same effect on their new home states, we also utilize the percent of immigrants from each of five different geographic regions, from countries significantly less free than the United States, from poor countries, and from autocratic countries. This allows us to control for the diversity of immigrants and thereby examine whether or not immigrants’ region of origin matters.
Using a variety of specifications, we find no evidence of an economically significant relationship between the overall foreign-born share of a U.S. state’s population and changes in its economic freedom. Those results are robust to a variety of specifications, including different lag structures, lagged changes, and controls for prior trends in states’ economic freedom. While in some specifications we do find some limited evidence of statistical significance, the magnitude of their marginal effect is too small to attain economic significance. These findings are similar to those of Padilla and Cachonosky (2018), who find no strong or consistent relationship between increases in immigrant population and changes overall economic freedom. Like Padilla and Cachanosky, the strongest relationship (in terms of statistical significance) that we find is between increases in the foreign-born share of a state’s population and changes in the labor market freedom subcomponent of its economic freedom score. However, this coefficient is very small; thus, it fails to achieve economic significance.
When we refine our measure of the foreign-born share of a state’s population by using immigrants’ region of origin, we again find no evidence of an economically significant relationship between immigrant populations from any of the five regions (Europe, Asia, Africa, South America, and North America) and states’ overall economic freedom scores. The one statistically significant result implies a marginal effect that is too small to attain economic significance. When looking at immigrants from poor countries, and immigrants from autocratic countries, we are unable to find any relationships that are both statistically and economically significant.
Because the state-level data for immigrants as a share of the population is only available at 10 year intervals, it is possible that our results are clouded by idiosyncrasies in the stock of immigrants related to the specific years we use in our panels. We try to mitigate this problem by using year fixed effects, lagged changes, and controls for prior trends in states’ economic freedom, but it is possible that we have not totally eradicated it. Additionally, since institutions change slowly over time, it might be the case that our data limitations don’t allow us to take a significantly long-term view of this phenomenon. If we were able to examine the relationship over a longer time horizon, it might be the case that we would find different results. Still, it is encouraging that many of our significant results seem to fade when using a 20 year rather than a 10 year time horizon.
Finally, we live in an environment in which international migration is highly controlled. In our sample, the immigrant share of a state’s population has a mean of 6.2 percent, and ranges from a low of less than 1 percent to just over 27 percent. Borjas’ (2015) simulations, which imply that immigrants will import their origin country’s inferior institutions, assume a world of massively higher immigration rates. It might be that our results would be somewhat different were we to see significantly higher levels of immigration. Still, like Padilla and Cachanosky (2018), we find virtually no evidence of an economically significant relationship between the levels of immigration we have experienced in recent decades and a decline in United States economic institutions. This provides some limited evidence that Borjas’ concerns that we should restrict immigration to avoid harming our institutions are exaggerated.
Appendix: Description of Economic Freedom of North America Index
Subnational Index
Area 1: Government Spending
- 1A: General Consumption Expenditures by Government (as Percent of Income)
- 1B: Transfers and Subsidies (as Percent of Income)
- 1C: Insurance and Retirement Payments (as Percent of Income)
Area 2: Taxes
- 2A: Income and Payroll Tax Revenue (as Percent of Income)
- 2B: Top Marginal Income Tax Rate and the Income Threshold at which It Applies
- 2C: Property Tax and Other Taxes (as Percent of Income)
- 2D: Sales Tax Revenue (as Percent of Income)
Area 3: Labor Market Freedom
- 3A: Minimum Wage (as Percent of Per Capita Personal Income) li>
- 3B: State & Local Government Employment (as Percent of Total Employment)
- 3C: Union Density (Percent of Total Employment)
Data for each variable is standardized on a 0 to 10 scale, with 10 representing most free and 0 representing least free. The scores for the variables within each of the areas is averaged to get three area scores, which are then averaged to get an overall score.
References
Ager, P.; and Brückner, M. (2013) “Cultural Diversity and Economic Growth: Evidence from the US during the Age of Mass Migration.” European Economic Review 64 (November): 76–97.
Aghion, P.; Algan, Y.; Cahuc, P.; and Shleifer, A. (2010) “Regulation and Distrust.” Quarterly Journal of Economics 125 (3): 1015–49.
Akay, A.; Constant, A.; and Giuletti, C. (2014) “The Impact of Immigration on the Well-Being of Natives.” Journal of Economic Behavior & Organization 103 (July): 72–92.
Alesina, A.; and Giuliano, P. (2014) “Family Ties.” In P. Aghion and S. N. Durlaf (eds.), Handbook of Economic Growth, Vol. 2, 177–215. San Diego: North-Holland.
Alesina, A.; Harnoss, J.; and Rapoport, H. (2016) “Birthplace Diversity and Economic Prosperity.” Journal of Economic Growth 21 (2): 101–38.
Algan, Y., and Cahuc, P. (2010) “Inherited Trust and Growth.” American Economic Review 100 (5): 2060–92.
Ashby, N. J. (2007) “Economic Freedom and Migration Flows between US States.” Southern Economic Journal 73 (3): 677–97.
(2010) “Freedom and International Migration.” Southern Economic Journal 77 (1): 49–62.
Beine, M. A. R.; Docquier, F.; and Schiff, M. (2008) “Brain Drain and Its Determinants: A Major Issue for Small States.” IZA Discussion Paper No. 3398. Bonn, Germany: Institute of Labor Economics.
Berry, W. D.; Fording, R. C.; Ringquist, E. J.; Hanson, R. L.; and Klarner, C. E. (2010) “Measuring Citizen and Government Ideology in the US States: A Re-appraisal.” State Politics & Policy Quarterly 10 (2): 117–35.
Bologna-Pavlik, J.; Lujan-Padilla, E.; and Powell, B. (2019) “Cultural Baggage: Do Immigrants Import Corruption?” Southern Economic Journal 85 (4): 1243–61.
Borjas, G. J. (2014) Immigration Economics. Cambridge, Mass.: Harvard University Press.
(2015) “Immigration and Globalization: A Review Essay.” Journal of Economic Literature 53 (4): 961–74.
Cebula, R. J.; and Clark, J. R. (2011) “Migration, Economic Freedom, and Personal Freedom: An Empirical Analysis.” Journal of Private Enterprise 27 (1): 43–62.
Clark, J.R.; Lawson, R.; Nowrasteh, A.; Powell, B.; and Murphy, R. (2015) “Does Immigration Impact Institutions?” Public Choice 163 (3–4): 321–35.
Clemens, M.A. (2011) “Economics and Emigration: Trillion-Dollar Bills on the Sidewalk?” Journal of Economic Perspectives 25 (3): 83–106.
Clemens, M.; Pritchett, L. (2019) “The New Economic Case for Migration Restrictions: An Assessment.” Journal of Development Economics 138: 153–64.
Coleman, J. S. (1988) “Social Capital in the Creation of Human Capital.” American Journal of Sociology 94: S95–S120.
Collier, P. (2013) Exodus: How Migration Is Changing Our World. New York: Oxford University Press.
Docquier, F.; Machado, J.; and Sekkat, K. (2015) “Efficiency Gains from Liberalizing Labor Mobility.” Scandinavian Journal of Economics 117 (2): 303–46.
Gwartney, J.; Lawson, R. A.; and Hall, J. C. (2017) Economic Freedom of the World: 2017 Annual Report. Vancouver: Fraser Institute.
Hall, J. C., and Lawson, R. A. (2014)” Economic Freedom of the World: An Accounting of the Literature.” Contemporary Economic Policy 32 (1): 1–19.
Hamilton, B., and Whalley, J. (1984) “Efficiency and Distributional Implications of Global Restrictions on Labour Mobility: Calculations and Policy Implications.” Journal of Development Economics 14 (1): 61–75.
Hero, R. E., and Preuhs, R. R. (2007) “Immigration and the Evolving American Welfare State: Examining Policies in the US States.” American Journal of Political Science 51 (3): 498–517.
Kerr, S. P., and Kerr, W. R. (2011) “Economic Impacts of Immigration: A Survey.” NBER Working Paper No. w16736. Cambridge, Mass.: National Bureau of Economic Research.
Knack, S., and Keefer, P. (1997) “Does Social Capital Have an Economic Payoff? A Cross-Country Investigation.” Quarterly Journal of Economics 112 (4): 1251–88.
Lawson, R.; Murphy, R.; and Powell, B. (2020) “The Determinants of Economic Freedom: A Survey.” Contemporary Economic Policy. Forthcoming.
Leeson, P., and Gochenour, Z. (2015) “The Economic Effects of International Labor Mobility.” In B. Powell (ed.), The Economics of Immigration: Market-Based Approaches, Social Science, and Public Policy, 11–37. New York: Oxford University Press.
Murphy, R. (2017) “Immigration and Its Effect on Economic Freedom: An Empirical Approach.” Cato Journal 37 (3): 531–38.
National Academies of Sciences, Engineering, and Medicine. (2016) The Economic and Fiscal Consequences of Immigration. Washington: National Academies Press.
Nejad, M. N., and Young, A. T. (2016) “Want Freedom, Will Travel: Emigrant Self-Selection According to Institutional Quality.” European Journal of Political Economy 45: 71–84.
Nowrasteh, A.; Forrester, A. C.; and Blondin, C. (2019) “How Mass Immigration Affects Countries with Weak Economic Institutions: A Natural Experiment in Jordan.” World Bank Policy Research Working Paper No. 8817. Washington: World Bank Group.
Padilla, A., and Cachanosky, N. (2018) “The Grecian Horse: Does Immigration Lead to the Deterioration of American Institutions?” Public Choice 174 (3–4): 351–405.
Peri, G. (2012) “The Effect of Immigration on Productivity: Evidence from US States.” Review of Economics and Statistics 94 (1): 348–58.
Platteau, J. P. (2000) Institutions, Social Norms, and Economic Development. New York: Routledge.
Powell, B. (2017) “Economic Freedom and Mass Migration: Evidence from Israel.” Cato Journal 37 (3): 523–30.
Powell, B. (ed.) (2018) Economic Freedom and Prosperity: The Origins and Maintenance of Liberalization. New York: Routledge.
Powell, B.; Clark, J. R.; Nowrasteh, A. (2017) “Does Mass Immigration Destroy Institutions? 1990s Israel as a Natural Experiment.” Journal of Economic Behavior & Organization 141: 83–95.
Putnam, R. D. (1993) “What Makes Democracy Work?” National Civic Review 82 (2): 101–07.
Stansel, D.; Tuszynski, M. P. (2018) “Sub-National Economic Freedom: A Review and Analysis of the Literature.” Journal of Regional Analysis and Policy 48 (1): 61–71.
Stansel, D.; Torra, J.; McMahon, F. (2017) Economic Freedom of North America: 2017. Vancouver: Fraser Institute.
Williamson, O. E. (2000) “The New Institutional Economics: Taking Stock, Looking Ahead.” Journal of Economic Literature 38 (3): 595–613.
About the Authors

This work is licensed under a Creative Commons Attribution-NonCommercial-ShareAlike 4.0 International License.