This article examines 77 countries with the most significant economic liberalizations since 1970, as measured by changes in the Economic Freedom of the World (EFW) index. Measures of both the speed and comprehensiveness of the reforms are presented. Our empirical evidence suggests that faster reforming nations economically outperformed slower reformers. We do not find evidence that more comprehensive reforms, as opposed to more narrowly targeted reforms, had much of an impact on ensuing economic growth.
Shock Therapy Versus Gradualism
Jeffrey Sachs (2012) explains and defends his participation in the use of shock therapy (aka “Big Bang”) reforms in Bolivia, Poland, and Russia. He compared his approach to that of an emergency room doctor facing a patient on the verge of death from multiple ailments. In his view, treating the patient quickly, even rashly, is the only way to save the patient’s life. In addition, given the speed with which distributional coalitions (Olson 1965) may form to disrupt or derail any reform process, a fast reform may be the only politically viable option. During a crisis period, such as that facing the nations Sachs dealt with, there is often only a short political window during which reforms can take place. This idea seems to be the motivation for Milton Friedman’s (1962: ix) famous dictum: “Only a crisis—real or perceived—produces real change.”
Despite Sachs’s arguments, the consensus seems to be that the Big Bang approach, especially as it applied to Poland and Russia, was a failure, though it isn’t clear if it was a failure of the reforms to work economically or a failure of political will to see them through (Marangos 2003; Hall and Elliott 1999; Rutland 2013). In contrast, other scholars have pointed to the slower-paced reforms enacted in China, and the economic success that has followed, as evidence in favor of gradualism (e.g., Liew 1995).
One interesting thesis, which we shall explore in this article, is the idea that there was a big difference in the character of reforms undertaken in the Big Bang nations compared with gradual reformers. In comparing Russia with China, Kazakevitch and Smyth (2005: 69) argue that the Big Bang reforms tended to be top-down, macroeconomic reforms such as monetary and financial stabilization, and that those reforms did not reach down to a microeconomic level that would foster “genuine market forces and competition.”1
Perhaps it was not so much that the reforms were too fast in Poland and Russia, but that the reforms were too narrow. Perhaps China’s reforms have not succeeded because they were slow, but because they were broad and both macro- and microeconomic in nature. If fast reforms tend to be narrow, and if slow reforms tend to be broad, it may be hard distinguishing one from the other without a larger sample of countries to draw inferences from. The main purpose of this article is to examine this question.
Measuring Economic Liberalization
Our measure of economic reform will be based on the Economic Freedom of the World (EFW) index (Gwartney et al. 2018), which is one of the most widely used measures of the of the consistency of a nation’s policies and institutions with free-market capitalism. It currently generates a 0–10 rating, with higher ratings indicating greater economic freedom, for 162 nations for 2016. Data are available annually back to 2000 and in five-year intervals back to 1970, though the sample of countries gets smaller as you go back in time.
There is little question that we have seen a worldwide shift toward freer markets over the past 40 years or so. Among the 102 nations with EFW ratings in both 1980 and 2016, the average developed nation’s rating increased to 7.71 from 6.43 (equivalent to 0.99 standard units), and the average developing nation’s rating rose to 6.65 from 4.91 (1.35 standard units).2 In fact, only one country, Venezuela, experienced any meaningful decrease in the EFW index over this period.3 The bottom line is that there has been a wave of market liberalization going on in almost all corners of the globe over the past several decades, and this liberalization was most emphatically not just about the breakup of the Soviet Union and Eastern Bloc. These events as well as the Reagan and Thatcher revolutions were emblematic of a much wider global phenomenon.4
Our first task is to identify and characterize the countries with the biggest economic liberalizations since 1970. To that end, we first identified every country that experienced a 2 unit or more increase in the EFW index rating over any time period between 1970 and 2016. Then we identified the shortest time period over which this 2 unit change took place. For example, suppose a country had the following data points: 2000: 3.0; 2001: 3.5; 2002: 4.5: 2003: 5.2; 2004: 5.4. The 2000-03 period of time, three years, would be the fastest 2 unit (or more) increase in the EFW rating.5
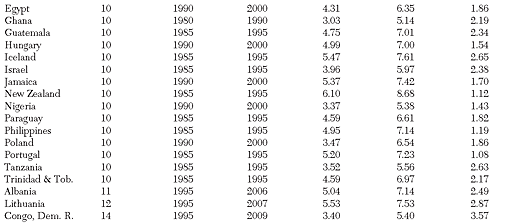
Table 1 shows the 77 countries whose EFW rating increased by 2 units (or more), the time period during which their reforms took place, the starting and ending EFW index values, and the standard deviation of the changes in the five subareas of the EFW index; the latter will be explained below. The list is sorted based on how fast the reform process took.


There are some limitations to this approach that should be acknowledged. First, the EFW index is available only in five-year intervals from 1970 to 2000 so the reform lengths can only be 5, 10, 15, …, 30 years in length during these years. This obviously adds some imprecision to the reform length in the earlier years versus the post-2000 period, after which the data become available annually. Second, many countries may have been reforming before they were incorporated to the EFW index. This is especially true of the former communist nations, most of which were not added until 1995 or, in some cases, even much later. We know many began reforming immediately after the breakup of the Soviet Union in 1991, but we may not be able to capture these reforms here. As an example, Georgia does not even appear on the list in Table 1, even though it is widely regarded as one of the biggest (and fastest) reforming nations (Lawson, Grier, and Absher 2019; Burakova and Lawson 2014)—because Georgia doesn’t appear in the EFW index until 2003, which is after some reforms had already taken place. Likewise, it is possible some countries are in the midst of a 2 unit increase in the EFW index at the end of the period under study, but would not be yet counted as a reforming nation with this measure. Third, some reforming countries may have continued reforming after the initial 2 point increase occurred, while others may have backslid some. This particular slicing of the data does not distinguish among these countries.6 Despite these criticisms, the approach taken here to identify the time period during which a country experienced a 2 point change in the index is a reasonably simple and neutral approach to identifying reforming nations across the board.
Table 2 reports descriptive statistics for the variables in Table 1 (as well as for some additional variables used in the empirical analysis below). The average length of time for a country to improve its EFW rating was about 15 years —with the fastest period being 5 years and the slowest 39.

A number of countries reformed very quickly. The economic liberalizations of Argentina, El Salvador, Nicaragua, Peru, Rwanda, and Uganda took only 5 years to increase by 2 points on the EFW index. They all did so between 1990 and 1995, except for Rwanda, which did so between 1995–2000. Similarly, most of the formerly communist nations reformed quickly in the early- and mid-1990s as they underwent the “Big Bang” or shock therapy market reforms. Latvia, Lithuania, Romania, Ukraine, Bulgaria and Slovak Republic all gained 2 points or more in under a decade, beginning in 1995. Despite all the talk of shock therapy in Poland and Russia, our data say that it took 10 years and 15 years, respectively. Poland, though not Russia, did receive an EFW rating in 1990 so this is not an artifact of not having complete data in Poland’s case at least.
At the other end of the spectrum, it took Taiwan a full 39 years (1975–2014) to garner a 2 point increase in the EFW rating. In fact, a number of the world’s most celebrated liberalizations also took the slow approach to the liberalization race. China (1980–2000), Botswana (1980–2000), Ireland (1975–95), and Sweden (1980–2000) took 20 years to accomplish the task. South Korea (1985–2006) took 21 years and India took 28 years (1975–2003).
The final column of Table 1 reports the standard deviation of the changes in the five sub-areas of the EFW index. The five areas are: (1) Size of Government; (2) Property Rights and the Legal System; (3) Sound Money; (4) Freedom to Trade Internationally; and (5) Regulation of Credit, Labor, and Business. The Size of Government area, which reflects fiscal policy, and the Sound Money area, which reflects monetary policy, are mostly macroeconomic in nature, though each as microeconomic importance as well. The other areas, especially the Property Rights and Regulation areas are more microeconomic. The Trade area is more of a combination of both.
This standard deviation found in Table 1 is a measure of how narrow (or conversely how broad) the liberalization process was. If a country increased its score exactly 2 points in each of the five areas, this would yield a standard deviation of 0, indicating that the reform process was perfectly across the board. A high standard deviation would indicate that the critical improvements were occurring in just one or perhaps two areas. The average value for this measure was 1.83, with a minimum value of 0.52 (Sweden) and a maximum value of 3.57 (Democratic Republic of Congo). Countries like Sweden experienced nearly across-the-board increases in the EFW areas, while counties like the Democratic Republic of Congo really improved only in one of the areas. In fact, the latter country’s Sound Money area rating increased by over 8 points as the country exited a hyperinflation period, while the other areas saw little change.
Of particular note is Russia, whose standard deviation measure of 3.12 was the 5th highest among the 77 countries in the sample. Russia’s reforms were in fact not very comprehensive according to this measure. In looking at the underlying data, essentially all of the increase in Russia’s rating was a result of a 7.22 increase in the Sound Money area and a 2.28 increase in the Regulation area. In contrast, China’s reforms were more comprehensive. Its standard deviation of 1.82 was about average for the sample, and was the result of solid increases in three of the five areas of the EFW index (Sound Money 1.94, International Trade 4.05, and Regulation 2.68).
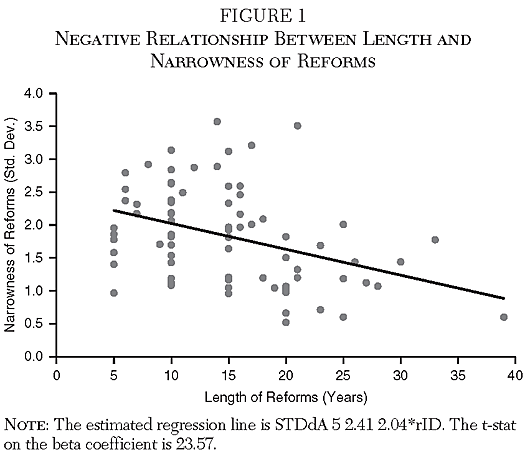
One question worth asking is whether or not countries that reformed more quickly also did so in just a few areas? The answer is yes. Figure 1 shows a clear negative relationship between the reform length (horizontal axis) and the narrowness of the reforms (vertical axis). Thus, as we suspected, countries that took a long time to reform tended to enact a more comprehensive set of reforms.
Regression Analysis
Having identified the 77 countries that undertook significant economic liberalizations over the past five decades, the next step is to evaluate their relative economic performance. For each country, we have obtained the average annual growth rate in real, per capita GDP over the reform period plus five years. For example, Argentina’s reforms occurred from 1990–95, so the growth rate for Argentina was calculated for 1990–2000.7
As shown in Table 2, the average growth rate of these reforming nations during their reform periods (plus 5 years) was 2.41 percent, which is a very solid growth rate in real, per capita terms. The economic success was not guaranteed however with several (all African) nations experiencing slight negative growth rates. As expected, China’s growth rate, at 8.6 percent per year, was the highest in the sample.
Which reforming nations did better? Table 3 reports the results of three OLS regressions. The dependent variable is the growth rate of the reforming country over its reform period plus five additional years. As explanatory variables, we have three standard control variables: (1) GDP per capita (measured in ppp US$) at the beginning of the reform period; (2) gross investment to GDP at the beginning of the period; and (3) education spending relative to GDP at the beginning of the period. The level of income at the beginning of the period is expected to be negatively related to growth as growth rates are expected converge (or regress to the mean) with poorer countries growing more rapidly than richer countries. The latter two control variables are intended to control for investments in physical and human capital; both are expected to be positively related to growth.8

The two main variables of interest are: (1) number of years it took to reform by 2 points on the EFW index; and (2) the standard deviation of the reforms. In addition, we have included the level of the EFW index at the beginning of the reform period and the change in the EFW score during the reform period. Gwartney et al. (2006) have shown that the level of the EFW index is correlated with growth. Others, however, have debated whether EFW level variable should be included along with the change in the EFW index (Cole and Lawson 2007; De Haan and Sturm 2006; De Haan and Sturm 2007; Lawson 2006; Lawson and Murphy 2018). We see no harm in including it here as a control variable. We do not really expect much from the EFW change variable, as all of the countries in the sample have reformed by at least 2 points and there is not much variation above that level.
Turning to Table 3, the first regression runs the reform length without the standard deviation of the reforms; the second regression runs the standard deviation of the reforms without the reform length; and the third regression runs both. The same controls are used in all three regressions.
The overall explanatory power of the models is quite weak throughout, which is perhaps not too surprising given the similarities among these countries as reforming nations. The control variables, more or less, perform as expected. The coefficient on the level of the EFW at the beginning of the period is generally positive indicating that more economically free countries generally grew faster independent of the reforms, while the change in EFW is insignificant. The initial level of GDP per capita is negatively related to growth, as expected, though it is insignificant. Investment in physical capital is positive as expected, though human capital investment is not.
Of the two variables of interest, we find that the reform length is negatively related to growth, while the standard deviation of the reforms is insignificant statistically (though positive). A seven-year longer reform period, which is about one standard deviation, corresponds to about 0.8 percent in lower annualized growth. Thus, this is evidence in support of Jeffrey Sach’s view that faster reforms are preferred over slower ones. Finally, contra the argument advanced by Kazakevitch and Smyth (2005), there is no strong evidence here to support the view that broader or more microeconomic reforms are better than more narrow macroeconomic reforms.
Robustness Checks
As a robustness check, we considered countries that experienced a 1, 1.5, and 2.5 point increase in EFW rating.9 Using the same regression analysis as we did with countries that had a 2 point increase, we see similar results in these specifications presented in Tables 4 and 5. These results support our findings in Table 3 and suggest that it was not simply the 2 point increase that mattered for our results; rather, any meaningful increase in the EFW rating can represent an economic liberalization. When looking at our two variables of interest, the reform length remains significant and negative throughout, indicating that countries with faster reforms tended to grow more quickly than those with slower reforms. Likewise, the standard deviation of the reforms did not seem to be related to growth. This result means that the nature of the reform, or how comprehensive the reform was, did not have any meaningful impact on growth.


Since 1970 many countries have engaged in economic liberalization. They have lowered taxes, deregulated, removed barriers to international trade, reduced corruption, improved monetary stability, and privatized state-owned enterprises. While it is generally held that economic liberalization has improved economic performance (see, e.g., de Haan et al. 2006; Hall and Lawson 2014), there is still debate over how quickly reforms should be implemented. In particular, the question is whether the reforms should be enacted quickly via shock therapy or gradually.
Although there is something of a consensus that economic liberalization works to deliver faster growth rates, there is less agreement on whether reforms should be undertaken quickly or slowly, or if they need to be across the board or can be done more narrowly. Using the Economic Freedom of the World (EFW) index, we have identified 77 countries undertaking significant economic reforms since 1970. We find that countries that reformed more quickly grew more rapidly relative to slower reforming nations during and just after the period of their reforms. We did not find that broad macro- and microeconomic reforms were more growth enhancing than large but more narrowly targeted macroeconomic reforms.
Conclusion
Although there is something of a consensus that economic liberalization works to deliver faster growth rates, there is less agreement on whether reforms should be undertaken quickly or slowly, or if they need to be across the board or can be done more narrowly. Using the Economic Freedom of the World (EFW) index, we have identified 77 countries undertaking significant economic reforms since 1970. We find that countries that reformed more quickly grew more rapidly relative to slower reforming nations during and just after the period of their reforms. We did not find that broad macro- and microeconomic reforms were more growth enhancing than large but more narrowly targeted macroeconomic reforms.
References
Bolen, B., and Sobel, R. (2020) “Does Balance Among Areas of Institutional Quality Matter for Economic Growth.” Southern Economic Journal 86 (4): 1418–45.
Burakova, L., and Lawson, R. (2014) Georgia’s Rose Revolution: How One Country Beat the Odds, Transformed Its Economy, and Provided a Model for Reformers Everywhere. Guatemala: The Antigua Forum.
Cole, J., and Lawson, R. (2007) “Handling Economic Freedom in Growth Regressions: Suggestions for Clarification.” Econ Journal Watch 4 (1): 71–78.
De Haan, J., and Sturm, J. E. (2006) “How to Handle Economic Freedom: Reply to Lawson.” Econ Journal Watch 3 (3): 407–11.
__________ (2007) “Handling Economic Freedom in Growth Regressions: A Reply to Cole and Lawson.” Econ Journal Watch 4 (1): 79–82.
De Haan, J.; Lundstrom, S.; and Sturm, J. E. (2006) “Market-Oriented Institutions and Policies and Economic Growth: A Critical Survey.” Journal of Economic Surveys 20 (2): 157–91.
Friedman, M. (1962) Capitalism and Freedom. Chicago: University of Chicago Press.
Grier, K., and Grier, R. (2020) “The Causal Effect of Generalized Reforms: Resurrecting the Washington Consensus?” SSRN Working Paper No. 3580287.
Gwartney, J.; Holcombe, R; and Lawson, R. (2006) “Institutions and the Impact of Investment on Growth.” Kyklos 59 (2): 255–76.
Gwartney, J.; Lawson, R.; Hall, J.; and Murphy, R. (2018) Economic Freedom of the World: 2018 Annual Report. Vancouver: Fraser Institute.
Hall, T., and Elliott, J. (1999) “Poland and Russia One Decade after Shock Therapy.” Journal of Economic Issues 33 (2): 305–14.
Hall, J., and Lawson, R. (2014) “Economic Freedom of the World: An Accounting of the Literature.” Contemporary Economic Policy 32 (1): 1–19.
Kazakevitch, G., and Smyth, R. (2005) “Gradualism versus Shock Therapy: (Re)Interpreting the Chinese and the Russian Experiences.” Asia Pacific Business Review 11(1): 69–81.
Lawson, R. (2006) “On Testing the Relationship between Economic Freedom and Growth.” Econ Journal Watch 3 (3): 398–406.
Lawson, R.; Grier, K.; and Absher, S. (2019) “You Say You Want a (Rose) Revolution? The Effects of Georgia’s 2004 Market Reforms.” Economics of Transition and Institutional Change 27 (1): 301–23.
Lawson, R., and Murphy, R. (2018) “Economic Freedom and Growth Specification Debate: A Retrospective.” Applied Economics Letters 25 (15): 1038–40.
Liew, L. (1995) “Gradualism in China’s Economic Reform and the Role for a Strong Central State.” Journal of Economic Issues 29 (3): 883–95.
Marangos, J. (2003) “Was Shock Therapy Really a Shock?” Journal of Economic Issues 37 (4): 943–66.
Olson, M. (1965) The Logic of Collective Action: Public Goods and the Theory of Groups. Cambridge: Harvard University Press.
Rutland, P. (2013) “Neoliberalism and the Russian Tradition.” Review of International Political Economy 20 (2): 332–62.
Sachs, J. (2012) “What I Did in Russia.” Available at http://jeffsachs.org/2012/03/what-i-did-in-russia.
Sobel, R. (2017) “The Rise and Decline of Nations: The Dynamic Properties of Institutional Reform.” Journal of Institutional Economics 13 (3): 549–74.
About the Authors
Kerianne N. Lawson is a PhD student in the Department of Economics at West Virginia University. Robert A. Lawson is the Jerome M. Fullinwider Centennial Chair in Economic Freedom and Director of the O’Neil Center for Global Markets and Freedom at the Southern Methodist University’s Cox School of Business.

This work is licensed under a Creative Commons Attribution-NonCommercial-ShareAlike 4.0 International License.