Tyler Cowen (2020), in a controversial and widely discussed blog post, has argued that free economic institutions must be accompanied by state capacity to achieve maximal growth rates. He calls this “State Capacity Libertarianism,” which echoes positions he has posed previously (Cowen 2007, 2018). Besley and Persson (2011) can be perhaps seen as a direct predecessor. Criticisms immediately emerged, with Henderson (2020) arguing that Cowen’s specific proposals are in direct conflict with libertarianism, and with minor caveats, free economic institutions are already able to achieve the goals Cowen hopes to achieve with state capacity. Geloso and Salter (forthcoming) argue that the lack of examples of wealthy countries with weak states is due to survivorship bias, and they apply their argument to criticize Cowen (Geloso and Salter 2020). Caplan (2018), while not directly addressing State Capacity Libertarianism, argues that there is little reason to believe that the effects of state capacity are the result of strong states themselves, rather than the social and cultural factors that allowed a strong state to emerge in the first place. The purpose of this article is to put data to the question of the individual effects of state capacity and free economic institutions on economic performance, and the potential interaction between the two.
State capacity can be decomposed, primarily, into two broad sets of concepts. The first is fiscal capacity, which is the ability of a state to raise revenue should it need to; additionally, states higher in fiscal capacity are able to raise revenue in a more efficient manner. The second is to play a market-supporting role. At minimum, this is to mean legal capacity, which in libertarian terms would mean for the country to be capable of running a night watchman state efficiently and effectively. But “supporting markets” could encapsulate enforcing certain kinds of regulations, the provision of public goods, or fixing externalities. The emphasis is not how far the state goes in terms of actually performing any of these tasks, but how well it is able to accomplish these tasks, should it attempt to. Savoia and Sen (2015), Johnson and Koyama (2017), Berwick and Christia (2018), and Piano (2019) offer reviews of the literature from alternative perspectives.
This article’s approach to assess State Capacity Libertarianism is to test the effects of economic freedom and state capacity, and their interaction, on economic growth using a series of regressions employing panel data. While panel analysis which tests the effects of institutions on economic performance is very common, the literature on state capacity tends to have a more historical flavor. In contrast, we make use of two contemporary measures of strong state institutions which have a limited time element, in addition to two less conventional measures, one of which originates with Murphy (2019) and the other of which is original to this paper. The use of a control for output per capita and country-level fixed effects accounts for some of the immediate concerns of State Capacity Libertarianism’s critics: that the effect of state capacity is the result of backwards causality, or that cultural variables underlie state capacity. We do not find strong support for State Capacity Libertarianism, but we also do not find that state capacity plays no role in economic development. When considering our findings as a whole, we conclude that, as a first approximation, state capacity and economic freedom are substitutes for one another.
Before commencing with our analysis, we will first put state capacity in a broader context to help motivate our project. The state capacity perspective is actually a rather natural outgrowth of the seminal work done by North and Weingast (1989) and North (1990) which highlights the importance of the Glorious Revolution as the turning point in the modern history of Britain, and therefore, the origins of world economic growth. But while the work of North and his co-authors point most strongly to the Glorious Revolution leading to much stronger protection of property rights, the most tangible outcome of the Glorious Revolution may have been to allow the state to raise more tax revenue (Cox 2012). That is to say, the Glorious Revolution created much higher fiscal capacity.
Recognizing this, subsequent literature has found the two aspects of state capacity to be strongly intertwined (Besley and Persson 2009; Karaman and Pamuk 2013). A broad conclusion of the literature is that an external threat, such as the need to fight wars, causes states to invest in fiscal capacity, the investment of which allows states to gain other capabilities (Besley and Persson 2008, 2009, 2010; Dincecco and Prado 2012; Karaman and Pamuk 2013; Gennaioli and Voth 2015), and these institutions ultimately lead to economic growth (Acemoglu et al. 2016; Dincecco and Katz 2016). While institutions protecting property rights may appear to be what is wholly driving these positive results, provocatively, Irigoin and Grafe (2012) have gone as far as arguing that development in Spain was held back due to too little fiscal capacity relative to legal capacity. And one of the most important recent works in political economy, Acemoglu and Robinson’s (2019) The Narrow Corridor, in effect argues that economic development requires state capacity to exist in some form of balance with the power of civil society, so that they can complement one another rather than one overwhelming the other.
State Capacity Libertarianism is the latest in a series of fusions of libertarianism with more conventional political ideologies, which began itself with Fusionism: the fusion of libertarianism with conservatism (see Meyer 1996). Much later, in reaction to the dominance of Fusionism within the libertarian movement, a series of academics and public intellectuals argued for “liberaltarianism,” which blended libertarianism and left-liberalism (Lindsey 2006; Tomasi 2012: 162–63). Since then, there has been an attempt to rejuvenate the word “neoliberalism,” which historically was largely used as a pejorative, as a means to somewhat moderate libertarianism in an ideologically ambiguous way, while emphasizing a belief in modern institutions (Bowman 2016; Murphy 2020: 161; Tait 2020). Cowen (2020) explicitly links State Capacity Libertarianism to liberaltarianism, while its relationship to “neo-neoliberalism” is readily apparent as well.
State Capacity Libertarianism, however, comes in direct conflict with certain strands of literature in political economy holding that state enforcement of property rights is redundant in the context of private institutions and norms (Stringham 2015; Williamson 2011) or is actively counterproductive (Benson 1990; Leeson 2014; Leeson and Harris 2018). The idea that free economic institutions must be paired with strong state institutions is anathema to this point of view. The aforementioned Geloso and Salter (2020) are working in this tradition in their criticism of State Capacity Libertarianism, while their formal work (forthcoming) confronts state capacity more directly than the tradition has confronted it previously.
The article is structured as follows: first, we discuss our measures of state capacity, the data sources, and empirical model; second, we report our regression results; third, we interpret the regression results while taking into account the effects of the interaction term; finally, we offer some concluding remarks.
Measures of State Capacity
How can state capacity be quantified? In this section we describe four measures of state capacity: (1) the Government Effectiveness measure from the Worldwide Governance Indicators (Kaufmann et al. 2009, 2010); (2) the average of Government Effectiveness and Control of Corruption; (3) a new index constructed using data from the Varieties of Democracy dataset; and (4) a measure of the strength and power of states from Murphy (2019). Each of these variables possesses a fair amount of cross-sectional and time series variation in a panel, which will be necessary for our empirical approach.
Three fundamental aspects of state capacity are emphasized in the literature: the ability of the state to support markets (which in terms of measurement closely overlaps with the quality of bureaucracies), the state’s fiscal capacity, and to a lesser extent, the state’s monopoly on violence. The first of these, intuitively, is inclusive of the enforcement of property rights. But more broadly, it should be thought of as the state’s capability to do what attempts to do, whether that means enforcing property rights, building an electrical grid, or building a road. Sweden and Singapore are both strong in this, even though Sweden does much more than Singapore. Fiscal capacity is the degree to which the state is able to raise revenue from those living under its control. A state will not have the capacity to compensate a professional bureaucracy or provide public goods if it lacks the capacity to raise revenue through taxation. Finally, as Olson (2002) describes, without a monopoly on coercion (and control of its territory), the threat of violence or violence itself increases the risk of expropriation and reduces the incentives to invest in productive activities (North 1990; Collier 1999).
Government Effectiveness
Government Effectiveness, like other elements of Worldwide Governance Indicators is created using a pastiche of outside sources, which documentation separates into “representative” and “non-representative” sources. Those that are representative pertain primarily to the quality of the bureaucracy and the quality of the provision of public goods and originate with The Economist Intelligence Unit, the Global Competitiveness Report, the Gallup World Poll, the Institutional Profiles Database, the Political Risk Services’ International Country Risk Guide, and Global Insight Business Conditions and Risk Indicators. In the documentation, Government Effectiveness is defined as,
Government effectiveness captures perceptions of the quality of public services, the quality of the civil service and the degree of its independence from political pressures, the quality of policy formulation and implementation, and the credibility of the government’s commitment to such policies.1
Average of Government Effectiveness and Controls of Corruption
While cross-sectional data coverage is strong, it begins only in 1996, and earlier years of Worldwide Governance Indicators had weaker data coverage. The measure directly addresses whether the state is able to perform the tasks it sets out for itself, but it only indirectly addresses the question of fiscal capacity. That is to say, it captures fiscal capacity insofar as the government would not have fiscal capacity were it couldn’t raise the revenue to accomplish these tasks.
State-building, conceptually, has been a point of emphasis for Fukuyama (2004, 2011, 2014) as a key aspect of the story of economic development. Fukuyama (2014: 61–63) combines Government Effectiveness with another element of Worldwide Governance Indicators, Control of Corruption. We follow Fukuyama in using the average of the two indicators as our second measure of state capacity. The benefits and drawbacks to using this measure are similar to using Government Effectiveness alone, with the drawbacks being a lack of a lengthy time dimension and no direct measure of fiscal capacity.
A New State Capacity Index
Our third measure is a novel application of the vast database of institutional information found in the Varieties of Democracy (V‑Dem) dataset. Our index attempts to measure the characteristics of state capacity discussed above: fiscal capacity, the provision of public goods, and a monopoly on violence. The V‑Dem dataset contains measures closely related to the first three concepts, for a large number of countries, and an extremely lengthy time dimension. The creation of this measure may actually be an important contribution of this paper,2 but it was motivated by the desire to use a denser and lengthier measure of state capacity than Government Effectiveness.3 The better data coverage from the state capacity index constructed using the V‑Dem data allows for the analysis of state capacity over many decades. All variables in the state capacity index from the V‑Dem dataset are coded by multiple country experts with scholarly or professional knowledge of the country. The scores from the county experts are then aggregated by a Bayesian response measurement model.
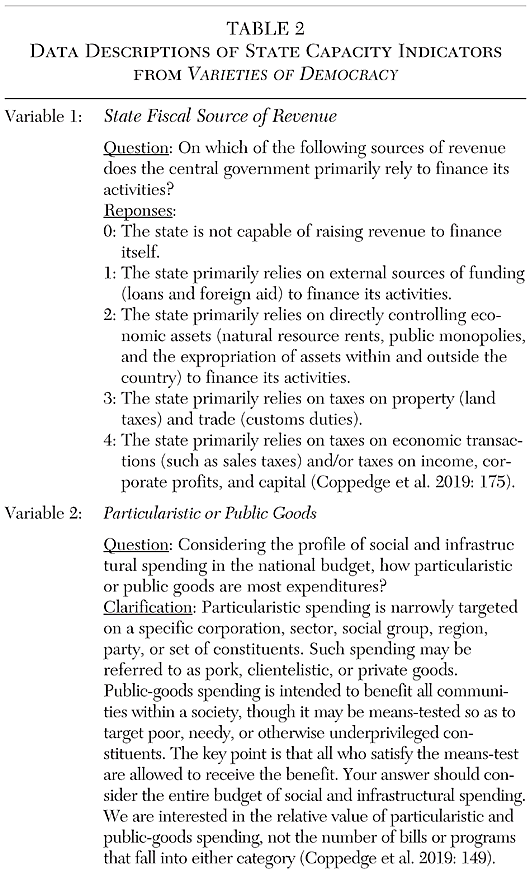
Constructing an index from variables in the V‑Dem dataset allows us to include a more direct measure of fiscal capacity. We use the variable, “state fiscal source of revenue,” which measures “on which … sources of revenue does the central government primarily rely to finance it activities?” Governments receive a low score if the state is not capable of raising revenue or relies on outside revenue, but receives a high score if the state raises revenue through modern means of taxation. See Table 2 for a full description of the variable and the other V‑Dem variables that follow.
To measure the provision of public goods, we include a variable that assesses the degree to which the national government spends on “particularistic” goods or on “public goods.” States receive a low score if state expenditure is clientelistic, favoring specific groups in society. States receive a higher score if they spend on public goods broadly, defined as “spending intended to benefit all communities within a society” (Coppedge et al. 2019: 149).
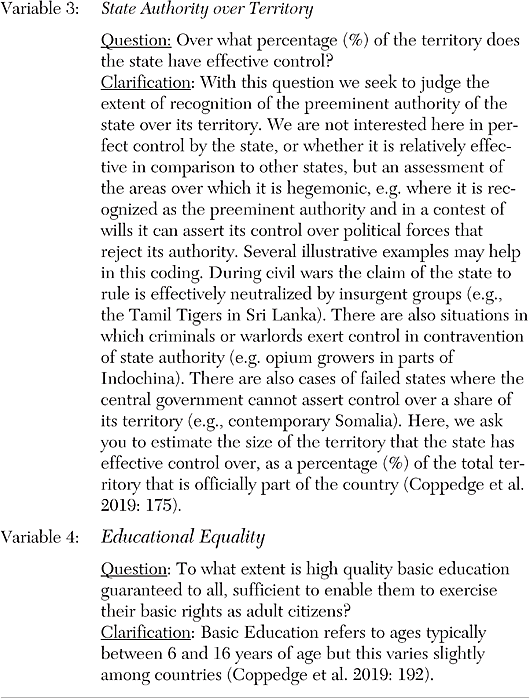
The third variable is closely related to the state’s monopoly on coercion: a measure of state authority over its territory. This variable measures the percentage of territory that the state maintains effective control; more specifically “where it [the state] is recognized as the preeminent authority and in a contest of wills it can assert its control over political forces that reject its authority.” States with contested territory, civil conflict, or regions in which their authority is challenged receive lower scores.
As an additional measure of the state’s ability to accomplish tasks, we include data on educational equality. This seeks to measure “[t]o what extent is high quality basic education guaranteed to all, sufficient to enable them to exercise their basic rights as adult citizens?” We do not think that this variable is primarily about human capital. While one can debate the merits of government involvement in education, the fact is that the governments of all countries either attempt to provide basic schooling, or would if they had the state capacity to do so. The variation that exists between countries is whether the state is capable of running such a system and able to fund it.
Moreover, we construct the new state capacity index by taking the first principal component of the four measures from V‑Dem given above. Details on the principal component analysis can be found in the Appendix. The variation that the method ought to be capturing, then, is competent governance, not human capital. In sum, this novel measure of state capacity contains rather direct measures of fiscal capacity, the state’s monopoly on violence, and the quality of the bureaucracy, and the provision of public goods (or what is thought of as a public good). The novel state capacity index is available from 1970 to 2010 for a wide, unbalanced panel of countries.4
State Economic Modernity Index
As a final measure of state capacity, we use the “State Economic Modernity” index from Murphy (2019), which circumvents the issue of measuring fiscal capacity by replacing it simply with how large the state is relative to the economy. It also zeroes in on the legal system and the protection of property rights, instead of measuring the quality of the bureaucracy or the provision of public goods that are of more tertiary importance for the support of markets. What this yields is something that is not exactly state capacity; it is better thought of as the economic institutions associated with social democracy. The data is all derived from the Economic Freedom of the World index, so its data coverage has a nearly perfect overlap with this variable, which is our primary other variable of interest. As such, data coverage is available for State Economic Modernity from 1970-present.
Economic Freedom Data and Empirical Model
Our other primary data of interest is economic freedom data from the Economic Freedom of the World dataset (Gwartney et al. 2019).5 The dataset includes forty-three variables falling into one of five areas of economic freedom: [limited] size of government, the quality of the legal system and property rights, sound money, the freedom to trade internationally, and [limited] regulation. All data are scaled from 0–10, with “ten” always corresponding to more economic freedom. A literature review of what economic freedom causes can be found in Hall and Lawson (2014), while a literature review of what causes economic freedom can be found in Lawson et al. (2018). A wide variety of earlier research has shown the positive effect of economic freedom on output growth, revealing it to be robust and empirically important; for instance, see Gwartney et al. (1999), de Haan et al. (2006), Gwartney et al. (2006), Bennett et al. (2017), Zhang et al. (2018), and Murphy and O’Reilly (2019).
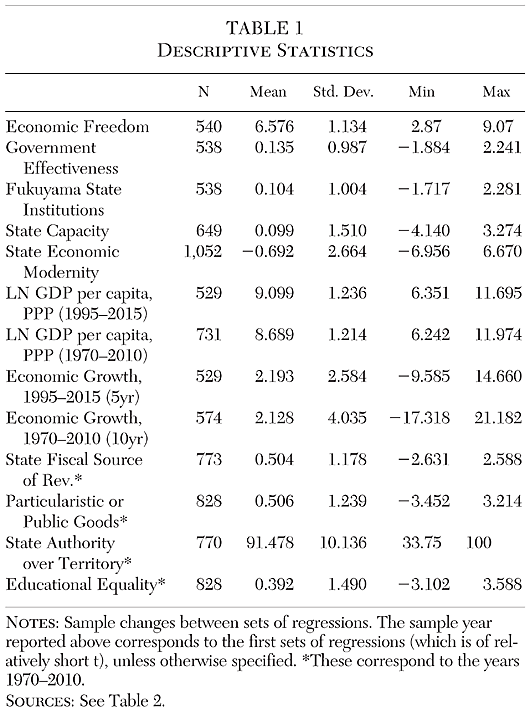
Our control variable is PPP-adjusted real GDP per capita. Our data source in regressions with a shorter panel is World Development Indicators, while we make use of the Penn World Table (Feenstra et al. 2015) for the lengthier panel because it has a single consistent series which is PPP adjusted.6 Table 1 presents descriptive statistics for all variables described in this section and Table 2 provides sources.
To test the hypothesis that state capacity and economic freedom complement each other we estimate a panel growth regression as described by Equation 1.
(1) gi,t+a = αefwit + βstateit + γefwit ×
stateit + δlngdpit + µi + τt + εit
The annualized economic growth rate, from year t through year t+a, is git+a, where a can take values of 5 or 10 depending on the regression. It is regressed on measures of economic freedom, efwit, and various measures of state capacity, stateit. An interaction term between economic freedom and state capacity, efwit × stateit captures the possibility of a complementary relationship between the two concepts as suggested by State Capacity Libertarianism.
Each set of regressions includes a baseline specification with the log of GDP per capita as a control to account for growth convergence. The most complete specifications also include country and time fixed effects. Time fixed effects account for shocks common to all countries. Specifications with country fixed effects should assuage concerns of omitted time invariant factors such as geography and slow changing aspects of culture or norms, important for, for example Caplan (2018).
Worldwide Governance Indicators becomes available in 1996, and as such the baseline estimates in Table 3 through 5 are conducted on a sample from forward-looking five-year annualized growth rates from 1995 to 2010. The 1996 data stands in for 1995 and the year 2010 cross-section of observations is used to predict growth from 2010 to 2015. Estimates using the new state capacity index and “State Economic Modernity” are conducted using ten year annualized growth rates from 1970 to 2000 and the year 2000 cross-section of observations is used to predict 2000-10. After a baseline model with no interaction term, all subsequent regressions contains estimates for economic freedom, state capacity, and their interaction. The marginal effect of each set of institutions (i.e., inclusive of the interaction, and conditional on the value of the other set of institutions) will be presented graphically in the subsequent section of this article. The interaction term between them will allow us to perceive any complementarity or substitutability there are between them, thereby “Assessing State Capacity Libertarianism.”
Regression Results
Table 3 provides the baseline results using Government Effectiveness as the measure of state capacity, while excluding the interaction term. In these regressions neither set of institutions is actually statistically significant in the two specifications without country fixed effects. When country fixed effects are included, as in Regression 3 and Regression 4, economic freedom immediately is positive and enters with the expected sign. However, Government Effectiveness enters each of these specifications negatively, while achieving statistical significance at the 10 percent level when time fixed effects are excluded. Including Table 3 is purely expository and to be used as a point of comparison and is not itself an assessment of State Capacity Libertarianism.
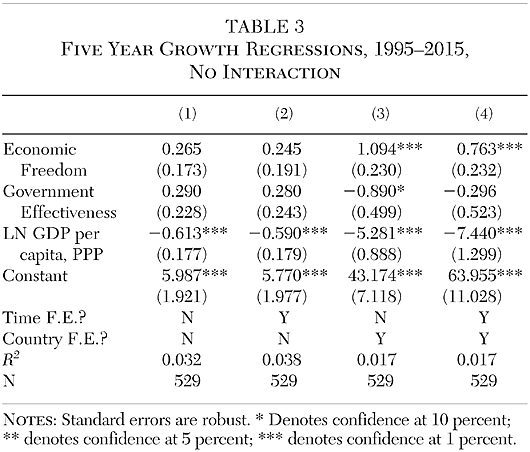
Table 4 relaxes the restriction on the interaction between economic freedom and Government Effectiveness. With the inclusion of the interaction, the coefficient on Government Effectiveness is positive and statistically significant in the two specifications excluding country fixed effects. When country fixed effects are excluded, economic freedom is not statistically significant. With country fixed effects included and time fixed effects excluded, economic freedom is significant while Government Effectiveness is not (its coefficient size remains about the same, however). When both country and time fixed effects are included, both are positive and statistically significant. However, given the inclusion of the interaction term, none of these individual effects should be interpreted independently; the effect of economic freedom on economic growth is contingent on the value of state capacity, and the effect of state capacity on economic growth is contingent on economic freedom.
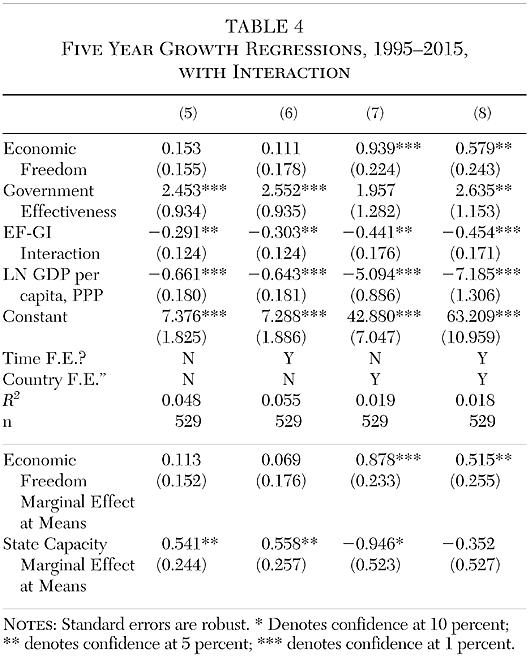
The relationship hypothesized by State Capacity Libertarianism can be assessed by considering the effects of each institutional variable across the full distribution of the other institutional variable. Before presenting the set of effects across the full distribution, for each specification we consider the effect of economic freedom at the average level of state capacity, and the effect of state capacity for the average level of economic freedom. These marginal effects at the mean values of other variables are a way of assessing if the effect is statistically significant for typical values of the other interacted variable. For example, the effect of economic freedom at the mean level of state capacity in Regression 8 is positive and statistically significant, whereas the effect of state capacity at the average level of economic freedom is not statistically significant. Marginal effects at the means will be reported for each subsequent regression in this paper.
In all four specifications of Table 4, the interaction term between the two sets of institutions is negative and statistically significant. The sign for each of the institutions remains positive in all four specifications as well. However, all three variables of interest are statistically significant in Regression 8. The effect of economic freedom on economic growth, at the mean level of state capacity, is 0.52 and is statistically significant, whereas the effect of economic freedom if not conditioned on state capacity (as in Regression 4) is 0.76. The smaller magnitude indicates that conditioning on an average level of state capacity reduces the effect of economic freedom on growth, running counter to the expectation of State Capacity Libertarianism. This marginal effect at the mean is a preview of the more complete set of effects of economic freedom at different levels of state capacity and the effects of state capacity at different levels of economic freedom, which are presented in Section IV.
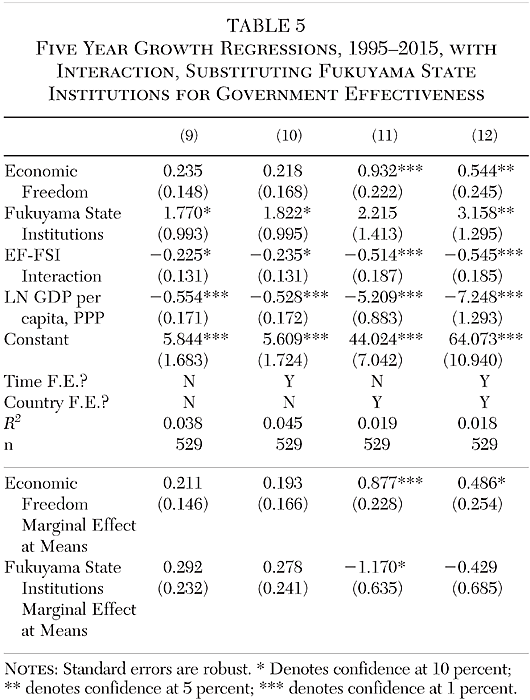
Regressions 5–7 offer only weak support for what we find in Regression 8, the positive effect of each institution individually with a negative interaction. The question then is whether the pattern that is observed in Regression 8 is specific to choosing the time frame and countries we happened to observe. To begin answering that, we make a minor change in definition from Government Effectiveness as state capacity to what Fukuyama assesses (as discussed above) as strong state institutions as state capacity. This alternative measure averages the WGI Government Effectiveness indicator with the WGI Control of Corruption indicator. The results using this alternative measure can be found in Table 5, which are very similar to what we found in Table 4. The two sets of institutions perform unevenly in terms of statistical significance in the three specifications which do not include both country and time fixed effects. However, once both sets of fixed effects are included, as in Regression 12, economic freedom, Fukuyama’s measure of strong state institutions, and the interaction term between the two exhibit the same signs and significance, as we saw in Regression 8.
The change in data was relatively minor between Table 4 and Table 5. Now we will change the data source for state capacity entirely, consider a different (though overlapping) period, and use a different data source for PPP adjusted Real GDP per capita. The source of the data, as discussed in Section II, is the first principal component of four variables from the Varieties of Democracy dataset. Since the time dimension of Varieties of Democracy is so extensive, state capacity is no longer the binding constraint on the sample. As a result, the first year used is instead 1970, corresponding to the first year of Economic Freedom of the World data. Given the larger number of years available, we will also use ten-year annualized growth rates instead of five-year annualized growth rates, which terminates the analysis in 2010.
While the results in Table 6 do not match the same pattern of statistical significance, all point estimates have the same sign as what was found in Table 4. The inclusion of fixed effects diminishes the size of the point estimates, and significance is weaker in Regression 16 (although the standard errors remain roughly the same across the four specifications). Similarly, the marginal effect of economic freedom at the mean of state capacity and the marginal effect of state capacity at the mean of economic freedom are positive and significant in all specifications except Regression 16. As we see from the effect at means and will see in following section, the exact statistical significance of the regression coefficients is not of particular importance, since the marginal effects of economic freedom and state capacity, and the significance of those marginal effects, differ.
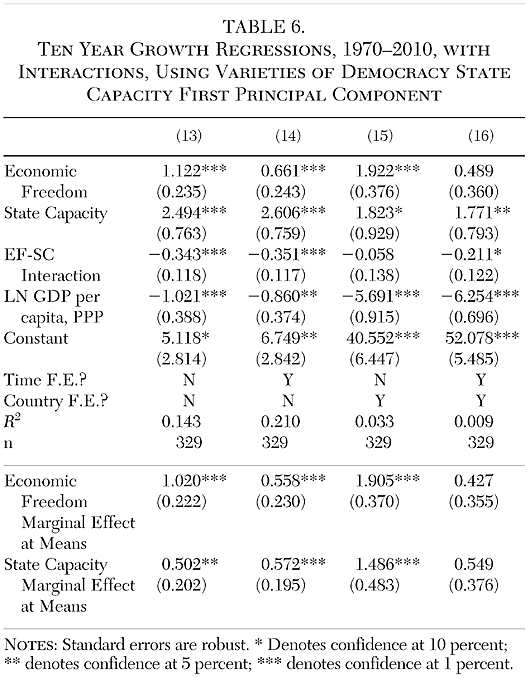
Table 7 is one final attempt at testing the hypothesis, and this test fails. Using “State Economic Modernity,” as its measure of state capacity, with growth regression specifications nearly identical to Murphy (2019), we find what was found previously using the State Economic Modernity data – that its relationship with growth is not robust to the inclusion of fixed effects. The inclusion of the interaction term, as in Table 7, does not alter the relationship. In these regressions, economic freedom has a clear, robust relationship with growth, but State Economic Modernity does not.
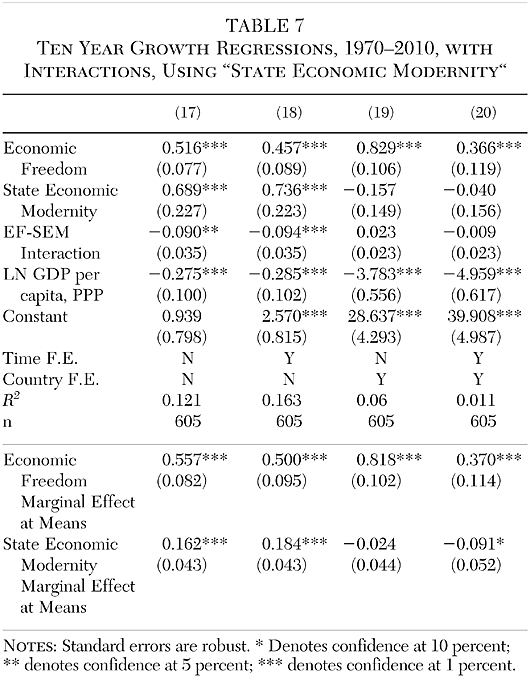
State Economic Modernity can be interpreted as state capacity, given teeth: not only do we want the state to be capable of performing tasks, but we want the state to actually accomplish them. Whether this is a good test of “State Capacity Libertarianism” depends on how it is read—does “State Capacity Libertarianism” mean we wish to “get to Denmark?” If so, State Economic Modernity may actually be the more appropriate measure. The list of items that Cowen (2020) wishes the state to accomplish, including science subsidies and the space program, goes well beyond “supporting markets,” even if we grant the existence of technological spillovers. But we do not find any evidence that this particular set of institutions matters for growth or that they somehow interact with economic freedom. The more narrowly circumscribed measures of state capacity seem to play a role, not State Economic Modernity.
Throughout Tables 4–7, we note that results at the mean values actually are clearly more positive for economic freedom than they are for state capacity; if one were to interpret these results were as horseraces, economic freedom would be the better of the two performers. However, in the following section, we will examine the complete meaning of the interaction between economic freedom and state capacity in greater detail, which will give a sense of the effects of each variable over the “full house” of the distribution of the other, as opposed to merely the mean (see Gould 1996). We view these as the main results of the paper.
Interpretation of Marginal Effects
To fully interpret the results, we calculate the marginal effects of each set of institutions, conditional on the value of the other set of institutions. We also calculate the statistical significance of the marginal effects. We perform these calculations for the first three measures of state capacity, not “State Economic Modernity,” since the pattern was not observed for the latter, and we use the specifications which include both country and time fixed effects. These specifications correspond to Regression 8, Regression 12, and Regression 16.
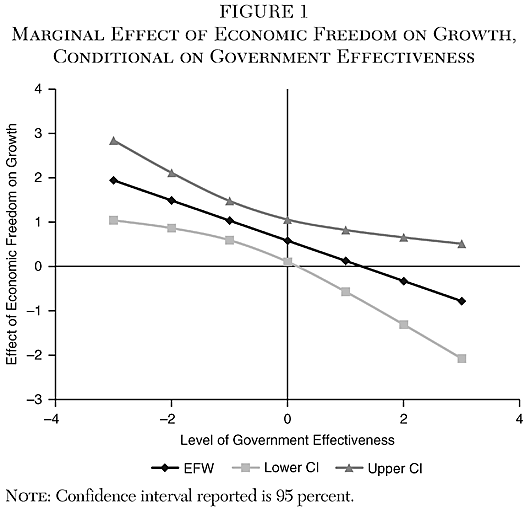
Government Effectiveness is expressed as a z‑score. Nearly all observations will appear between a z‑score of −2 and +2. We report the effect of economic freedom, therefore, conditional on Government Effectiveness, over the interval [−3,3]. This is found in Figure 1. The marginal effect of economic freedom is positive and statistically significant (i.e., the lower band of the 95% confidence interval is greater than zero) when Government Effectiveness takes values of −3, −2, −1, and 0. Note that the confidence bands expand around the point estimate at values further from the mean, as the estimates away from the mean are less precise due to the lack of density of data found there. A similar pattern will persist throughout the rest of these calculations. For the lowest values of Government Effectiveness, the effect of a unit increase in economic freedom is to increase in the average annual growth rate of almost 2 percentage points, whereas the effect is only about one half of a percentage point for middling values of Government Effectiveness. The effect is insignificant for values of Government Effectiveness above zero, with the point estimate falling to negative shortly after Government Effectiveness goes above one.
Economic Freedom can hypothetically run from 0 to 10. Few countries receive scores in practice above 8; fewer still receive scores below four. In the most recent data, one country (Venezuela) receives a score below 4 (actually 2.58); ten countries score above 8 and none score above 9. We therefore report the effect of Government Effectiveness conditional on economic freedom for values of economic freedom from three to ten. This is found in Figure 2. Over this interval, the marginal effect of Government Effectiveness is statistically significant for no value except when economic freedom is ten, at which point it is actually negative and statistically significant. We should note, however, that were we to report marginal effects of Government Effectiveness on still lower levels of economic freedom, it would be positive and statistically significant.
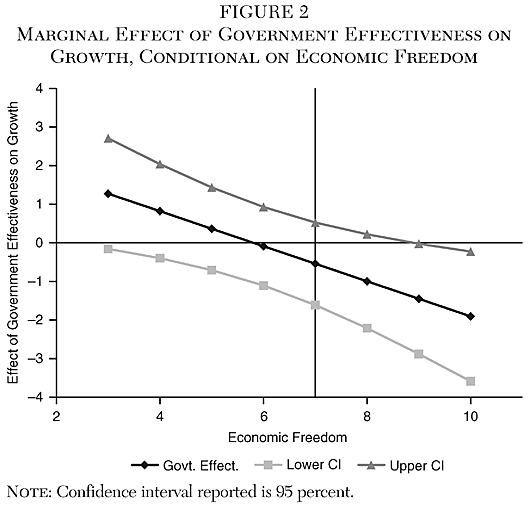
Figure 3 and Figure 4 report the same results while swapping in the definition of strong state institutions from Fukuyama. At low levels of strong state institutions (the scale is an average of two z‑scores, so the [−3,3] interval is kept), economic freedom is once again statistically significant and positive, while at high levels it is statistically insignificant. And while the same pattern emerges for the marginal effects of Fukuyama’s strong state institutions as we observed for Government Effectiveness alone, the effect is not significant for any level of economic freedom within the distribution.
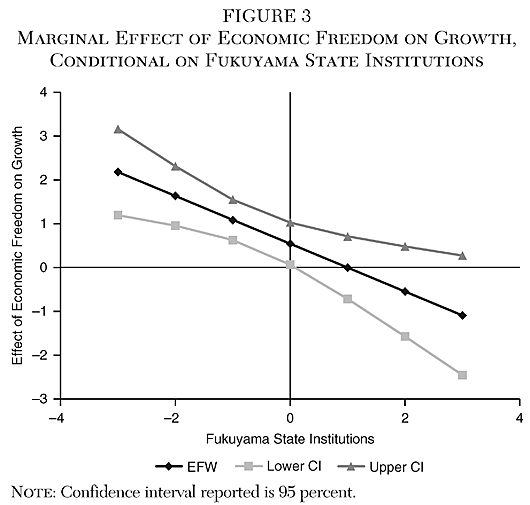
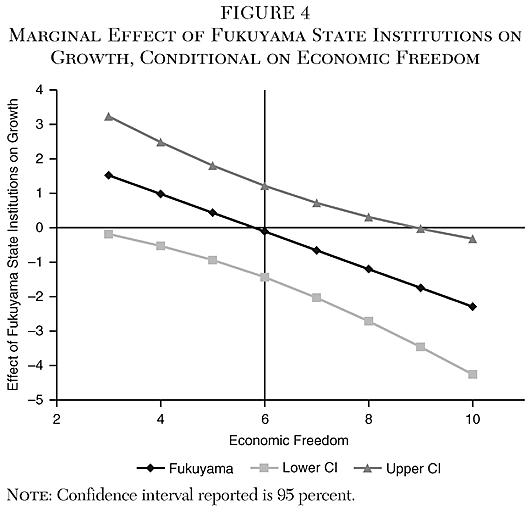
These results indicate that the effect of economic freedom declines as state capacity increases. They also indicate that the effect of state capacity declines as economic freedom increases, though the effect is not significant for most levels of economic freedom. Rather than state capacity complementing economic freedom as a determinant of growth, the results indicate that at low levels of institutional quality, these sets of institutions may substitute for one another.
Figure 5 calculates the effect of economic freedom conditional on the measure of state capacity derived from Varieties of Democracy. (The [−3,3] scale used is again the same.) In this case, the marginal effect of economic freedom is only statistically significant at 5% at very low levels of state capacity. (With a weaker standard of significance, it remains significant.) Similarly, the marginal effect of State Capacity, as found in Figure 6, achieves statistical significance at very low levels of economic freedom. A one unit increase in state capacity corresponds to about a 1 percentage point increase in average annual economic growth; however, as economic freedom increases, the effect of state capacity declines and loses statistical significance.
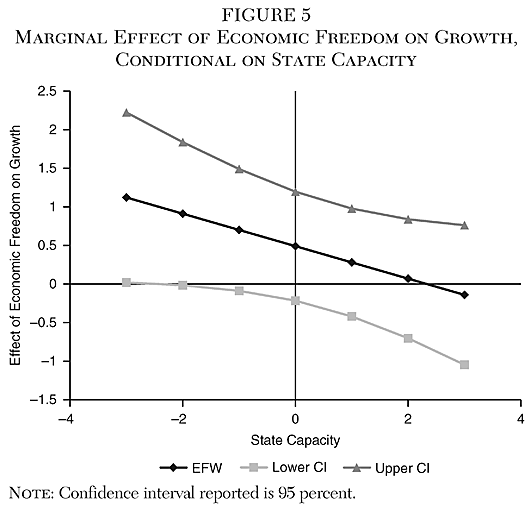
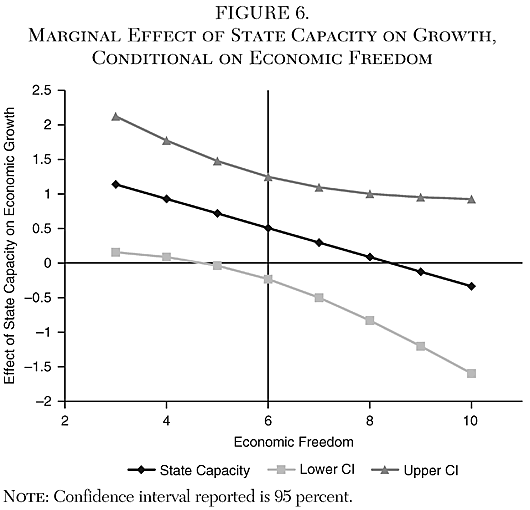
Figures 1-6 are the main results of the paper: the effect of each kind of institutions is strongest when the other is very weak. But the results should not be taken too literally. We doubt that a methodology geared more towards identifying the effects of the institutions themselves (as opposed to investigating their interrelationship) would find negative point estimates. What this investigation has yielded isn’t so much that state capacity or economic freedom is superior to one another, but that their effects are, in fact, intertwined.
In some sense, this is consistent with the message of “State Capacity Libertarianism.” In another, it is a rejection of it. Rather than yielding especially strong growth rates when one gets both sets of institutions “right,” or even merely an additive effect between the two, state capacity and economic freedom substitute for one another. Countries that have had either economic freedom or state capacity in the recent past have seen higher rates of economic growth, but getting more state capacity when you already have lots of economic freedom does not lead to faster economic growth.
It is worth noting, however, that it appears to be far easier to obtain more economic freedom than it is to obtain more state capacity. Getting more economic freedom is as easy as turning the dial on a tariff rate; the only constraint to doing so is the political process. Meanwhile, a facetious way of describing how to achieve more state capacity is that no one has any idea how. A more serious way of describing it is that development economists have a certain set of strategies that they believe will work for building state capacity (Andrews et al. 2017), but it’s a serious issue that developing countries will actually devise strategies to fake state capacity in order to please intergovernmental organizations (Pritchett et al. 2013), because that is actually easier than building state capacity.
Secondly, while the marginal effects we ultimately conclude with are hardly ringing endorsements for the essential importance of state capacity in the story of economic development, they do not comport well with the arguments of some of the critics of State Capacity Libertarianism. For example, at least when considering how state capacity varies across countries and time since 1970, its relationship with economic performance is not driven entirely by reverse causality, which contradicts some of the framing of Geloso and Salter (2020). And to the extent that cultural variables over the relevant time interval are captured by country fixed effects, culture is not driving the relationship either. This contradicts part of the argument from Caplan (2018). Whatever the limits of our panel analysis, we find that state capacity can increase economic growth under certain conditions are robust to concerns about backwards causality (GDP per capita is controlled for) or culture or culture-adjacent variables (which are largely, though not unfailingly, addressed with country fixed effects). To recapitulate, our results are at odds with claims that state capacity is an unambiguous cause of growth, but it seems to have some role to play, if an auxiliary one, that remains after controlling for both the initial wealth and culture of a country.
Conclusion
Cowen (2020) proposes that free institutions are an insufficient condition for achieving maximal growth, and contends that the missing ingredient is a stronger, more capable state. A long-standing literature has shown that free economic institutions have a positive effect on growth, while the literature on state capacity has similarly shown robust relationships in the recent literature that has tested it. While Cowen’s position has drawn rapid criticism, we test his hypothesis using an interaction between the two sets of institutions.
Using four measures of state capacity, one of which is wholly novel to this article, we find that each set of institutions has a role to play in causing economic growth, and that they are interrelated. However, when taking into account the interaction term, we find that each set of institutions has its strongest effect when the other is weakest. The effect of more state capacity when economic freedom is already high is not one of complementarity, nor is it even additive. Rather, state capacity and economic freedom appear to be substitutes for one another.
The Government Effectiveness data from Worldwide Governance Indicators is easily accessible, is of high quality, and is a reasonable means of assessing state capacity. Our own new method of measuring state capacity is not as extensively vetted, but it is a large panel of data that would allow one to measure the effect of state capacity in many other ways. Our results hold for three of the four measures of state capacity, but they do not hold for “State Economic Modernity.” Ultimately, we suggest that, if the debate on State Capacity Libertarianism continues, it should follow the other literature on the topic of institutions and growth and focus on quantitative comparisons, as we have done here.
Appendix: Principal Component Analysis
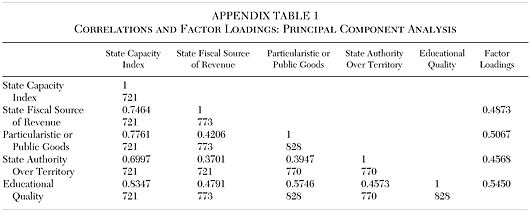
The four components of our state capacity index are combined using principal component analysis. By accounting for the covariance between variables, principal component analysis reduces the dimensionality of a set of variables while maintaining the maximum variance. Alternatively, the first principal component condenses the four component variables into one score that preserves as much information as possible. The next principal component is orthogonal to the first and contains the maximum amount of variation not explained by the first component. Eigenvalues from our analysis indicate that the first principal component explains close to 60 percent of the total variation of the four variables, whereas none of the remaining three components explain more than 17 percent of the variation.
How well does the State Capacity index constructed from first principal component capture information contained in all four of the underlying variables? Appendix Table 1 presents correlation coefficients and factor loadings, which measure the variance of each variable explained by the new index. Factor loadings range between 0.55 for the equality of education variable to 0.46 for the state control over territory variable. Therefore, our state capacity index has a positive association with each of the underlying variables, and the amount of variation explained in the analysis is similar for all variables (an indication that state capacity index is not disproportionately derived from just one of the underlying variables). Similarly, the correlation coefficients in Appendix Table 1 between individual components and our state capacity index are all positive and at least 0.70. The State Capacity index constructed from the first principal component is a convenient summary of the underlying variables that correspond to various aspects of state capacity.
References
Acemoglu, D.; Moscona, J.; and Robinson, J. A. (2016) “State Capacity and American Technology: Evidence from the Nineteenth Century.” American Economic Review 106 (5): 61–67.
Acemoglu, D., and Robinson, J. A. (2019) The Narrow Corridor: States, Societies, and the Fate of Liberty. New York: Penguin Press.
Andrews, M.; Pritchett, L.; and Woolcock, M. (2017) Building State Capability: Evidence, Analysis, Action. New York: Oxford University Press.
Bennett, D.; Faria, H; Gwartney, J; and Morales, D. (2017) “Economic Institutions and Comparative Economic Development: A Post-Colonial Perspective.” World Development 96 (August): 503–19.
Benson, B. (1990) The Enterprise of Law: Justice without the State. San Francisco: Pacific Research Institute.
Berwick, E., and Christia, F. (2018) “State Capacity Redux: Integrating Classical and Experimental Contributions to an Enduring Debate.” Annual Review of Political Science 21: 71–91.
Besley, T., and Persson, T. (2008) “Wars and State Capacity.” Journal of the European Economic Association 6 (2–3): 522–530.
__________ (2009) “The Origins of State Capacity: Property Rights, Taxation, and Politics.” American Economic Review 99 (4): 1218–44.
__________ (2010) “State Capacity, Conflict, and Development.” Econometrica 78 (1): 1–34.
__________ (2011) Pillars of Prosperity: The Political Economics of Development Clusters. Princeton, N.J.: Princeton University Press.
Bowman, S. (2016) “I’m a Neoliberal. Maybe You Are Too.” Medium. Available at https://medium.com/@s8mb/im-a-neoliberal-maybe-you-are-too-b809a2a588d6 (April 5).
Caplan, B. (2018) “‘State Capacity’ Is a Sleight of Hand.” Econlog. Available at www.econlib.org/state-capacity-is-sleight-of-hand/ (June 5).
Collier, P. (1999) “On the Economic Consequences of Civil War.” Oxford Economic Papers 51 (1): 168–83.
Cowen, T. (2007) “The Paradox of Libertarianism.” Cato Unbound. Available at www.cato-unbound.org/2007/03/11/tyler-cowen/paradox-libertarianism (March 11).
__________ (2018) Stubborn Attachments: A Vision for a Society of Free, Prosperous, and Responsible Individuals. San Francisco: Stripe Press.
__________ (2020) “What Libertarianism Has Become and Will Become: State Capacity Libertarianism.” Available at www.marginalrevolution.com (January 1).
Coppedge, M.; Gerring, J.; Knutsen, C. H.; Lindberg, S. I.; Teorell, J.; Altman, D.; Bernhard, M.; Fish, M. S.; Glynn, A.; Hicken, A.; Luhrmann, A.; Marquardt, K. L.; McMann, K.; Paxton, P.; Pemstein, D.; Seim, B.; Sigman, R.; Skaaning, S.-E.; Staton, J.; Cornell, A.; Gastaldi, L.; Gjerlow, H.; Mechkova, V.; von Romer, J.; Sundtrom, A.; Tzelgov, E.; Uberti, L.; Wang, Y.-T.; Wig, T.; and Ziblatt, D. (2019) V‑Dem Codebook v9. Gothenburg: Varieties of Democracy Project.
Cox, G. W. (2012) “Was the Glorious Revolution a Constitutional Watershed?” Journal of Economic History 72 (3): 567–600.
De Haan, J.; Lundstrom, S.; and Sturm, J.-E. (2006) “Market-Oriented Institutions and Policies and Economic Growth: A Critical Survey.” Journal of Economic Surveys 20 (2): 157–91.
Dincecco, M., and Katz G. (2016) “State Capacity and Long-Run Economic Performance.” Economic Journal 126 (590): 189–218.
Dincecco, M., and Prado, M. (2012) “Warfare, Fiscal Capacity, and Performance.” Journal of Economic Growth 17: 171–203.
Feenstra, R. C.; Inklaar, R.; and Timmer, M. P. (2015) “The Next Generation of the Penn World Table.” American Economic Review 105 (10): 3150–82.
Fukuyama, F. (2004) State-Building: Governance and World Order in the 21st Century. Ithaca, N.Y.: Cornell University Press.
__________ (2011) The Origins of Political Order: From Prehuman Times to the French Revolution. New York: Farrar, Straus and Giroux.
__________ (2014) Political Order and Political Decay: From the Industrial Revolution to the Globalization of Democracy. New York: Farrar, Straus and Giroux.
Geloso, V., and Salter, A. (2020) “State Capacity, Economic Growth, and Reverse Causality.” Great Barrington, Mass.: American Institute for Economic Research. Available at www.aier.org/article/state-capacity-economic-growth-and-reverse-causality (January 14).
__________ “State Capacity and Economic Development: Causal Mechanism or Corrective Filter?” Journal of Economic Behavior & Organization, forthcoming.
Gennaioli, N., and Voth, H‑V. (2015) “State Capacity and Military Conflict.” Review of Economic Studies 82 (4): 1409–48.
Gould, S. J. (1996) Full House: The Spread of Excellence from Plato to Darwin. New York: Harmony Books.
Gwartney, J.; Holcombe, R.; and Lawson, R. (2006) “Institutions and the Impact of Investment on Growth.” Kyklos 59 (2): 255–73.
Gwartney, J.; Lawson, R.; Hall, J.; and Murphy, R. H. (2019) Economic Freedom of the World. Vancouver: Fraser Institute.
Gwartney, J.; Lawson, R.; and Holcombe; R. (1999) “Economic Freedom and the Environment for Economic Growth.” Journal of Institutional and Theoretical Economics 155 (4): 643–63.
Henderson, D. (2020) “The Meaning of Libertarianism.” Defining Ideas. Available at www.hoover.org/research/meaning-libertarianism (January 9).
Irigoin, A., and Grafe, R. (2012) “Bounded Leviathan: Or Why North and Weingast Are Only Right on the Right Half.” MPRA Paper No. 39722.
Johnson, N. D., and Koyama, M. (2017) “States and Economic Growth: Capacity and Constraints.” Explorations in Economic History 64: 1–20.
Karaman, K. K., and Pamuk, S. (2013) “Different Paths to the Modern State in Europe: The Interaction between Warfare, Economic Structure, and Political Regime.” American Political Science Review 107 (3): 603–26.
Kaufmann, D.; Kray, A.; and Mastruzzi, M. (2009) “Governance Matters VIII: Aggregate and Individual Governance Indicators, 1996–1998.” World Bank Policy Research Working Paper No. 4978.
__________ (2010) “The Worldwide Governance Indicators: Methodology and Analytical Issues.” World Bank Policy Research Working Paper No. 5430.
Leeson, P. (2014) Anarchy Unbound: Why Self-Governance Works Better Than You Think. New York: Cambridge University Press.
Leeson, P., and Harris, C. (2018) “Wealth-Destroying Private Property Rights.” World Development 107: 1–9.
Lindsey, B. (2006) “Liberaltarians: A Progressive Manifesto.” The New Republic (December 10).
Meyer, F. (1996) In Defense of Fusionism and Related Essays. Indianapolis: Liberty Fund.
Murphy, R. H. (2019) “The State Economic Modernity Index: An Index of State Building, State Size and Scope, and State Economic Power.” Economics of Governance 20: 73–101.
__________ (2020) Markets against Modernity: Ecological Irrationality, Public and Private. Lanham, Md.: Lexington Books.
Murphy, R. H., and O’Reilly, C. (2019) “Applying Panel Vector Autoregression to Institutions, Human Capital, and Output.” Empirical Economics 57 (6): 1633–52.
North, D. C. (1990) Institutions, Institutional Change, and Economic Performance. New York: Cambridge University Press.
North, D. C., and Weingast B. R. (1989) “Constitutions and Commitment: The Evolution of Institutions Governing Public Choice in Seventeenth-Century England.” Journal of Economic History 49 (4): 803–32.
Piano, E. E. (2019) “State Capacity and Public Choice: A Critical Survey.” Public Choice 178 (1): 289–309.
Pinkovskiy, M., and Sala-i-Martin, X. (2016) “Newer Need Not Be Better: Evaluating the Penn World Table and World Development Indicators Using Nighttime Lights.” NBER Working Paper No. 22216.
Pritchett, L.; Woolcock, M.; and Andrews, M. (2013) “Looking Like a State: Techniques of Persistent Failure in State Capability for Implementation.” Journal of Development Studies 49 (1): 1–18.
Savoia, A., and Sen, K. (2015) “Measurement, Evolution, Determinants, and Consequences of State Capacity: A Review of Recent Research.” Journal of Economic Surveys 29 (3): 441–58.
Stringham, E. (2015) Private Governance: Creating Order in Economic and Social Life. New York: Oxford University Press.
Tait, J. (2020) “Why Would Anyone Want to Be a Neoliberal?” Arc Digital. Available at https://arcdigital.media/why-would-anyone-want-to-be-a-neoliberal-a7dc81cbef5b (January 25).
Tomasi, J. (2012) Free Market Fairness. Princeton, N.J.: Princeton University Press.
Vasquez, I., and Porcnik, T. (2019) The Human Freedom Index. Washington: Cato Institute.
Williamson, C. (2011) “Informal Institutions Rule: Institutional Arrangements and Economic Performance.” Public Choice 139 (3): 371–87.
Zhang, F.; Hall, J.; and Yao, F. (2018) “Does Economic Freedom Affect the Production Frontier? A Semiparametric Approach with Panel Data.” Economic Inquiry 56 (2): 1380–95.
About the Authors


This work is licensed under a Creative Commons Attribution-NonCommercial-ShareAlike 4.0 International License.