From 1986 to 2008 the undocumented population of the United States grew from three million to 12 million persons, despite a five-fold increase in Border Patrol officers, a four-fold increase in hours spent patrolling the border, and a 20-fold increase in the agency’s nominal budget. Whether measured in terms of personnel, patrol hours, or budget, studies indicate that the surge in border enforcement has had little effect in reducing unauthorized migration to the United States (Massey, Durand, and Pren 2014). The strategy of enhanced border enforcement was not without consequences, however, for although it did not deter Mexicans from heading northward or prevent them from crossing the border, it did reduce the rate of return migration and redirected migrant flows to new crossing points and destinations, with profound consequences for the size, composition, and geographic distribution of the nation’s unauthorized population. Here I draw on results from a recent study (Massey, Durand, and Pren 2016) to explain how and why the unprecedented militarization of the Mexico‑U.S. border not only failed to reduce undocumented migration but also actually backfired by turning what had been a circular flow of male workers, going mainly to three states, into a large and growing population of families in 50 states.
The Rise of Illegal Migration
The origins of illegal migration go back 1965, when Congress passed amendments to the Immigration and Nationality Act that placed numerical limits on immigration from the Western Hemisphere. At the same time, it canceled a longstanding guest worker agreement with Mexico. Subsequent legislative amendments further tightened restrictions on Mexican entry until by 1976 Mexico was left with an annual quota of just 20,000 legal resident visas per year and no temporary work visas at all.
The conditions of labor supply and demand had not changed, however, and network connections between Mexican workers and U.S. employers were well established by 1965. As a result, once opportunities for legal entry disappeared, migration did not stop but simply continued under undocumented auspices. By 1979 the annual inflow of Mexican workers had returned back to levels that prevailed in the late 1950s, and as before, the migration was overwhelmingly circular (Massey and Pren 2012). In practical terms, then, little had changed between the late 1950s and the late 1970s. Similarly sized flows of migrants were going to the same destinations in the same U.S. states and returning after short periods of work.
However, in symbolic terms, the situation had changed dramatically, for now the vast majority of the migrants were “illegal” and thus by definition “criminals” and “lawbreakers.” The rise of illegal migration created a new opening for political entrepreneurs to cultivate a politics of fear, framing Latino immigration as a grave threat to the nation (Chavez 2008). Fear is a well-established tool for political mobilization, and throughout history humans have found it difficult to resist the temptation to cultivate fear of outsiders in order to achieve self-serving goals. In response to the advent of illegal migration after 1965, three prominent categories of social actors succumbed to this temptation: bureaucrats, politicians, and pundits.
The bureaucratic charge was led by the commissioner of the U.S. Immigration and Naturalization Service, Leonard F. Chapman, who in a 1976 Reader’s Digest article warned Americans that a new “silent invasion” of “illegal aliens” was threatening the nation, with “8 million” already present and “at least 250,000 to 500,000 more arriving each year. . . . milking the U.S. taxpayer of $13 billion annually by taking away jobs from legal residents and forcing them into unemployment” (Chapman 1976: 188–89). He went on to advocate the passage of restrictive immigration legislation, contending that it was “desperately needed to help us bring the illegal alien threat under control.”
Another prominent politician contributing to the Latino Threat Narrative was President Ronald Reagan, who in 1985 declared undocumented migration “a threat to national security” and warned that “terrorists and subversives [are] just two days driving time from [the border crossing at] Harlingen, Texas” and that communist agents were ready “to feed on the anger and frustration of recent Central and South American immigrants who will not realize their own version of the American dream” (Massey, Durand, and Malone 2002: 87).
Pundits made their contributions to the Latino Threat Narrative in order to sell books and boost media ratings. TV personality Lou Dobbs (2006), for example, told Americans that the “invasion of illegal aliens” was part of a broader “war on the middle class.” The political commentator Patrick Buchanan (2006) alleged that illegal migration was part of an “Aztlan Plot” hatched by Mexican elites to recapture lands lost in 1848. Harvard Professor Samuel Huntington (2004: 30), meanwhile, warned that “the persistent inflow of Hispanic immigrants threatens to divide the United States into two peoples, two cultures, and two languages. . . . The United States ignores this challenge at its peril.”
None of these pronouncements was based on any substantive understanding of the realities of undocumented migration or any real evidence. At best, they were distortions designed to cultivate fear among native-born white Americans for political gain. Despite ample research challenging the portrayal of illegal migration as an out-of-control invasion threatening U.S. society, the Latino Threat Narrative proved remarkably resilient and continued to gain traction, leading to rising public demands for more vigorous border enforcement. Over time, as more Border Patrol Officers were hired and given more equipment and matériel, the number of apprehensions rose, an outcome that was then broadcast as self-evident proof of the ongoing “alien invasion,” justifying additional agency requests for still more enforcement resources. The result was a self-feeding cycle of enforcement, apprehensions, greater enforcement, more apprehensions, and still more enforcement that steadily militarized the border.
The Effect of Militarization on Border Outcomes
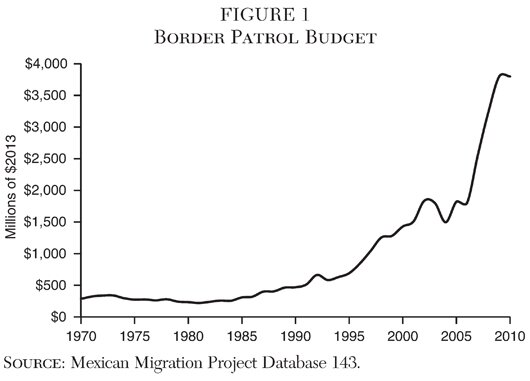
The dramatic increase in the intensity of border enforcement is indicated in Figure 1, which shows the size of the Border Patrol’s budget from 1970 through 2010 in constant 2013 dollars. In real terms, the budget remained flat from 1970 through 1986, when the Immigration Reform and Control Act (IRCA) funded a significant increase in the size of the Border Patrol. The curve rises slowly at first but accelerates after the passage of the 1996 Illegal Immigration Reform and Immigrant Responsibility Act and then rises exponentially with the passage of the USA PATRIOT Act in 2001 (a tortured backronym that stood for “Uniting and Strengthening America by Providing Appropriate Tools Required to Intercept and Obstruct Terrorism Act of 2001”). These accelerations in the enforcement effort occurred despite the fact that the actual inflow of migrants had stabilized around 1979.
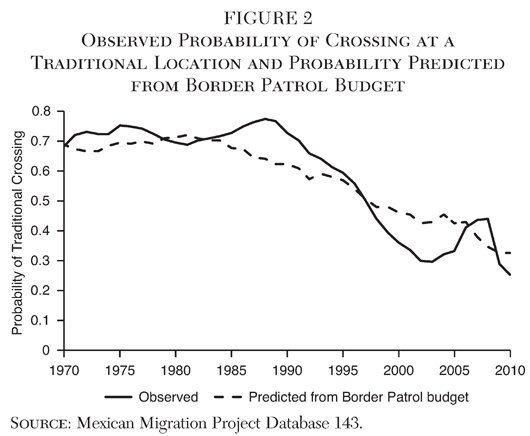
Figure 2 draws upon estimates derived by Massey, Durand, and Pren (2016) to plot trends in the location of unauthorized border crossings between 1970 and 2010. The solid line indicates the relative share of undocumented migrants crossing at traditional locations in California (San Diego and Calexico) and Texas (El Paso and adjacent territory in New Mexico). From 1970 through 1988, 70 percent to 80 percent of all undocumented migrants crossed at these locations, with no real trend upward or downward.
Although full-scale militarization did not occur in El Paso until the launching of Operation Blockade in 1993 and not in San Diego until the launching of Operation Gatekeeper in 1994, the enforcement resources authorized by IRCA in 1986 were initially targeted to these border sectors. As a result, the share of crossings at the two traditional sites began to decline as early as 1988, falling from 70 percent that year to 59 percent in 1995. Then in the wake of the two special border operations, the decline accelerated perceptibly and continued over the next several years, reaching a low of 30 percent in 2003 before rebounding to 44 percent in 2008 and then falling to an all-time low of 25 percent in 2010. Rather than crossing into California or Texas, between 1988 and 2003 migrants increasingly moved through the Sonoran Desert toward new crossing points along the border with Arizona.
In order to test the extent to which this marked shift in the geography of border crossing stemmed from the rise in border enforcement, Massey, Durand, and Pren (2016) used data from the Mexican Migration Project to estimate a logistic regression equation predicting whether undocumented migrants crossed at a traditional location (1 if yes, 0 otherwise) from the size of the Border Patrol budget (expressed as an instrumental variable), while controlling for individual, household, and contextual circumstances. In order to illustrate the causal effect of enforcement on the geography of unauthorized border crossings, the authors used the estimated regression using instrumental variable methods, and then inserted logged values of the Border Patrol budget instrument into the equation to generate the predicted probability of a traditional crossing, all other variables constant at their means values. The resulting predicted probabilities are plotted as a dashed line in Figure 2, along with the solid line described above showing the actual share crossing at traditional locations. As can be seen, the predicted probabilities very clearly trace the downward trajectory of traditional border crossings over time, indicating that the militarization of the border was indeed the principal cause of the trend that emerged after the mid-1980s.
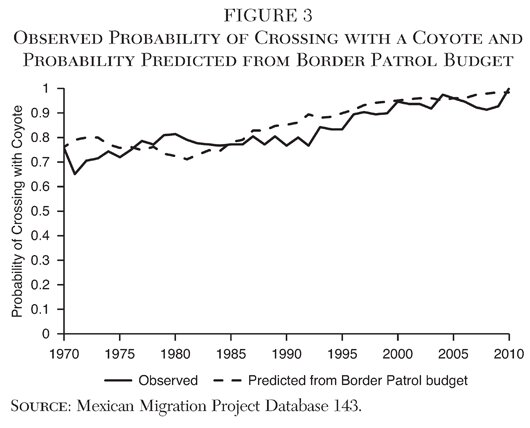
As migrants were diverted away from relatively safe and well-trod urban pathways into remote, isolated, and inhospitable sectors along the border, the crossings grew increasingly difficult and hazardous, while the share relying on the services of a guide, which was already high, steadily rose. The solid line in Figure 3 shows the observed trend in the percentage of undocumented migrants crossing with a paid guide, or coyote, from 1970 to 2010 (from Massey, Durand, and Pren 2016). Starting from usage levels around 70 percent in the early 1970s, the utilization of coyotes increased steadily over time to reach 100 percent by 2010. In order to observe the causal effect of rising border enforcement, Massey, Durand, and Pren (2016) inserted logged values of the Border Patrol budget instrument into the prediction equation while holding other factors constant at their means to generate the expected probabilities of crossing with a coyote. These are also plotted as a dashed line. Once more, it is clear that rising border enforcement caused the shift toward greater coyote use. In essence, the militarization of the border transformed what had been a common practice used by most migrants into a universal practice used by all migrants.
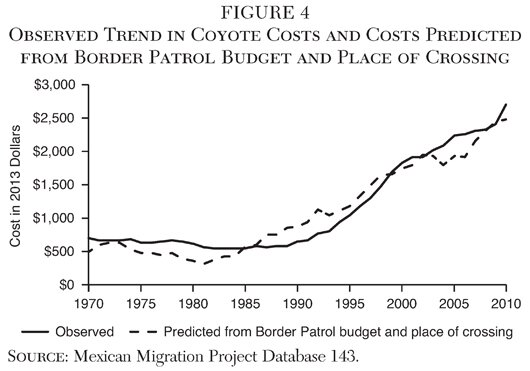
As border crossing increasingly moved into remote locations far from points of employment and settlement, the services provided by coyotes became increasingly complicated, elaborate, and costly. Figure 4 shows the trend in the average cost of a coyote in constant dollars from 1970 through 2010. Crossing costs generally trended slowly downward in real terms during the 1970s and early 1980s, as networks expanded and border crossing became institutionalized, going from $700 in 1970 to around $550 in 1982, where it remained through 1989. Thereafter, coyote costs begin a rapid rise to reach $1,900 in 2000 and $2,700 in 2010.
To establish a causal connection between border enforcement and the costs of migration analytically, Massey, Durand, and Pren (2016) estimated a Tobit model to predict coyote costs as a function of the Border Patrol budget instrument, place of crossing, and the usual control variables, again inserting the log of the Border Patrol budget instrument into the prediction equation, along with the observed proportion crossing at nontraditional locations and mean values of other controls to generate predicted crossing costs. These are plotted as the dashed line in Figure 4. As can be seen, the observed rise in crossing costs corresponds very closely to the trend predicted from the enforcement budget, clearly pointing to the militarization of the border as the primary cause for the increase in coyote prices.
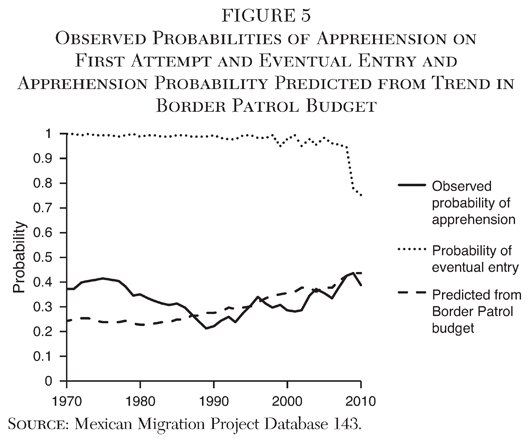
The ultimate outcome of interest to policymakers is not where or how migrants attempt to cross into the United States, but the likelihood of their being apprehended and whether they are prevented from entering the country. The solid line in Figure 5 shows the observed probability of apprehension during a first undocumented trip to the United States derived by Massey, Durand, and Pren (2016). The exponential increase in border enforcement did not translate into higher apprehension probabilities. For most of the 1970s the probability of apprehension during crossing varied narrowly between 0.37 and 0.42. After 1978 it began to trend downward and reached a nadir of 0.21 in 1989. Thereafter, the probability rose slowly back upward to peak at a value of 0.44 in 2009—a rise incommensurate with the exponential increased in enforcement.
As before, the authors estimated an equation to examine the effect of the Border Patrol budget instrument on the likelihood of apprehension (1 if yes, 0 otherwise) in the presence of controls, and then they inserted the log of the budget instrument into the resulting equation, along with observed coyote costs, to generate the values plotted as a dashed line in Figure 5. Their equations indicated that rising enforcement did increase the probability of apprehension, but that this effect was offset by the rising quality of the services provided by coyotes (as proxied by their cost). In the end, the massive increase in border enforcement had a rather modest effect on likelihood of apprehension, increasing the predicted probability from 0.24 to 0.44 over a period of four decades.
Whatever the probability of apprehension might be on any given attempted crossing, apprehended migrants are free to try again once they are returned to Mexico. Until recently, Mexicans caught at the border did not undergo formal deportation proceedings. They simply signed a “voluntary departure order” waiving their right to a hearing and authorizing the Border Patrol to escort them “voluntarily” back across the border. Once in Mexico, they simply tried again and again until success was achieved. The degree to which these repeated crossing attempts were successful is indicated by the dotted line shown at the top of Figure 5, which plots the annual probability of ultimately gaining entry to the United States over multiple attempts on a single trip. A trip constitutes one episode at the border no matter how many attempts were made and no matter what the outcome.
Entry probabilities were virtually constant through 1998, running at or just below 1.0, indicating that eventual entry during this time was a near certainty. Between 1999 and 2008, the probability of entry varied between 0.95 and 0.98 but remained high. Although the probability dropped to a low of 0.75 in 2010, by then almost no Mexicans were attempting to cross in the first place, rendering the entry probability moot in determining the volume of undocumented migration. In the end, from 1970 to the year 2008, when net undocumented migration from Mexico went negative and stabilized at zero, the likelihood of ultimate entry into the United States never fell below 0.95, despite the massive increase in the budget of the Border Patrol.
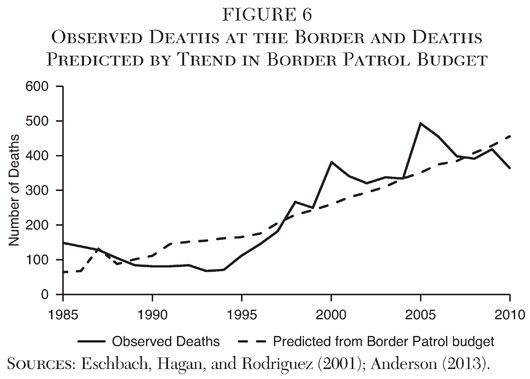
As noted, successful crossings came at an increasing financial cost, and statistics on deaths among undocumented migrants during border crossings also suggest that they came at increasing physical cost as well. Figure 6plots the number of border deaths as a solid line from 1985 to 2010, with data for 1985–98 coming from Eschbach, Hagan, and Rodriguez (2001) and tallies for 1998–2012 coming from Anderson (2013). As can be seen, the number of border deaths actually fell from 1985 to 1993, from 147 to 67. Once Operations Blockade and Gatekeeper were unleashed in 1993 and 1994, however, the figure rose to peak at 482 deaths in 2005 before falling back to 365 in 2010. However, very few Mexicans were attempting an unauthorized border crossing in 2010 and the number of dead was still five times that observed in the early 1990s, when hundreds of thousands of attempts were undertaken each year, implying a much higher death rate.
To assess whether the increase in deaths could be attributed to the increase in enforcement, Massey, Durand, and Pren (2016) regressed the total number of border deaths shown in Figure 6 on the logged Border Patrol budget instrument, obtaining an r2 of 0.64 with the equation. Plugging annual values of the budget instrument into the equation yielded the dashed trend line shown in Figure 6, again pointing to rising enforcement as the principal cause of the growing toll of death along the Mexico-U.S. border. They estimate that if the Border Patrol budget had remained at its 1986 value through 2010, there would have been a total of 5,119 fewer deaths along the border.
The Effect of Militarization on Migrant Behavior
The context of migrant decisionmaking was clearly altered by U.S. border policies during the late 1980s and 1990s. During the 1970s and early 1980s, migrants knew they could come and go across the border at relatively low cost and risk and easily sustain a circular pattern of migration. However, by the mid-1990s and early 2000s, the likelihood of getting into the United States remained high whereas the costs and risks of border crossing became dramatically higher, rendering circular migration unattractive. Post-IRCA research on the earnings of undocumented migrants also suggests that the wage penalty paid by undocumented migrants increased after IRCA, thereby reducing expected earnings in the United States (Massey and Gentsch 2014), which in turn induced them to remain longer in the United States to render a trip profitable.
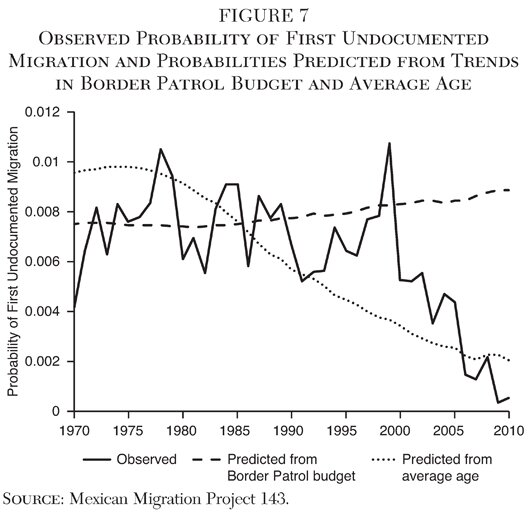
Undocumented migration begins when an aspiring migrant decides to head northward without documents and attempt a first entry into the United States. In their analysis, Massey, Durand, and Pren (2016) drew on the migration histories collected from male household heads surveyed by the Mexican Migration Project to compute the probability of departing on a first trip to the United States. The result of this computation is indicated the solid line in Figure 7. As might be expected, given the volatility of political and economic conditions in the United States and Mexico from 1970 to 2010, there is considerable year-to-year fluctuation in the probability of taking a first undocumented trip. From 1971 to 1999, the probability of first departure fluctuated between 0.005 and 0.011 with no clear trend, but afterward the likelihood of leaving without documents went into a steady, though jagged decline to levels near zero in 2009 and 2010, a pattern consistent with results from aggregate estimates indicating the end of undocumented migration after 2008 (Passel, Cohn, and Gonzalez-Barrera 2013).
In order to assess the effect of different factors on the likelihood of initiating undocumented migration, Massey, Durand, and Pren (2016) used a logistic model to regress a dummy variable indicating whether a Mexican male departed in year t+1 (1 if yes, 0 otherwise) on independent variables defined in year t. They found that the Border Patrol budget instrument had no significant effect on the likelihood of initiating undocumented migration, but that the likelihood of departure fell sharply with age. Among contextual factors, the likelihood of taking a first undocumented trip was also strongly predicted by employment growth and wage rates on the U.S. side and in the opposite direction by GDP growth on the wage rates on the Mexican side.
The dashed line in Figure 7 was derived by inserting the log of the Border Patrol budget instrument into the equation, along with mean values of other variables. The flat line confirms the lack of any effect of border enforcement on the likelihood of leaving for the United States without documents. Instead, as indicated by the dotted line, which was generated by inserting the average age into the equation while holding other variables constant at their means, the declining probability of undocumented migration is accounted for by the rising age of people likely to undertake a first trip. The average age of those in the labor force but lacking prior migratory experience rose steadily from 23.4 in 1972 to 45.9 in 2010. This sharp increase stems from two complementary dynamics: (1) the sharp drop in Mexican childbearing from a Total Fertility Rate of 7.2 children per woman in 1965 to a value of 2.3 today, and (2) the steady selection of young men out of the population taking a first trip.
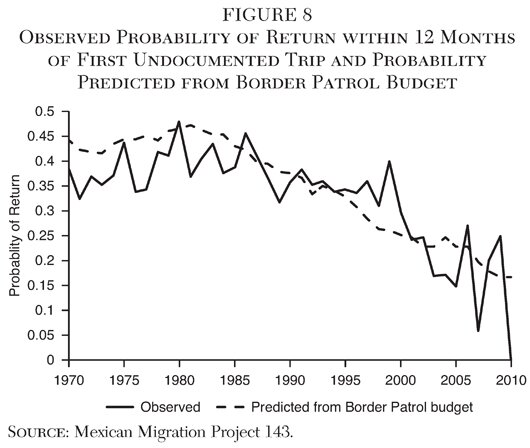
The solid line in Figure 8, computed from migration histories gathered from household heads, shows the observed trend in the probability of returning to Mexico within a year of entering on a first undocumented trip. As with departures, the likelihood of return varies jaggedly from year to year, but generally ranges from 0.30 to 0.45 through 1999, when the probability declines sharply to reach zero by 2010, albeit with oscillations in the late 2000s owing to smaller numbers of first-time migrants going to the United States.
In order to assess the degree to which rising border enforcement accounts for this downward trend, Massey, Durand, and Pren (2016) used a logistic regression model to predict whether a migrant returned within 12 months of entry (1 if yes, 0 otherwise). They found that the primary force driving return probabilities down over time was the increasing border enforcement. The dashed line in Figure 8 shows predicted probabilities generated by inserting the logged Border Patrol budge instrument into the equation while holding other variables constant at their means. Whereas the predicted probability fluctuated around 0.45 through 1984, after that date the likelihood of return migration moved steadily downward to reach a value of 0.17 in 2010, a decline of 62 percent.
Conclusion
The earlier results suggest that border enforcement has not proven to be an effective strategy for controlling Mexican immigration to the United States. Indeed, it has backfired by curtailing a longstanding tradition of circulatory migration and promoting the large-scale settlement of undocumented migrants who otherwise would have continued to move back and forth between countries. Although the militarization of the border had no effect on the likelihood of initiating undocumented migration to the United States, it did have powerful unintended consequences—pushing migrants away from traditional crossing points in El Paso and San Diego into hostile territory in the Sonoran desert, which increased the physical risks of undocumented border crossing. It also increased the need to rely on paid smugglers, which in turn increased the costs of undocumented border crossing. Rising border enforcement had only a modest effect on the likelihood of apprehension during a crossing attempt and no effect at all on the likelihood of gaining entry over a series of attempts.
The combination of increasingly costly and risky trips and the near certainty of getting into the United States created a decisionmaking context in which it made economic sense to migrate but not return home, so as to avoid facing the high costs and risks coming back. In response to the changed incentives, the probability of returning from a first trip fell sharply, going from a high of 0.48 in 1980 to zero in 2010. With no effect on the likelihood of departure or entry to the United States but a strong negative effect on the likelihood of returning to Mexico, only one outcome was possible: the net rate of entry increased and the growth of the undocumented population accelerated.
Rather than blocking the preference of Mexican workers to move back and forth across the border, a better strategy would be to implement policies that encourage return migration, such as lowering the costs remitting U.S. earnings, paying tax refunds to returned migrants, making legal immigrants eligible for U.S. entitlements if they return to Mexico, and cooperating with Mexican authorities to create attractive options for savings and investment south of the border. In the end, the billions of dollars wasted on counterproductive border enforcement would be better spent on structural adjustment funds channeled to Mexico to improve its infrastructure for public health, education, transportation, communication, banking, and insurance to build a stronger, more productive, and more prosperous North America.
References
Anderson, S. (2013) How Many More Deaths? The Moral Case for a Temporary Worker Program. Washington, D.C.: National Foundation for American Policy.
Buchanan, P. J. (2006) State of Emergency: The Third World Invasion and Conquest of America. New York: Dunne.
Chapman, L. F. (1976) “Illegal Aliens: Time to Call a Halt!” Reader’s Digest (October): 188–92.
Chavez, L. R. (2008) The Latino Threat: Constructing Immigrants, Citizens, and the Nation. Stanford, Calif.: Stanford University Press.
Dobbs, L. (2006) War on the Middle Class: How the Government, Big Business, and Special Interest Groups Are Waging War on the American Dream and How to Fight Back. New York: Viking.
Eschbach, K.; Hagan, J.; and Rodriguez, N. (2001) “Causes and Trends in Migrant Deaths along the U.S.-Mexican Border, 1985–1998.” Working Paper Series 01–4, Center for Immigration Research, University of Houston.
Huntington, S. P. (2004) “The Hispanic Challenge,” Foreign Policy (March/April): 30–45.
Massey, D. S., and Pren, K. A. (2012) “Unintended Consequences of U.S. Immigration Policy: Explaining the Post-1965 Surge from Latin America.” Population and Development Review 38 (1): 1–29.
Massey, D. S.; Durand, J.; and Malone, N. J. (2002) Beyond Smoke and Mirrors: Mexican Immigration in an Age of Economic Integration. New York: Russell Sage Foundation.
Massey, D. S.; Durand, J.; and Pren, K. A. (2014) “Explaining Undocumented Migration.” International Migration Review 48: 1028–61.
__________ (2016) “Why Border Enforcement Backfired.” American Journal of Sociology 121 (5): 1557–1600.
Massey, D. S., and Gentsch, K. (2014) “Undocumented Migration and the Wages of Mexican Immigrants in the United States.” International Migration Review 48 (2): 482–99.
Passel, J. S.; Cohn, D.; and Gonzalez-Barrera, A. (2013) Population Decline of Unauthorized Immigrants Stalls May Have Reversed. Washington: Pew Research Center’s Hispanic Trends Project.
