Public colleges have two main sources of income to fund their educational activities—direct state funding (often called appropriations) and tuition revenue. This study documents the history of these revenue sources over the past four decades. The goals are to (1) document the history of state funding, tuition revenue, and total educational revenue, (2) identify any long-term trends, (3) correct any misperceptions about these trends, and (4) explore the implications of these trends.
To accomplish these goals, this analysis uses data from the State Higher Education Finance (SHEF) report published annually by the State Higher Education Executive Officers Association.1 The SHEF report and this study focus on educational revenue, which excludes revenue for research, agricultural, and medical operations to highlight the revenue available for the educational activities of colleges. For simplicity, this study refers to SHEF’s education appropriations as state funding (though note that this includes local funding, which tends to be minor relative to funding from the state), and it refers to the net tuition and fee revenue as tuition revenue.2 Unless otherwise noted, the figures in this study are adjusted for inflation using the personal consumption expenditures price index.
The long-term trend for educational revenue is positive, with state funding increasing by $48 (±$18) per student per year, tuition revenue increasing by $155 (±$9) per year, and total educational revenue increasing by $202 (±$14) per year. There are two main implications of these trends. They prove that state disinvestment is a myth—states have been persistently increasing funding for higher education, not cutting it. They also disprove the common argument that tuition has been rising over the past several decades to offset cuts in state funding.
State Funding
State funding, often called appropriations, is provided by state governments directly to public colleges. The best method to determine the long-term trend in state funding is to use regression analysis. Figure 1 shows inflation-adjusted state funding per student over time (the black line) and uses a regression to determine the long-term trend (the blue dashed line, with the blue shading indicating the confidence interval). Over the past 43 years, the long-term trend shows a clear and convincing upward direction, with states providing $48 more in funding per student per year (a 95 percent confidence interval is $29–$66). The main implication of the upward trend in state funding is that the conventional wisdom, which holds that states have been disinvesting in colleges, is a myth.
![Figure 1 [web]: Gillen_Trends in Higher Education](https://infogram-thumbs-1024.s3-eu-west-1.amazonaws.com/aeb8a4dd-3cf2-40bb-b3aa-c6d6c7794ef5.jpg)
But while state disinvestment is a myth, there are two caveats to consider. First, a pattern of temporary declines in state funding has occurred during and after recessions. This can be seen more clearly in Figure 2, which shows the annual change in state funding per student. State funding does tend to fall during and after recessions (the gray bars). However, these temporary declines are more than compensated for by the increases during nonrecession years. In other words, state funding follows the pattern of modern economic growth—a positive long-term trend with occasional temporary dips.
![Figure 2 [web]: Change in State Funding per Student by Year](https://infogram-thumbs-1024.s3-eu-west-1.amazonaws.com/9752aaf7-6fcb-4554-9ab2-7494534e4140.jpg)
The second caveat is that not every state mimics the national trend. Figure 3 shows the long-term trend for each state—each state’s bar represents the 95 percent confidence interval for the change in state funding per student. Of the 50 states included in the figure, 24 have been increasing funding over time (shaded green), 20 show no statistically convincing upward or downward trend (the confidence interval includes $0) over time (shaded grey), and 6 have been cutting funding over time (shaded red). For those six states, state disinvestment is real. Of course, for every state that is disinvesting in education, four states have increased funding over time, and at least three states have no (statistically significant) upward or downward trend.
![Figure 3 [web]: Annual change in state funding per student by state](https://infogram-thumbs-1024.s3-eu-west-1.amazonaws.com/993a89eb-c410-4967-bbda-7a4320e7eba0.jpg)
Why Does the Myth of State Disinvestment Persist?
Unfortunately, the claim that colleges have been suffering from cuts in state funding, often referred to as state disinvestment, has been repeated so frequently that it has become the conventional wisdom. When evidence is marshaled to support the assertion of state disinvestment, it usually comes from the SHEF survey conducted annually by the State Higher Education Executive Officers Association. Ironically, this Cato study also uses the SHEF report as the primary data source. How can the same data be used to reach two opposite conclusions? There are two reasons: cherry-picking data and failing to adjust for inflation.
The first reason the SHEF report is often used to argue for the existence of state disinvestment is that some advocates cherry-pick the data. For example, some have argued that states have been disinvesting, noting that funding fell by $2,646 (from $10,301 to $7,655) from 2001 to 2012. However, those beginning and ending dates only represent a distorted view. In 2001, funding reached its highest level until 2021, while 2012 saw the lowest funding since 1984. If we shift the beginning and ending dates several years, it dramatically changes the conclusion. For example, from 2012 to 2023, states increased funding by $3,385 (from $7,655 to $11,040). Neither set of years accurately assesses the changes in state funding outside those cherry-picked time intervals. The regression method used in Figure 1 avoids this problem by using all available data (instead of cherry-picking) and putting less weight on the beginning and ending dates (in case the earliest and latest years are outliers).
The second reason people often falsely conclude that state disinvestment is happening is that they fail to correctly adjust for inflation. This report follows the standard procedure for adjusting for inflation, but the SHEF report does not. Three price indices commonly used to adjust for inflation include the Consumer Price Index (CPI), the Consumer Price Index Research Series (CPI-RS), and the Personal Consumption Expenditures Price Index (PCEPI). The Federal Reserve, the agency tasked with monitoring and fighting inflation, believes that the PCEPI provides the best measure of inflation because it better accounts for consumer responses to relative price changes (e.g., consumers shifting to chicken when the price of beef rises), it covers more goods and services, and its historical values are updated when new data or methods are developed.3 We therefore focus on the PCEPI value in this report.
But the SHEF report, rather than adjusting for inflation using one of the established price indices designed for that purpose, creates a homebrew index called the Higher Education Cost Adjustment (HECA), which tracks inflation for a set of assumed inputs. As the name implies, it adjusts for (assumed) costs, not inflation.4 A true inflation index can indicate whether inflation-adjusted tuition has been rising faster than inflation—the purchasing power of a dollar—or not, whereas the HECA cannot do so. Even if inflation-adjusted tuition has been rising, a HECA adjustment could show a decline if college costs were increasing even faster. Moreover, the HECA does not even accurately track assumed costs. For example, colleges have been increasingly relying on adjuncts, part-time professors that are paid a small fraction of what tenured professors make, yet the HECA assumes that this trend has had no impact on college costs. Unfortunately, many—perhaps most—readers of the SHEF report incorrectly presume that the numbers have been adjusted for inflation when they have not.
Not adjusting for inflation correctly yields a distorted impression of trends in state funding. Figure 4 shows state funding over time, adjusted for inflation after using various indices (CPI, CPI-RS, and PCEPI) or costs (HECA). Relative to price indices that measure inflation, past HECA-adjusted levels of funding are substantially overestimated. For example, nominal state funding per student in 1980 was $2,355. Adjusting for inflation using the PCEPI implies that this is the equivalent of $7,281 today. But adjusting for costs using the HECA implies that this is the equivalent of $9,949, overstating the inflation-adjusted value by 37 percent. This means states could have increased inflation-adjusted funding by 37 percent since 1980, yet the HECA-adjusted figures would have shown no change. In other words, the HECA is heavily biased toward finding state disinvestment even in cases when state funding has increased substantially.
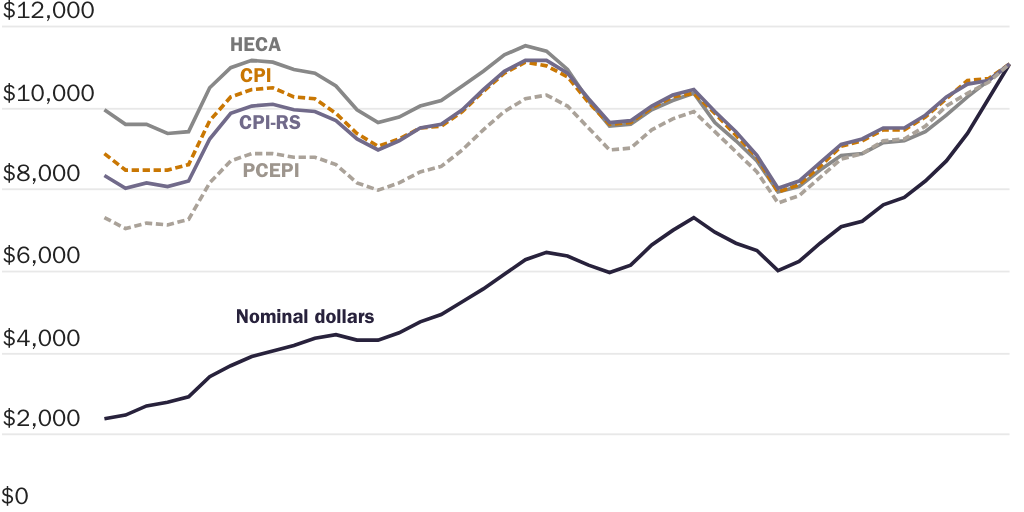
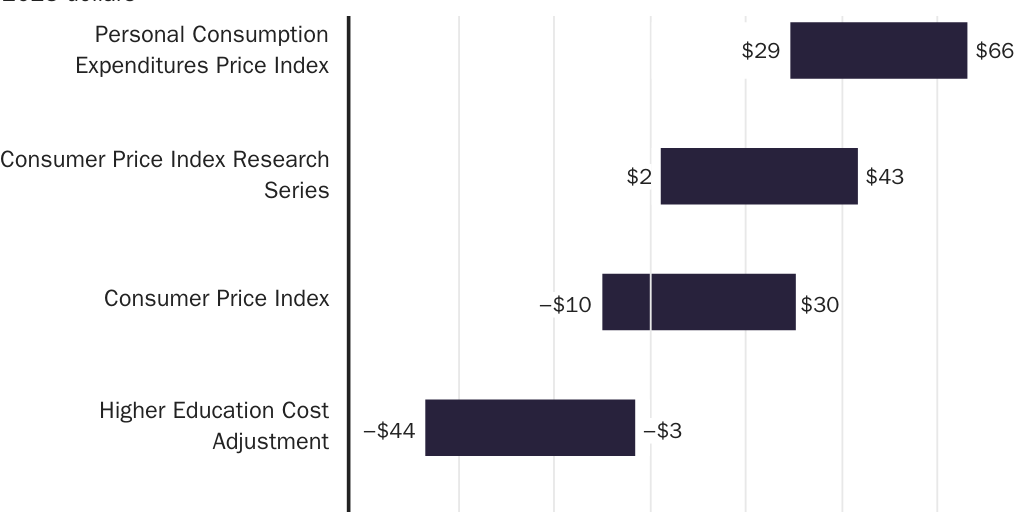
Figure 5 shows the confidence interval for the long-term trend in state funding per student by price index. The two most accurate price indices (the PCEPI and the CPI-RS) show a statistically significant positive trend. This means that state disinvestment is a myth. Yet the HECA transforms this positive trend into a negative trend, thus contributing to the misperception that state disinvestment is occurring.
Tuition Revenue
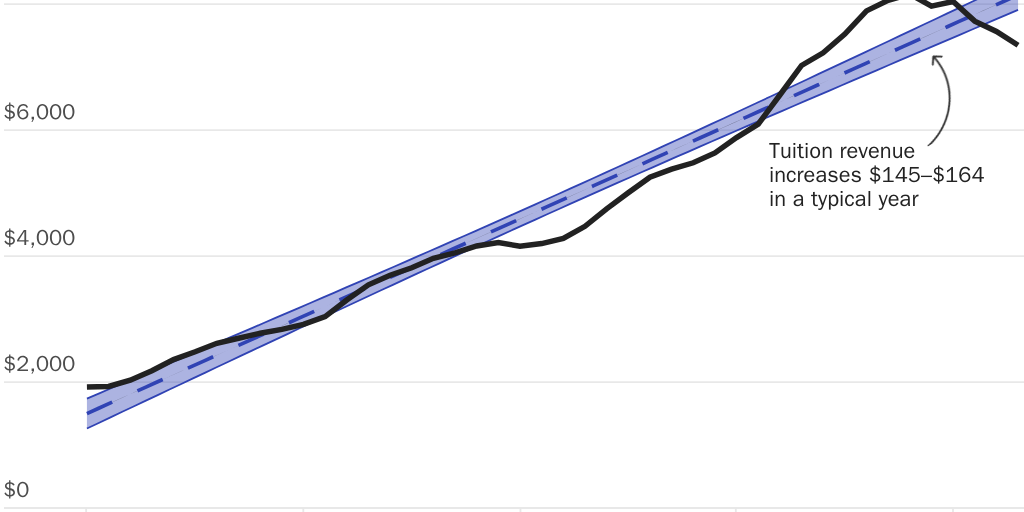
Tuition revenue is the other main source of educational expenditures.5 Figure 6 shows tuition revenue per student over time after adjusting for inflation. In short, tuition costs have mostly risen for the past several decades. There is a substantial upward trend, increasing at a rate of $155 per student per year (a 95 percent confidence interval is $145–$164). This helps explain the conventional wisdom that higher education has become less affordable.
However, though tuition has steadily increased for almost four decades, that trend may be over. Starting in 2019, tuition revenue per student plateaued and then started to decline. Figure 7, which shows the annual change in tuition revenue per student, reveals that only five years have experienced a decrease in tuition revenue per student, with four of those years occurring recently. Declining tuition revenue is a new phenomenon, and there is much we do not know about it, including what the root causes are and whether the recent declines are the beginning of a new trend.
![Figure 7 [web]: Tuition Revenue Rose for Decades but Is Now Falling](https://infogram-thumbs-1024.s3-eu-west-1.amazonaws.com/d085557f-1aa2-471d-9345-28e7012366ca.jpg)
Total Revenue
Since both state funding and tuition revenue have an upward trend, it is no surprise that total revenue—the sum of the two—has also increased over time, as shown in Figure 8. Total revenue has increased by $202 per student per year (a 95 percent confidence interval is $188–$217). Total revenue reached a new high of over $18,000 per student in 2023, almost twice the amount in 1980. With record total revenue, there is little reason to believe that colleges are currently under-resourced compared with the past few decades.
![Figure 8 [web]: Total educational revenue per student](https://infogram-thumbs-1024.s3-eu-west-1.amazonaws.com/90a1307a-5924-4322-9a70-3cff888e891b.jpg)
What Is the Relationship Between State Funding and Tuition Revenue?
One reason the myth of state disinvestment matters is that it is used to argue that state disinvestment leads to higher tuition. According to this argument, since it costs a certain amount to provide an education, colleges need to raise tuition to fill in the gap if state funding declines.
The main problem with this argument is that states have been increasing funding over time, not cutting it. This means that if tuition were adjusted to offset changes in state funding, then tuition should have been falling, not rising. For example, in 1980, inflation-adjusted state funding per student was $7,281, and in 2023, it was $11,040, an increase of $3,759. If changes in tuition are driven by changes in state funding, then tuition should have declined by $3,759, but it rose by $5,429 (from $1,924 to $7,353), a difference of $9,188. In other words, state disinvestment does not explain the rise in tuition from 1980 to 2023 because state funding didn’t decrease, it increased.
Though the idea that tuition increases are due to cuts in state funding is false, this does not mean there is no relationship between state funding and tuition revenue. Figure 9 shows a scatterplot of the change in state funding and the change in tuition revenue between 1980 and 2023 at the national level. If changes in state funding led to offsetting changes in tuition revenue, then each year’s values should fall along the red line, which represents an increase in tuition revenue of $1 for every $1 decrease in state funding. Very few years are close to the red line. Instead, the regression line shows that each $1 cut in state funding is correlated with an increase in tuition revenue of $0.16 (a 95 percent confidence interval is $0.03–$0.29).
![Figure 9 [web]: Changes in Higher Education Revenue by Source](https://infogram-thumbs-1024.s3-eu-west-1.amazonaws.com/de8123b6-62e6-43f7-84e1-bbe4032a7b96.jpg)
What about individual states? Figure 10 shows the change in state funding and the change in tuition revenue for each state from 1980 to 2023. The states are arranged in descending order based on the change in state funding, meaning that states at the top saw large increases in state funding while states at the bottom saw decreases. If changes in state funding drive changes in tuition, we should see the inverse pattern for the change in tuition revenue: large positive values at the bottom and small or negative values at the top. There is no such pattern—the change in tuition values appear almost randomly distributed.
![Figure 10 [web]: Per Student Change in State Funding and Tuition Revenue](https://infogram-thumbs-1024.s3-eu-west-1.amazonaws.com/0036fc59-0ee6-4cda-b837-4e68ed9e86ba.jpg)
This can be seen even more clearly in Figure 11, a scatterplot where each dot represents a state’s change in state funding and change in tuition revenue from 1980 to 2023. There is no statistically significant relationship between the two (the point estimate implies that a $1 increase in state funding is correlated with a $0.20 decrease in tuition revenue, but the confidence interval ranges from –$0.03 to $0.43, meaning we can’t rule out the possibility that there is no correlation).
![Figure 11 [web]: Changes in Higher Education Revenue by Source](https://infogram-thumbs-1024.s3-eu-west-1.amazonaws.com/cc0fa69b-4c11-48c3-8829-aff610357eee.jpg)
An earlier analysis using a different data source and different time period examined the changes at individual colleges and found a small positive relationship. Each $1 cut in state funding had a (statistically significant) correlation with an increase in tuition of around $0.10.6
In sum, the increase in state funding indicates that tuition is not rising to offset cuts to state funding, suggesting that something else is causing the increase in tuition. However, this doesn’t imply that there is no relationship between state funding and tuition. In fact, there is some evidence that states with greater funding increases see slower tuition growth than states that cut funding. While the relationship is quite weak, a $1 increase in state funding is correlated with a decrease in tuition of $0.10 to $0.16.
Conclusion
This report documents state funding, tuition revenue, and total education revenue (excluding research, agricultural, and medical activities) at public colleges over the past four decades. There is a clear and convincing upward trend in state funding (an increase of $48 ± $18 per student per year). This means that state disinvestment, the notion that states have been cutting funding for colleges, is a myth. Therefore, one of the most common explanations for increases in tuition—that tuition rises to make up for cuts in state funding—is also incorrect.
Over the past 43 years, there has been a clear and convincing upward trend for tuition revenue as well ($155 ± $9 per student per year). Tuition revenue has recently started to decline, but it is too soon to tell if this is the beginning of a new trend.
Since both state funding and tuition revenue have increased substantially over the past four decades, it is no surprise that total revenue has also increased ($202 ± $14 per student per year), setting a record high of over $18,000 per student in 2023.
About the Author


This work is licensed under a Creative Commons Attribution-NonCommercial-ShareAlike 4.0 International License.