Since the 1920s, the United States has tightly restricted legal immigration. This century of low legal limits has produced high levels of illegal immigration and a historic level of requests for green cards. This paper concisely reviews the history of immigration caps and charts this backlog’s development. It reveals a legal immigration system that is utterly failing to direct aspiring immigrants to pursue the American dream in lawful and orderly ways.

Only about 3 percent of the people who have submitted green card applications will receive permanent status in the United States in fiscal year (FY) 2024. At the start of this fiscal year, approximately 34.7 million applications were pending—up from about 10 million in 1996. Legal immigration caps plus uncapped categories permit only about 1.1 million green cards for FY 2024, meaning that 97 percent of green card applicants will not receive one this year.

Congress should see these green card applicants as a historic opportunity to unleash the economic potential of immigrants. Approving all existing applicants and increasing legal immigration nearly fivefold would shield the United States from many adverse consequences of demographic decline and reduce illegal immigration. Even with this seemingly massive increase in admissions, America’s immigrant population share would remain below the share in Canada, and US population and labor force growth would stay under their levels of the 1980s. Yet every day that passes without reform only makes finding a sensible solution to immigration more difficult. Congress should act now.

The Creation of Unprecedented Green Card Requests

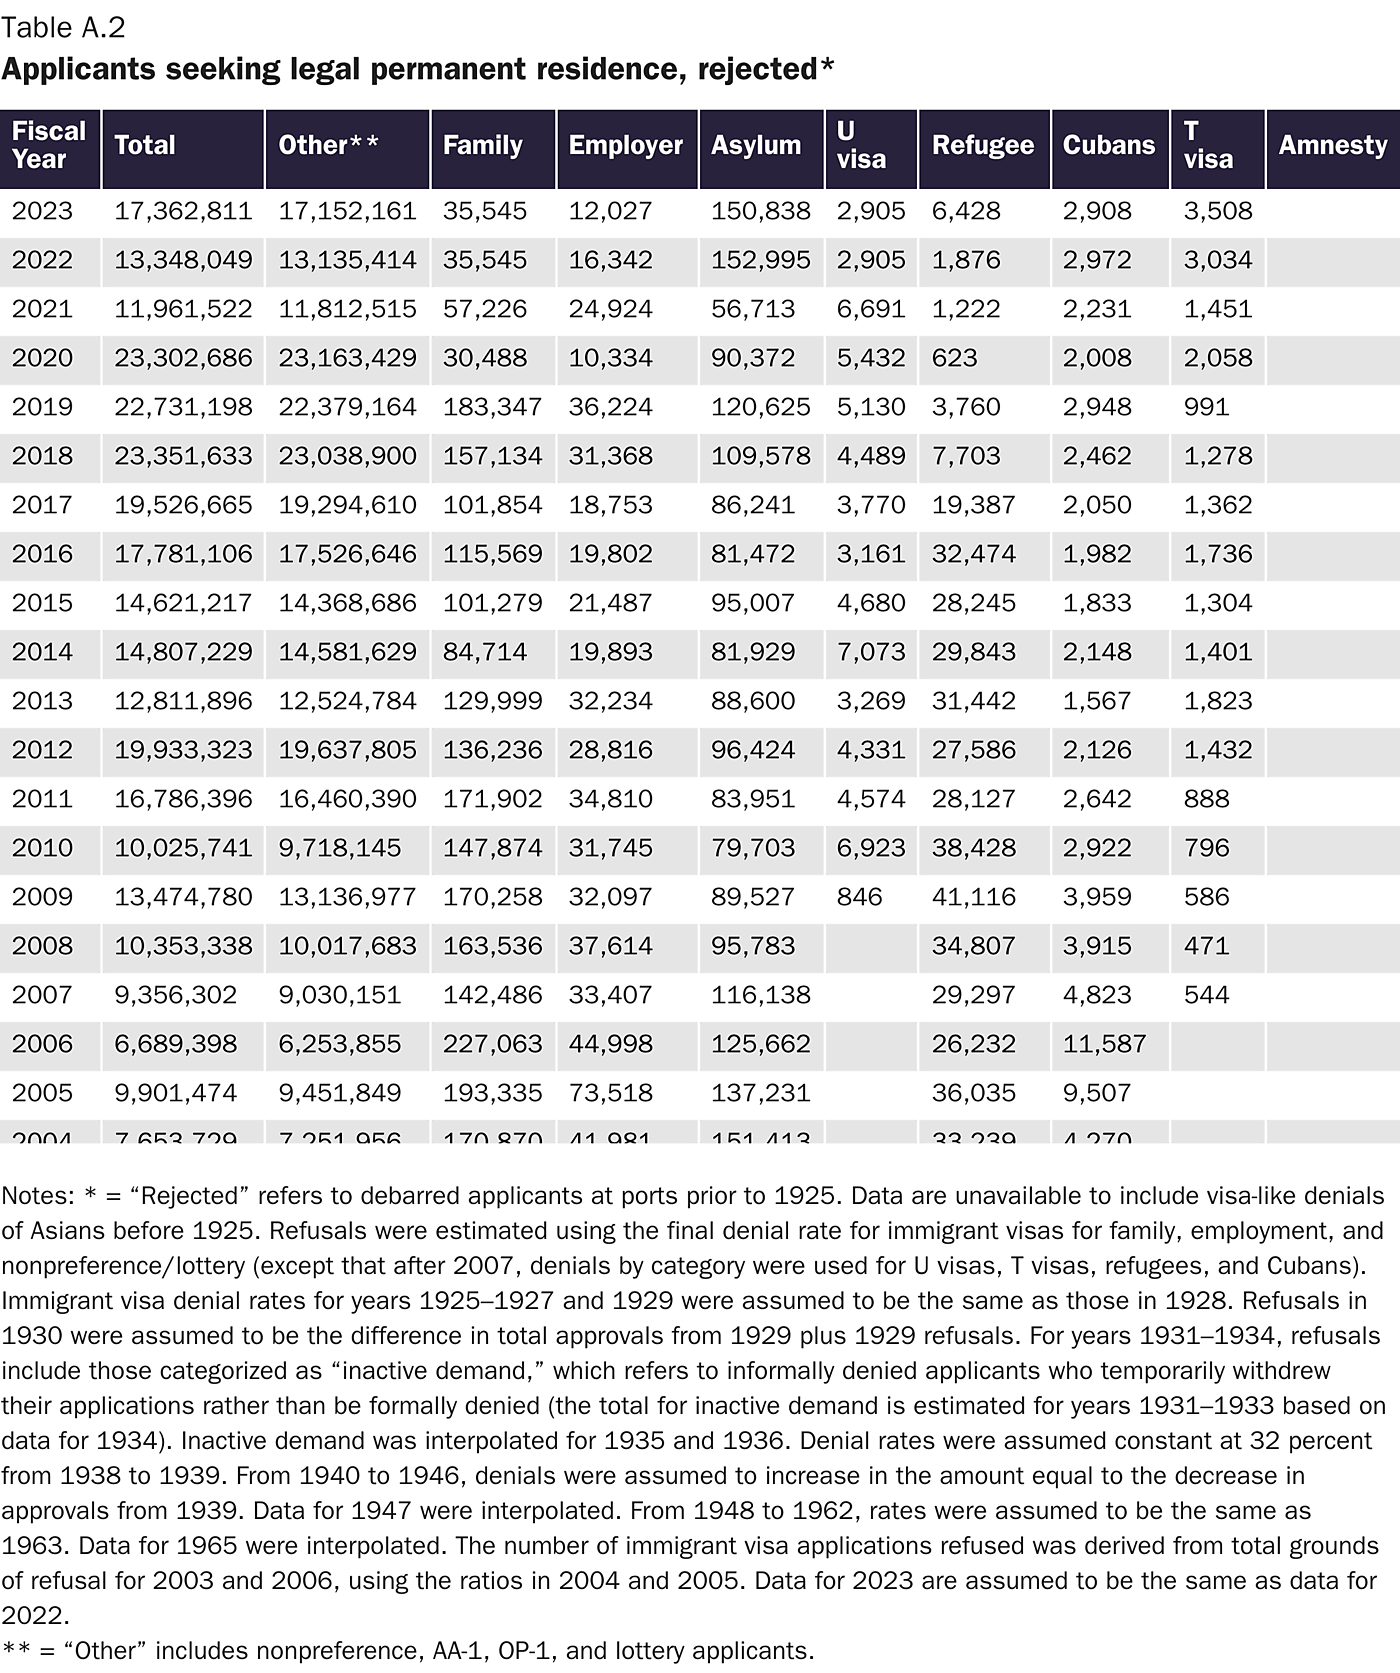
For its first century and a half, the United States had few restrictions on legal immigration. Except for the Chinese after 1882 and other Asians later, immigrants did not even apply for permission to travel to US borders.1 They simply arrived at a US port of entry and requested admission. Inspectors were required to admit anyone who showed no evidence of falling into a barred category and grant them the historically equivalent status of a modern legal permanent resident—that is, someone with the permanent right to reside in the United States. Under this system, 98.1 percent of immigrant applicants were admitted from 1888 to 1921 (Figure 1 and Tables A.1–A.3 in the Appendix).

Bier Green Card Approval Rates Figure 1 Green Card Outcomes

During that time, everyone other than the Chinese was presumed eligible to immigrate legally. After the Immigration Act of 1924, the presumption flipped.2 From that point forward, everyone was presumed ineligible until they proved their eligibility for an immigrant visa—that is, authorization to travel to the United States to request permanent residence. Proving eligibility soon became extremely difficult or impossible since Congress also banned almost all Asians and subjected immigrants in Europe, Africa, and the Middle East to new low caps on immigrant visas (or green cards).

By 1929, the new restrictive system had slashed total legal immigration by 77 percent from its pre–World War I levels. During the initial period after the first caps were imposed in 1921, most immigrants were refused admission because the visa cap set by Congress for the immigrant’s country was full. The number of backlogged immigrant visa applicants reached two million by 1929. The share of immigrant applicants who were admitted plummeted from 98 percent in 1921—the last year before the quotas went into effect—to 12 percent (Figure 1 and Tables A.1–A.3 in the Appendix). For many countries subject to caps, the cuts were more drastic.

In 1930, State Department officials implemented a new policy to deny those waiting for immigrant visas, claiming that they would become “public charges”—that is, people who cannot support themselves.3 Before 1930, able-bodied applicants were not deemed “likely to become public charges” because the vast majority found jobs and supported themselves, which remained true even in the 1930s.4 In creating its new policy, however, the State Department simply pointed to higher-than-normal US unemployment rates to exclude most applicants. As a result, immigrant visa rejections, which drop applications from the waitlists, exploded from 3.4 percent of applicants in 1928 to over 87 percent in 1934 (see red bars in Figure 1).

The high rate of denials reduced applications, which eliminated visa backlogs in all but two countries and kept legal immigration far below the annual caps. The buildup of people wanting to immigrate, however, continued unobserved. In 1934, the State Department estimated that nearly a million people would be ready to apply for immigrant visas if the public-charge policy changed.5 The high denial rates did moderate somewhat in the late 1930s, and waiting lists grew again, reaching 720,000 by June 1940—about half from Germany alone.6 During World War II, the State Department shut down the receipt of new immigrant visa registrations,7 and the admission rate hit a historic low of about 3 percent in 1943, a rate unmatched until this decade.

After World War II, the percentage of applicants admitted started to recover slowly (Figure 2 and Tables A.1–A.3 in the Appendix). Thanks to lower denial rates, fewer cap spots went to waste. At the same time, Congress passed laws to temporarily raise caps for refugees and exempt more applicants from the caps. These exceptions included all spouses of US citizens (1952), parents of US citizens (1965), and Cubans (1966). Immigration also increased from the uncapped Western Hemisphere. In 1965, Congress began to allow unused cap spots to be redistributed to backlogged nationalities. But expansion was then paired with restriction. Starting in FY 1969, Congress capped legal immigration from Western Hemisphere countries. Thereafter, the admitted share fell from 1969 to 1989 before rising temporarily when Congress waived the caps for nearly three million immigrants receiving amnesty.

In the 1990s, however, requests for green cards spiked to unprecedented levels, sending the share of applicants admitted to the lowest rate since World War II. This spike resulted from a buildup of potential applicants without close US family ties and who had given up on applying for green cards once their “nonpreference” category stopped receiving cap space in the 1970s. In response, Congress created annual green card lotteries for these nonpreference immigrants starting in the late 1980s. Unlike other applicants, who wait in line year after year, unselected lottery entrants are rejected at the end of the year, leading to a significant increase in the number of outright “rejected” applicants (red bars in Figure 2).

Bier Green Card Approval Rates Figure 2 Green Card Outcomes

Before the caps were imposed in 1921, an average of 98 percent of immigrants were approved each year. After the caps, the average year saw just 16 percent admitted. By 2023, just 3.8 percent of green card applicants received them—a 96.2 percent exclusion rate. In 2024, the rate will be even lower: just 3 percent.

Another reason for the buildup in green card requests is that the government has repeatedly failed to issue all the green cards available under the caps. Although this failure explains only a part of the backlog, correcting it would have meaningfully addressed the low rate of issuances over the past century. During the early 1930s, cap space went to waste because most applicants were wrongly denied as public charges. From the 1930s until 1965, cap space from countries with few applications went to waste because it could never be transferred to countries with high demand—a policy that Congress finally changed in 1965. Starting in the 1990s, green card cap space has again repeatedly gone unfilled, largely because of administrative processing delays that cause some of the allotment not to be issued before the end of the year.8

Approximately 6.3 million green card cap spots have gone to waste in this way since 1921. Thanks to the caps and wasted green cards, the few uncapped immigration categories (mainly spouses, minor children, and parents of US citizens and legalized immigrants) have been the primary driver of the growth in US immigrant admissions (Figure 3). To rectify these errors, Congress should require that these 6.3 million green cards be added to future caps.

Bier Green Card Approval Rates Figure 3 Green Card Cap

Green Card Requests in 2024

Figure 4 shows the total requests for green cards and the caps for FY 2024 compared with FY 1996. The total caps (plus processing capacity for uncapped categories) amount to just under 1.1 million for FY 2024. This is compared with a total applicant pool of nearly 35 million—using the most recent data available. In other words, 97 percent of green card applicants who have already applied will not receive green cards this coming year.

Although this paper will refer to them as “applicants,” these aspiring immigrants are mostly stuck at earlier stages in the process before they can even formally submit a green card application. Most are waiting for a cap number to become available or for a decision on whether they will be selected by the green card lottery, which will determine when they can file a formal green card application. The purpose of this paper is not to show how strictly officials are reviewing these final green card applications but to show how few immigrants who start the process make it to approval.

Bier Green Card Approval Rates Figure 4 Green Card Limits

Table 1 shows the number of pending green card applicants by category for 2019 and 2024. The largest growth has occurred in the asylum category, with the family, employment, and immediate relative categories accounting for most of the rest. About 5.6 million of these applicants are already inside the United States, including most employment-based and humanitarian applications and many family-based applications. Nothing precludes someone from applying for multiple green card options simultaneously. The extent of duplicate applications is unknown, but it cannot massively sway the general picture—the overwhelming majority of applicants will not get green cards.

Bier Green Card Approval Rates Table 1 Pending Green Cards

Of course, the number of applications for green cards does not reflect the true desire for legal immigration over time because the rules governing who can apply are constantly changing. For example, when the nonpreference category for immigrants without family ties ceased to receive any cap spots in the 1970s, people naturally stopped applying for the category, which reduced applications in the 1980s. When Congress created the green card lottery, the blocked applicants reappeared again. Nonetheless, the green card approval rate can provide a useful measure of just how restrictive legal immigration has become.

The Green Card Lottery: 22.2 Million (0.2 Percent Will Receive Green Cards in 2024)

By far the largest number of applicants appears in this green card category annually, with nearly 22.2 million applicants in 2023 (for the FY 2024 lottery). Unlike other categories, lottery entrants not selected and approved before the end of the year must reapply the following fiscal year if they want to try again. The lottery cap for FY 2024 will be about 55,000. This lottery cap was created in the Immigration Act of 1990 and has never been expanded despite a nearly fivefold increase in requests for green cards. The win rate for the lottery has fallen about 80 percent since 1995, when the first lottery was held, to about 0.25 percent—a 1 in 400 chance of receiving a green card (Figure 5).

Bier Green Card Approval Rates Figure 5 Green Card Lottery Numbers

Family-Sponsored Green Cards: 8.3 Million (8 Percent Will Receive Green Cards in 2024)

The family-sponsored immigration system is divided into two parts. The first part consists of capped categories for spouses and minor children of green card holders as well as for adult children and siblings of US citizens. The cap is 226,000. The second part consists of immediate relatives—including spouses, minor children, and parents of US citizens—and has no cap, but thanks to onerous procedures, the government still fails to process all the immediate relative applications that are submitted every year, leading to a processing backlog for these applicants. As Figure 6 shows, the number of pending family-sponsored applicants has increased almost every year since the 1970s, increasing from about half a million to 8.3 million. As a result of the backlogs, new applicants in some categories will face lifetime waits for many country-category combinations.9

Bier Green Card Approval Rates Figure 6 Family Based Green Card Backlog

Employment-Based Green Cards: 1.8 Million (8 Percent Will Receive Green Cards in 2024)

The employment-based green card backlog has grown to 1.8 million as of March 2023—up from about 1.2 million in 2018 when the government first provided detailed data (Figure 7). The overall cap is set at 140,000 per year plus any unused family-sponsored green cards. Because of a policy that ceased the issuance of family-sponsored immigrant visas from 2020 through 2022, the employment-based cap temporarily increased from 2021 to 2023. Despite these increases, however, requests have consistently far outstripped supply.

In FY 2024, about 8 percent of pending employment-based applications will be approved for a green card. But most of these green cards will not go to the applicants who have waited the longest. Instead, because of the country caps, applicants who apply over the next year will pass applicants from China and India—many of whom have already waited more than a decade. In fact, Indians—who make up half the applicants in the employer-sponsored categories—must wait more than a century for a green card.10

Bier Green Card Approval Rates Figure 7 Employment Based Green Card Backlog

Asylum: 1.8 Million (3 Percent Approved in 2024)

Since 1980, immigrants who receive asylum in the United States also have the option to obtain a green card. Asylum applicants must be in the United States or at a port of entry. Figure 8 shows the asylum backlog from 1980 to 2023. Nearly 1.8 million immigrants have applied for asylum and have pending cases. Unlike other categories, there is no cap on asylum, but the government processes fewer applications than it receives, which causes a backlog. Also, unlike other categories, where the vast majority of applicants are approved once a cap spot is available, and once someone gets around to processing their formal application, most asylum applicants are denied.

The high denial rate for asylum is a result of both the government’s very restrictive asylum laws and its cramped interpretation of them. Only 3 percent of asylum applicants will receive a grant in 2023, roughly 9 percent will be denied, and the rest will wait. To actually obtain a green card, asylees must file a subsequent application one year after receiving asylum, but it is primarily the initial applications that are caught in the bottleneck and are subject to the high denial rate.

Bier Green Card Approval Rates Figure 8 Asylum Applications

Refugee Program: 358,000 (35 Percent Approved in 2024)

Like asylum, the refugee program has existed since 1980 to allow people facing persecution in their home countries to relocate to the United States. Unlike asylum, however, the US government strictly limits how many people may submit refugee applications, the cap of which is set annually by the president. Unfortunately, the government has not published regular updates on the number of pending refugee applications since the mid-2000s, but it is worth noting that prior to 2006, the backlog was far below the number approved annually (Figure 9), meaning that administrative processing was quick and that almost everyone completed the process in less than a year.

Today, however, the backlog is nearly three times higher than the cap because the government takes so long to process the applications that it chooses to accept. Some reports indicate that the average refugee processing time was five years after being singled out for US resettlement.11 The refugee limit for FY 2024 is 125,000, and there were about 358,000 applications pending during 2023, meaning that at most only 35 percent of applicants can receive a green card in 2024 in theory. In reality, the processing delays have been so severe that the cap was not reached. It is probable that this situation will occur again and that at least some of the cap slots will be lost. In the last month of FY 2023, only 8,762 were admitted. At that pace, about 105,000 slots will be used, and only 29 percent of pending applications will be approved. Admitted refugees can apply to receive green cards after one year.

Bier Green Card Approval Rates Figure 9 Refugee Numbers

U Visa Crime Victims: 334,000 (7 Percent Approved in 2024)

The U nonimmigrant visa was created in 2000 for immigrants already in the United States who were the victims of certain crimes and worked with law enforcement on their cases, but it had no implementing regulations until September 2007.12 Figure 9 shows the U nonimmigrant visa backlog since 2009. The U nonimmigrant visa has a cap of 10,000 grants for primary applicants. Derivative family members on the same application are exempt. In 2023, the U nonimmigrant visa backlog was 334,000, and there were approximately 17,500 grants (Figure 10). Adding in denials, it will take over 16 years to process all pending U nonimmigrant visa applications. U nonimmigrant status is not legal permanent residence, but it allows recipients to generally apply for green cards after three years.

Bier Green Card Approval Rates Figure 10 U Visas

The US Can Assimilate Green Card Applicants

Congress should see the massive demand for green cards as a historic opportunity—an untapped, underutilized resource that can aid the country. Backlogged immigrants are likely to enter the United States and start working at higher rates than the general population, and they also appear to be more educated on average.13 The United States is facing both short- and long-term demographic and economic challenges that these aspiring Americans can help address. The US population in the 2020s is growing at the slowest rate in history (Figure 11), and almost all the growth in the past year came from immigration. The slowdown and eventual decline of the US population will have massively negative consequences for US economic growth in the 21st century.

Bier Green Card Approval Rates Figure 11 US Population Growth

The slowdown in population growth is so great that even 35 million new immigrant workers would be insufficient to meet the labor needs of the United States over the next decade. To fund Social Security at a sufficient level to cover expenses, the United States will need 38 million more workers than the government expects will be in the country by 2035.14 To get the labor force growth rate merely back to the same rate as the 1980s will take 49 million more workers, yet the 2010s saw an increase of fewer than 7 million workers.15 No one should underestimate the capacity of the US economy to handle an influx of tens of millions of additional people.

Of course, increasing the US labor force by 40 million in 10 years through immigration may seem impossible politically because many people perceive the US immigration policy as exceedingly generous. In reality, the United States ranks in the bottom third of wealthy countries for immigrants per capita.16 For the US immigrant share in the United States to reach the size of Canada’s (23 percent), it would take an immediate net increase in the US immigrant population of about over 40 million. To reach the size of Australia’s share (30 percent), it would require over 80 million. The United States has extensive flexibility to change immigration policy and remain well within the normal range for developed countries.

How to Address Green Card Backlogs

To address green card backlogs, Congress should start by waiving the unnecessarily onerous rules and arbitrary caps to approve current green card applicants. Because the current backlog reflects years of unaddressed requests, annual legal immigration would only need to increase more gradually to meet future demand. For instance, the portion of the family-sponsored backlog caused by caps that were set in 1990 is about seven million. If those caps had simply increased proportionally to increases in green cards for the uncapped immediate relative categories—an average of just 200,000 per year—six million additional green cards would have been issued in those categories, approving about 85 percent of this backlog.

Overall, since 1990, pending green card requests for family, employment, asylum, lottery, and all other categories have increased at an annual rate of about 800,000 faster than the number of approvals. Congress would need to add at least this amount to the green card caps to prevent green card backlogs from escalating again. But more will likely be needed. Though there are some moderating market and nonmarket forces that would limit how high requests can go, a much larger green card supply would also cause more qualified applicants to apply when they realize that their chances of receiving a green card have greatly increased. For this reason, the annual cap increase would need to exceed 800,000 to prevent a resurgence in the backlog.

Rather than attempt an impossible calculation, after Congress approves the existing backlog, it should assume that annual green card applications will reach about five million—equal to about 1.5 percent of the US population—for the existing categories and build flexibility into the law to allow for adjustments later. Combined with the 35 million pending applications, this creates the potential for 80 million green card issuances over the next decade. Although the United States could certainly absorb 80 million immigrants over a decade, that many green card applicants will not translate into a net increase of that many immigrants. Many green card applicants are already in the United States. Many other applicants abandon immigrating because opportunities or obligations arise in their home countries or elsewhere. Other applicants die, and among the immigrants who do come, enormous numbers return to their home countries.

During the past decade, for instance, the total immigrant population—legal and illegal—increased by just five million.17 During that time, the United States issued about 10 million green cards—about half to people outside the country and half to people adjusting from a temporary status or no status, and given the length of temporary visas, it is likely most of these entered during the past decade as well.18 The government also released over three million people at the border and recorded another two million illegal entrants who escaped apprehension.19 Millions more overstayed their visas.20 Given this reality, Congress should assume that every two green card applications translate into an increase of at most one immigrant over a 10-year period.

Granting green cards to the 35 million applicants in 2024 and then permanently increasing legal immigration to 5 million annually would likely increase the US immigrant population by only about 40 million by 2033, leading to an immigrant share of 22 percent. It would take until 2036 for the United States to hit Canada’s current 23 percent. The United States would still be tens of millions of immigrants below what it would take to reach the 28 percent the Canadian government predicts its country will reach by 2036.21 Nonetheless, such a substantial reform would erase the buildup of green card applications and put America back on a fiscally and economically sustainable demographic path. It would also greatly reduce illegal immigration.

Bier Green Card Approval Rates Figure 12 US vs Canada Immigration Population Share

Conclusion

A century of dysfunctional and restrictive immigration policy has led to an unprecedentedly high number of green card requests. Only 3 percent of green card applicants waiting for approval will likely receive permanent residence in the United States in 2024. In a world where 97 percent of applicants are turned away, the vast majority of people around the world feel that they have no way to come to the United States legally. This accurate perception leads millions to enter illegally.

The buildup of 35 million green card applicants may seem politically impossible to fix, but the United States has the capacity to assimilate an even larger number. With population and labor force growth near all-time lows, Congress should seize the chance to improve the country’s long-term demographic outlook. There is no reason to turn away people who will contribute significantly to America’s economy and society.

Appendix

Bier Green Card Approval Rates Table A1 Applicants Seeking Permanent Residence
Bier Green Card Approval Rates Table A2 Applicants Seeking Permanent Residence
Bier Green Card Approval Rates Table A3 Applicants Seeking Permanent Residence